2130
A New Diffusion-based Elastography for Quantitatively Assessing Liver Fibrosis without External Devices in a Large Set of Patients1Department of Radiology, Shuguang Hospital Affiliated to Shanghai University of Traditional Chinese Medicine, 201203, Shanghai, China, 2MR Collaboration, United Imaging Healthcare, Shanghai, China, 3Institute for Medical Imaging Technology, School of Biomedical Engineering, Shanghai Jiao Tong University, 200240, Shanghai, China
Synopsis
Due to the non-invasive superiority, Magnetic Resonance Elastography (MRE) has emerged as an alternative approach to liver biopsy, the current golden standard for staging liver fibrosis. However, the use of external vibration devices brings costs of scan time and money. Diffusion Weighted Imaging (DWI) has shown the potential to characterize liver fibrosis at a microscopic level recently. The purpose of this study is to evaluate the potential of DWI to provide quantitative estimates of tissue stiffness without external devices among patients with different types of liver fibrosis and compare the inter-method agreement between MRE and the proposed method.
Introduction
Liver fibrosis is the result of chronic liver diseases, and it can progress to cirrhosis and hepatocellular carcinoma1. In recent years, several MRI techniques has been proposed to non-invasively characterize and stage liver fibrosis, which overcome some limitations of liver biopsy, the current golden standard. MRE offers a new sight to depict tissue mechanical properties, which could be an alternative to liver biopsy because it reduces the risk of complications and sampling errors. However, the use of external mechanical vibration equipments increases the time and money costs. DWI, as another non-invasive MRI approach, offers water diffusivity information of liver at a microscopic level. We hypothesize that water diffusivity was strongly correlated with mechanical properties in liver fibrosis2 and investigated the potential of DWI as an alternative to MRE to quantitatively characterize liver mechanical properties without external devices in patients with different types of liver fibrosis - Hepatitis B and Nonalcoholic fatty liver disease (NAFLD).Methods
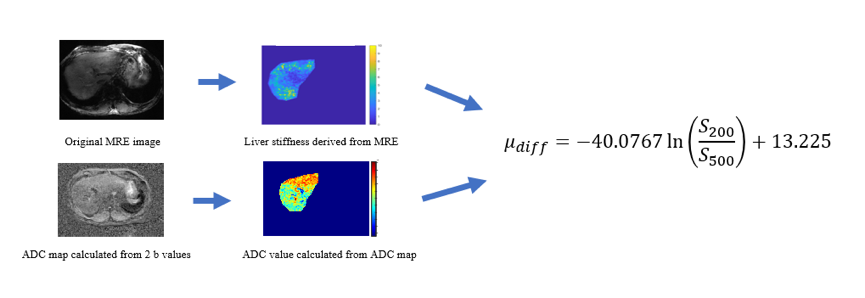
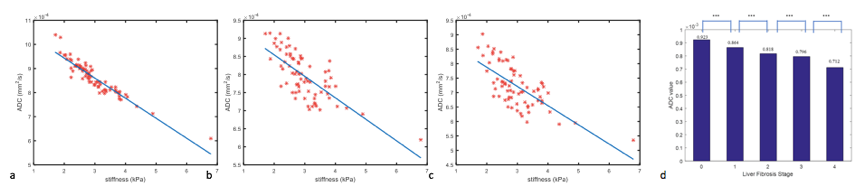
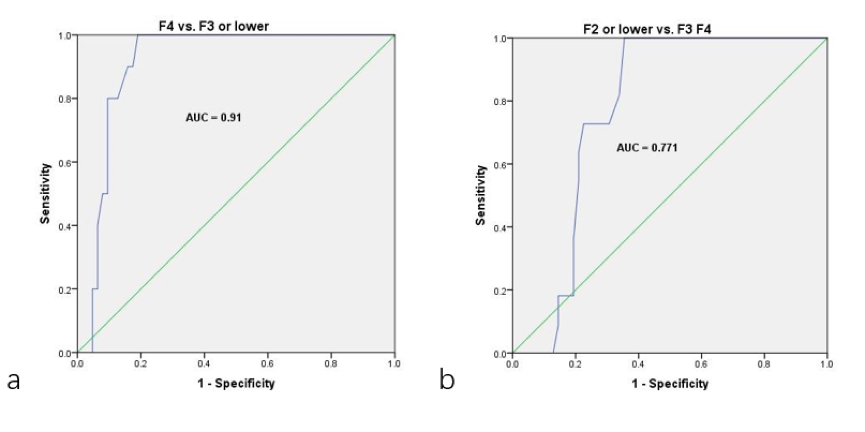
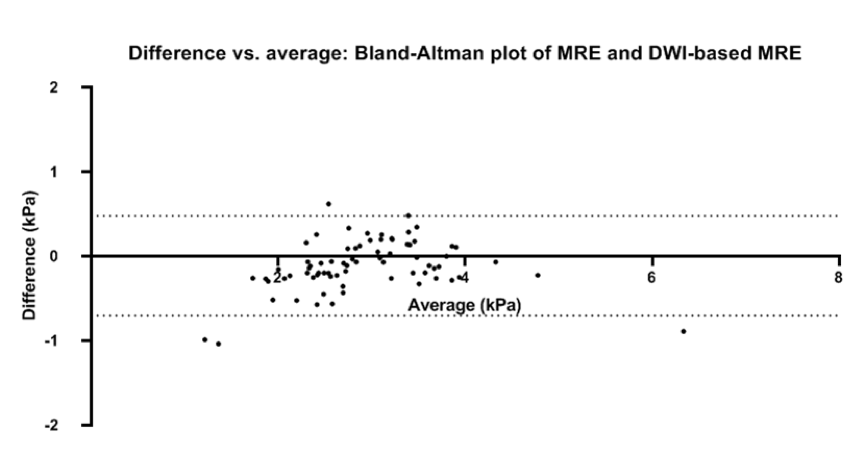
This study was approved by the institutional review board of both participating institutions. Between May and October 2020, a total of 73 patients with liver fibrosis were enrolled in this retrospective research (42 Hepatitis B patients, 16 NAFLD patients and 15 other diseases). MRI examinations were performed at a 3T scanner (uMR 780, United Imaging Healthcare, Shanghai, China) with a 32-channel body array. The MRI protocols were as follows: 1) 2D MRE sequence was acquired with the following parameters: TR/TE = 50/20.63ms, flip angle = 30°, slice thickness = 10mm, FOV = 300mm × 300mm, all examinations were carried out with an electromagnetic actuation frequency of 60 Hz3; 2) DWI was acquired based on a single-shot echo-planar imaging (EPI) sequence: TR/TE=4000/78ms, slice thickness = 5mm, FOV = 300mm × 380mm, 11b values were performed but only b = 0, 200, 500, 800, and 1200 s/mm2 were considered in this study. Tissue stiffness (μMRE) was processed from the original MRE data. Different combinations of b values (200&500, 200&800, 200&1200) were used to calculate the apparent diffusion coefficient (ADC) with the following equation: ADC=ln(SLb/SHb)/(Hb-Lb) (Equation 1), where Hb and Lb represent high b value and low b value respectively. Both μMRE and ADC were processed with corresponding in-house prototype software developed by MATLAB (Mathworks, Natick, Mass). Linear regression and Spearman’s rank correlation coefficient were performed to give an exact expression of ADC and μMRE. Comparison of ADC values between Hepatitis B and NAFLD at different stages was evaluated using two samples T-test. ROC analysis was performed to evaluate the diagnostic accuracy of ADC for staging liver fibrosis. Inter-method reliability for diffusion-based elastography and MRE were evaluated by using Bland-Altman plot.Results
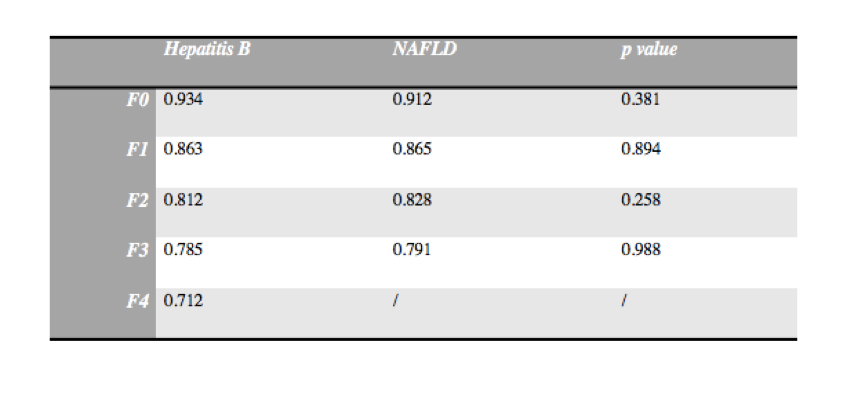
The processing flowchart was shown in Figure 1. Using MRE, the stages of fibrosis in all patients were distributed from F0 to F4. Figure 2(a)-(c) demonstrated that ADC and μMRE had a strong linear inverse relationship. ADC200&500 had the best correlation with μMRE (R2 = 0.869, p<0.001), the linear regression result was: ADC200&500=-8.3176x10⁻⁵μMRE+1.1x10⁻³. By substituting Equation 1 into the above result, stiffness from diffusion-based elastography can be obtained: μdiff=-40.0767ln(S200/S500)+13.225. A moderate correlation between ADC200&800 & ADC200&1200 and μMRE was found. (R2 = 0.527 and 0.477, respectively). Between Hepatitis B and NAFLD, no significant difference was found at different stages (Table 1). Figure 2(d) showed the mean ADC values for all 73 patients at different stage of liver fibrosis stages. With the progression of fibrosis, ADC value decreased significantly (p<0.001). The ADC values from F0 to F4 were: 0.923, 0.864, 0.818, 0.796, 0.712 x10⁻³ mm2/s, respectively. ROC analysis was displayed in Figure 3, the AUC for distinguishing F4 and F3 or lower was 0.91, and the AUC for distinguishing F2 or lower and F3 & F4 was 0.771. Bland-Altman plot was shown on Figure 4. Inter-method agreement between diffusion-based elastography and MRE was high (mean difference = 0.112±0.3 kPa, p<0.001) and showed no difference.Discussion & Conclusion
In our study, an exact expression between μMRE and ADC was well established, which indicated that tissue stiffness can be obtained from ADC. This inverse relationship between μMRE and ADC can be explained that: with the progression of liver fibrosis, tissue stiffness increases due to the proliferation of collagen fibers and cell shrinkage, leading to the restricted diffusion of both extracellular and intracellular water molecules, thus the decreased ADC. In this study, no significant difference was found between Hepatitis B and NAFLD patients. The high inter-method agreement validated the feasibility of diffusion-based elastography for characterizing liver fibrosis. Thus, instead of MRE, tissue stiffness can be characterized from a DWI scan without the need of external devices, which helps reduce the complexity of the examination clinically. In conclusion, this study demonstrated that DWI has the potential to act as an alternative to MRE and can quantitatively characterize liver stiffness in patients with liver fibrosis.Acknowledgements
Funding support from grant 31870941 from National Natural Science Foundation of China (NSFC) and grant 1944190700 from Shanghai Science and Technology Committee (STCSM) are acknowledged.References
1. Gupta, R.T., et al., Hepatic hemangiomas: difference in enhancement pattern on 3T MR imaging with gadobenate dimeglumine versus gadoxetate disodium. Eur J Radiol, 2012. 81(10): p. 2457-62.
2. Le Bihan D, Ichikawa S, Motosugi U. Diffusion and Intravoxel Incoherent Motion MR Imaging-based Virtual Elastography: A Hypothesis-generating Study in the Liver. Radiology. 2017 Nov;285(2):609-619. doi: 10.1148/radiol.2017170025. Epub 2017 Jun 12. PMID: 28604279.2.
3. Feng Y, Zhu M, Qiu S, Shen P, Ma S, Zhao X, Hu CH, Guo L. A multi-purpose electromagnetic actuator for magnetic resonance elastography. Magn Reson Imaging. 2018 Sep;51:29-34. doi: 10.1016/j.mri.2018.04.008. Epub 2018 Apr 19. PMID: 29679635.
Figures