2128
Diffusion kurtosis imaging (DKI) for predicting Ki-67 expression in hepatocellular carcinoma1Department of Radiology, Zhujiang Hospital, Southern Medical University, Guangzhou, China, 2Department of Radiology, Foshan First People's Hospital, Foshan, China, 3Philips Healthcare, Guangzhou, China
Synopsis
Diffusion kurtosis imaging (DKI) is a promising non-invasive method for evaluating the expression of Ki-67, a marker of cellular proliferation in HCC, which may contribute to predict recurrence and prognosis preoperatively. In this study, we evaluated the potential role of DKI in preoperative prediction of Ki-67 expression in HCC. The results show that increased MK and decreased ADC values are potential predictive biomarkers for of Ki-67 expression of in HCC.
Introduction
Hepatocellular carcinoma (HCC) is the most common primary liver cancer 1–3. Considering the invasive nature of surgery and limited organ availability, it is important to identify patients who are most likely to be cured for a long time without recurrence. In HCC patients, high levels of Ki-67 may indicate tumor aggressiveness, which is related to high early recurrence rate and poor prognosis, observed with advanced tumor stages, portal vein invasion and intra-hepatic metastasis, for example 5–7. Currently, Ki-67 expression is obtained by immunohistochemical examination after surgery. Therefore, it is urgent to develop a non-invasive method for evaluating Ki-67 expression. The purpose of this study was to evaluate the potential role of DKI for the preoperative prediction of Ki-67 expression in HCC.Materials and Methods
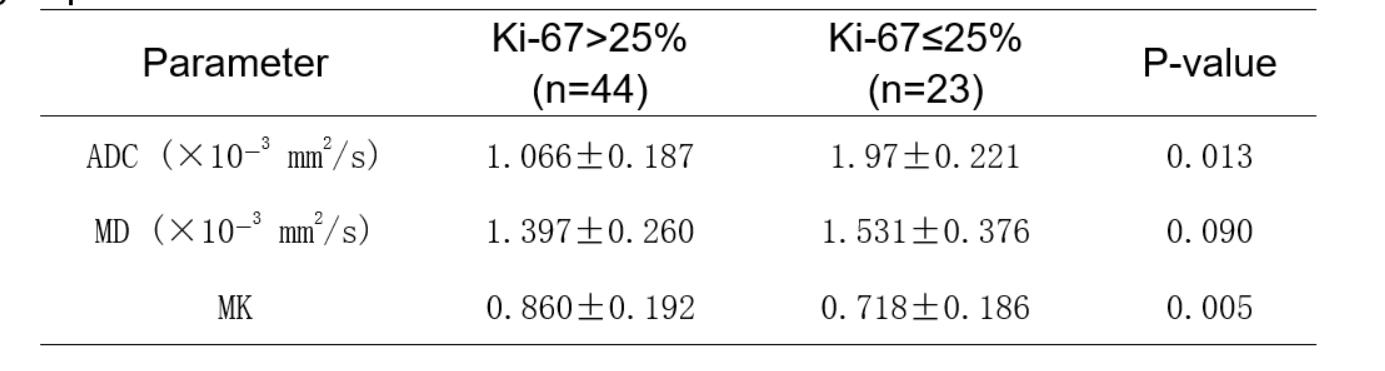
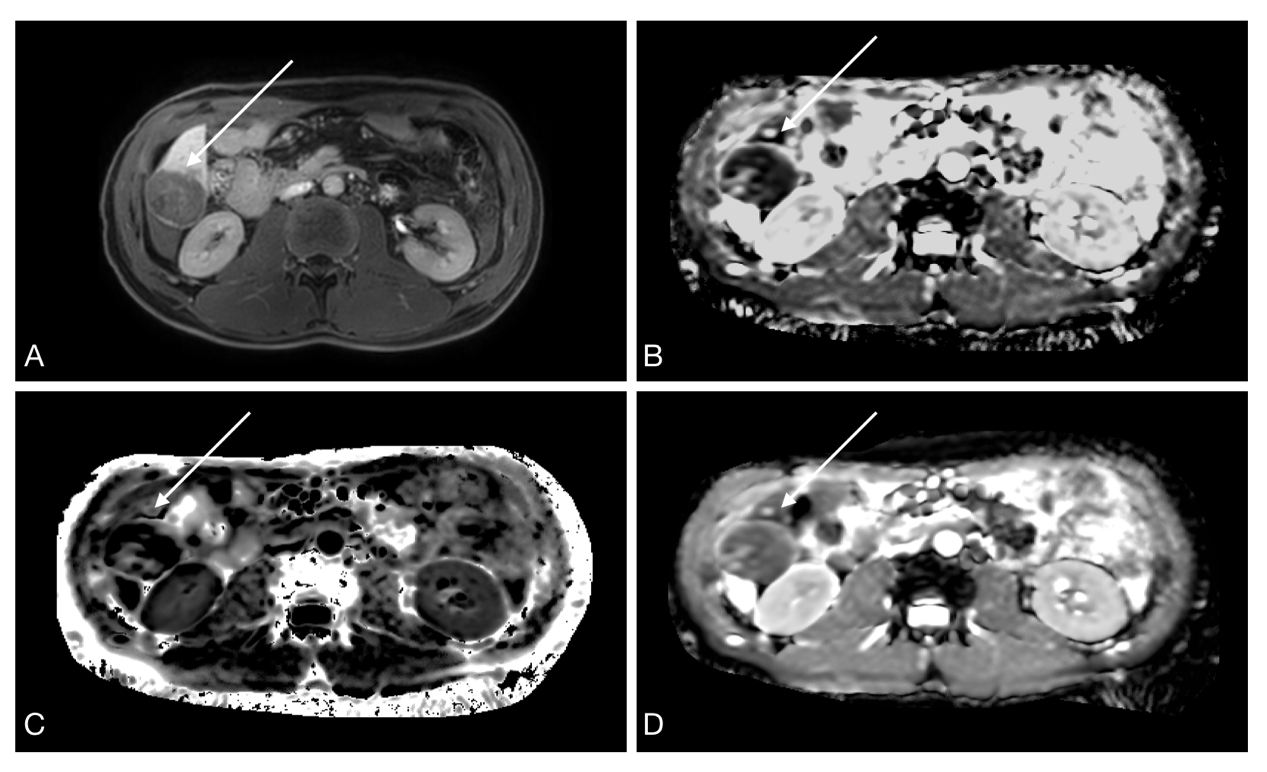
From January 2018 to November 2020, patients with suspected primary liver cancer were consecutively enrolled and underwent preoperative MR imaging with the DKI sequence. Eventually, 67 patients were included. DKI was performed on a 3.0T clinical scanner (Ingenia 3.0T, Philips Healthcare), using a body coil. DKI and apparent diffusion coefficient (ADC) maps were obtained by using the prototype software (DWI Tools; Philips Healthcare). Regions of interest (based on the mean values of K, D, and ADC) were automatically generated by the software and used in the final analysis. Each lesion was measured three times. All histological analyses were performed by a pathologist in the Pathology Department. Ki-67-positive cells were graded as follows: <10%, grade 0; 10–25%, grade 1 (+); >25–50%, grade 2 (++); >50%, grade 3 (+++). Furthermore, ≤25%, >25–49% and >50% were considered low, medium and high expression levels, respectively[11]. Tumors with >25% Ki-67 positive cells were classified into the medium-high expression group, and those with ≤25% were assigned to the low expression group. Independent samples t test was performed to assess differences in ADC, MD, and MK values between the Ki-67>25% and Ki67≤25% groups. Spearman’s correlation analysis was performed to determine the associations of diffusion parameters with Ki-67. Receiver operating characteristic (ROC) curve analysis was performed to evaluate the diagnostic performances of significant parameters in predicting the expression of Ki-67.Results and Discussion
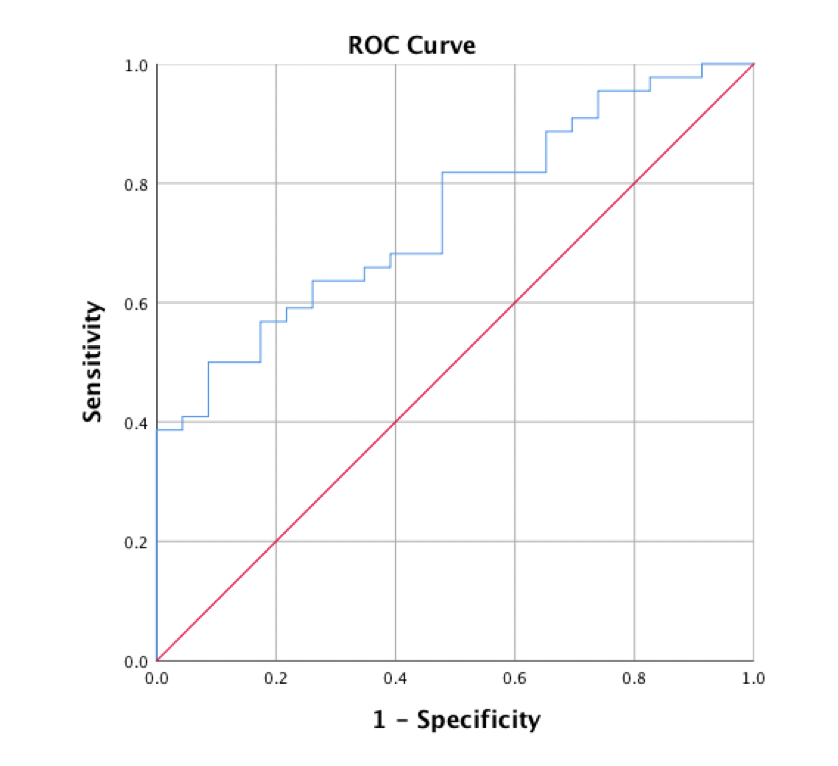
A total of 67 patients (mean age, 55.59±10.74 years; range, 28–80 years), including 57 men (mean age, 54.96±10.39 years, range, 28–80 years) and 10 women (mean age, 50.50±12.77, range, 31–74 years), were included in the final analysis. Histological evaluation indicated 44 lesions with Ki-67>25% and 23 with Ki-67≤25%. Alongside all diffusion parameters, MK and ADC values were significantly correlated with Ki-67 expression. MK and ADC values were significantly higher and lower, respectively, in Ki-67>25% HCCs compared with Ki67≤25% HCCs. No significant difference in MD values was found between the two groups (Table 1). There were close associations of Ki-67 expression with MK (rho =0.325, P=0.007) and ADC (rho =-0.270, P=0.027) values. No multicollinearity was found among the variables in univariate analysis. Increased MK (P=0.009) and decreased ADC (P=0.020) were significantly associated with Ki-67 expression in HCC in univariate analysis. Meanwhile, MD was not significantly correlated with Ki-67. In multivariate analysis, both MK (P=0.015) and ADC (P=0.039) were independent risk factors for Ki-67 expression. The significance level in the Hosmer-Lemeshow test was 0.887, suggesting an acceptable goodness of fit for the model. Multivariate logistic regression analysis was applied for model building. A combined model was built on the basis of both MK and ADC values derived from DKI, and assessed by ROC curve analysis. The area under the receiver operating characteristic curve (AUC) of the model was 0.747 (95%CI: 0.631, 0.863), as shown in Figure 1. The current study evaluated differences in the overall mean values of diffusion parameters between the medium-high and low expression levels of Ki-67 in HCC patients. The results suggest that increased MK and decreased ADC are significantly correlated with Ki-67 expression in HCC. Multivariate logistic regression analysis showed that the combined model built on the basis of both MK and ADC values is a potentially useful adjunct tool for predicting Ki-67 expression in HCC.Conclusion
The results of this study suggest that increased MK and decreased ADC values are potential predictive biomarkers of Ki-67 expression in HCC.Acknowledgements
No acknowledgement found.References
[1] J. Ferlay et al., “GLOBOCAN 2012 v1.0, Cancer Incidence and Mortality Worldwide: IARC CancerBase. No. 11 [Internet].,” Lyon, France: IARC, 2013. .
[2] J. Bruix, G. J. Gores, and V. Mazzaferro, “Hepatocellular carcinoma: Clinical frontiers and perspectives,” Gut. 2014.
[3] L. A. Torre, F. Bray, R. L. Siegel, J. Ferlay, J. Lortet-Tieulent, and A. Jemal, “Global cancer statistics, 2012,” CA. Cancer J. Clin., 2015.
[4] T. Scholzen and J. Gerdes, “The Ki-67 protein: From the known and the unknown,” Journal of Cellular Physiology. 2000.
[5] Z. S. Niu, X. J. Niu, and M. Wang, “Management of hepatocellular carcinoma: Predictive value of immunohistochemical markers for postoperative survival,” World J. Hepatol., 2015.
[6] W. Shi et al., “Expression of MTA2 and Ki-67 in hepatocellular carcinoma and their correlation with prognosis,” Int. J. Clin. Exp. Pathol., 2015.
[7] C. Yang et al., “Marker of proliferation Ki-67 expression is associated with transforming growth factor beta 1 and can predict the prognosis of patients with hepatic B virus-related hepatocellular carcinoma,” Cancer Manag. Res., 2018.
[8] J. H. Lee, Y. C. Yoon, S. W. Seo, Y. La Choi, and H. S. Kim, “Soft tissue sarcoma: DWI and DCE-MRI parameters correlate with Ki-67 labeling index,” Eur. Radiol., 2020.
[9] L. Shen et al., “ADC at 3.0 T as a noninvasive biomarker for preoperative prediction of Ki67 expression in invasive ductal carcinoma of breast,” Clin. Imaging, 2018.
[10] M. Fan et al., “Joint Prediction of Breast Cancer Histological Grade and Ki-67 Expression Level Based on DCE-MRI and DWI Radiomics,” IEEE J. Biomed. Heal. Informatics, 2020.
[11] S. Wang et al., “Relationships of alpha-SMA-positive fibroblasts and SDF-1-positive tumor cells with neoangiogenesis in nasopharyngeal carcinoma,” Biomed Res. Int., 2014.
Figures