2127
Optimization of b-values sampling scheme for several diffusion-weighted MRI models in the liver
Jiqing Huang1, Benjamin Leporq1, BEUF Olivier1, and Hélène Ratiney1
1Univ Lyon, INSA Lyon, CNRS, Inserm, CREATIS UMR 5220, U1206, F-69621, Lyon, Villeurbanne, France
1Univ Lyon, INSA Lyon, CNRS, Inserm, CREATIS UMR 5220, U1206, F-69621, Lyon, Villeurbanne, France
Synopsis
To determine an optimal b-values sampling scheme for different non-Gaussian diffusion models in the liver, including diffusion kurtosis imaging (DKI), stretched-exponential model (SEM), intravoxel incoherent motion (IVIM), we optimized diffusion-weighting b-values sets using simulations mimicking real data and a b-value selection based on a Monte Carlo-like approach. Estimation performances were evaluated in terms of mean square error on signal and mean absolute percentage error on parameters in simulated data. The parameter estimation, with optimized set of b-values was finally applied on real data. The results showed that comparable fitting parameters and reconstructing signal can be obtained with fractional b-values.
INTRODUCTION
Diffusion technique explores the diffusion phenomenon of water molecules, whose movement is limited by tissue structure. It is a promising technique that has been widely used in liver for fibrosis assessment and tumor detection or characterization[1]. As the MRI signal reflects water molecules interactions with many different obstacles, like cell membranes and compartments, a variety of diffusion’s subtypes models are assumed and proposed, such as SEM, IVIM, DKI[2]. Compared with conventional diffusion-weighted imaging, these models require a wider range of acquired b-values which lead to longer acquisition time and decreased SNR for high b-values. Thus, our goal is to develop a framework to optimize b-value sampling scheme for different diffusion models and study the performance of associated different fitting methods.METHODS
A simulation framework was designed for liver DWI with classical b-values sampling scheme (0,10,20,40,60,80,100,200,300,400,600,800 s.mm-2) considered as the “full” set of b-value. The diffusion parameters at a voxel can be represented as $$$S_{i}=S_{0} \mathrm{~L}(p)$$$ where $$$S_{i}$$$ and $$$S_{0}$$$ are respectively the acquired signal with b-value index $$$i$$$ and 0, and $$$p$$$ and $$$L(\cdot)$$$ are the models’ parameters and model function, respectively. To find an optimal subset of b-values for each model function, we randomly simulated the models’ parameters for ground truth. Such parameters were drawn according a gaussian distribution and in the range of values reported in the literature[3-5]. The hyperparameters used in the simulation are listed in Table I. Then, the corresponding signal with Rician noise was generated according to their respective diffusion attenuation model functions (L). The optimal b-values set are iteratively selected, with the following steps: 1) To estimate model parameter with a non-linear square method (LSQ) for a random b-values subset 2) To compare the differences between ground truth and estimated parameters, 3) To update the b-value set when the difference is smaller than the previous state. The L2 norm $$$C(p, \hat{p})$$$ was used to assess the difference between the fitted parameters $$$p$$$ and ground truth $$$\hat{p}$$$. To avoid exhaustive searching in the feasible region, a Monte Carlo-liked method is introduced to randomly generate the subset. The selection process includes two key steps: $$$\mathrm{b}+$$$ step and $$$\mathrm{b}-$$$ step. $$$\mathrm{b}+$$$ step is to add a b-value that has not been selected to the target b subset, $$$\mathrm{b}-$$$ step is to remove a b-value from the present b subset. After $$$\mathrm{b}+$$$ or $$$\mathrm{b}-$$$ steps, the cost function $$$C(p, \hat{p})$$$ declines. Each iteration contains at least one $$$\mathrm{b}+$$$ step. If $$$\mathrm{b}+$$$ step or $$$\mathrm{b}-$$$ step is successful, an additional $$$\mathrm{b}-$$$ step is be performed. The termination condition of the algorithm is that all b-values have been considered. After the selection of b-values, diffusion parameters were estimated using LSQ or Bayesian fitting methods with (LSQ selected, Bayesian Selected) and without (LSQ Full Bayesian Full) the optimal b-values subset We analyzed the performance of the proposed method, on the simulated data mimicking real liver: mean value and mean absolute percentage error (MAPE) were computed for parameters’ accuracy assessment, MSE were computed to evaluate the quality of estimated signal compared to ground truth. Finally, the estimation methods and b-value selections were applied on real data of a patient with moderate fibrosis.RESULTS
In Table II, the optimal b-values subset for each diffusion model selected by the Monte Carlo method is given. Fig.1-2 showed the mean and standard error of mean of MSE and MAPE computed on the simulated liver data. Fig.3 showed the mean-value and standard variation of each parameter for the four fitting methods as well as parameter maps illustrating the type of map obtained.DISCUSSION
To our knowledge, no study has explored the accuracy and robustness of fitting results for various diffusion models according to noise level, fitting method, and b-values sampling for liver examination. In Table II, we found that DKI seems to be the model requiring the most b-values. Indeed Kapp acts at high b-values while Dapp is related to the small b-values. Therefore, it may be necessary to use segmented fitting method to increase accuracy. In Fig.1 and Fig.2, it can be observed that despite the LSQ method with recommended b-values subset achieved comparable or better results on parameter fit and signal reconstruction compared to using full b values set, the result of Bayesian method is not as good as LSQ method. This is because that the LSQ algorithm was used to iteratively find the optimal Monte Carlo b-values set. Fig. 3 shows very little discrepancies, on real data, for the diffusion parameter estimates with selected and full b-values (less than 1% of difference for the LSQ for more than 98% of the voxels for Gaussian parameters, and for about 92% of the voxels for the non-Gaussian parameters) confirming the results obtained with the simulation.CONCLUSION
We have compared accuracy performances among LSQ methods and Bayesian methods for estimating multiple diffusion model parameters based on simulation adapted to liver. We can conclude that, for these models, b-value selection acts on estimated parameters accuracy and that it is better to have few optimized b-values, rather than several homogeneously distributed over a data range. The optimal b-values for Bayesian method needs to be further confirmed by Monte Carlo method with Bayesian estimation.Acknowledgements
This work was supported by the LABEX LABEX PRIMES (ANR-11-LABX-0063) of Université de Lyon, within the program "Investissements d'Avenir" (ANR-11-IDEX-0007) operated by the French National Research Agency (ANR).References
[1] Saito, K., Tajima, Y., & Harada, T. L. (2016). Diffusion-weighted imaging of the liver: current applications. World journal of radiology, 8(11), 857. [2] Sandrasegaran, K., Akisik, F. M., Lin, C., Tahir, B., Rajan, J., Saxena, R., & Aisen, A. M. (2009). Value of diffusion-weighted MRI for assessing liver fibrosis and cirrhosis. American Journal of Roentgenology, 193(6), 1556-1560. [3] Hu, G., Liang, W., Wu, M., Chan, Q., Li, Y., Xu, J., ... & Quan, X. (2018). Staging of rat liver fibrosis using monoexponential, stretched exponential and diffusion kurtosis models with diffusion weighted imaging-magnetic resonance. Oncotarget, 9(2), 2357. [4] Ichikawa, S., Motosugi, U., Morisaka, H., Sano, K., Ichikawa, T., Enomoto, N., ... & Onishi, H. (2015). MRI‐based staging of hepatic fibrosis: Comparison of intravoxel incoherent motion diffusion‐weighted imaging with magnetic resonance elastography. Journal of Magnetic Resonance Imaging, 42(1), 204-210. [5] Yablonskiy, D. A., Bretthorst, G. L., & Ackerman, J. J. (2003). Statistical model for diffusion attenuated MR signal. Magnetic Resonance in Medicine: An Official Journal of the International Society for Magnetic Resonance in Medicine, 50(4), 664-669.Figures
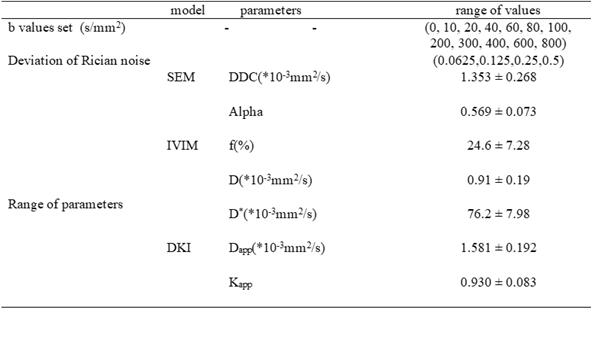
Table I : major parameters settings
in the simulation
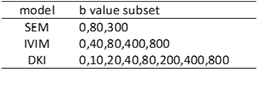
Table II : Most frequent sequence of b value subset estimated
by Monte Carlo method for each model
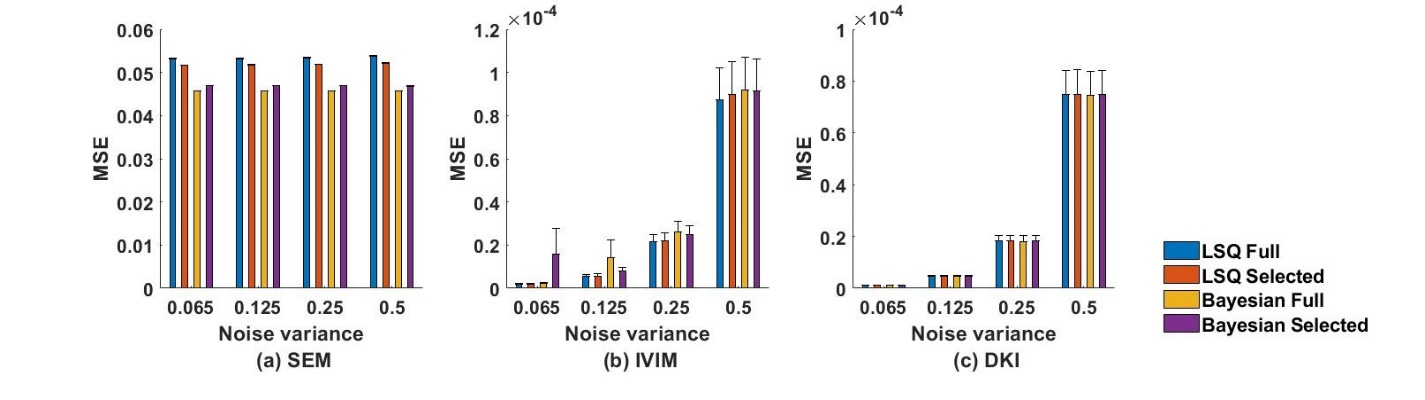
Fig. 1. MSE on the signal estimation computed over simulated liver
data for the different fitting method set of b values (‘Full’ and ‘Selected’ by
the Monte Carlo method), and diffusion models. Error bars correspond to
standard error of the MSE over the simulated liver.
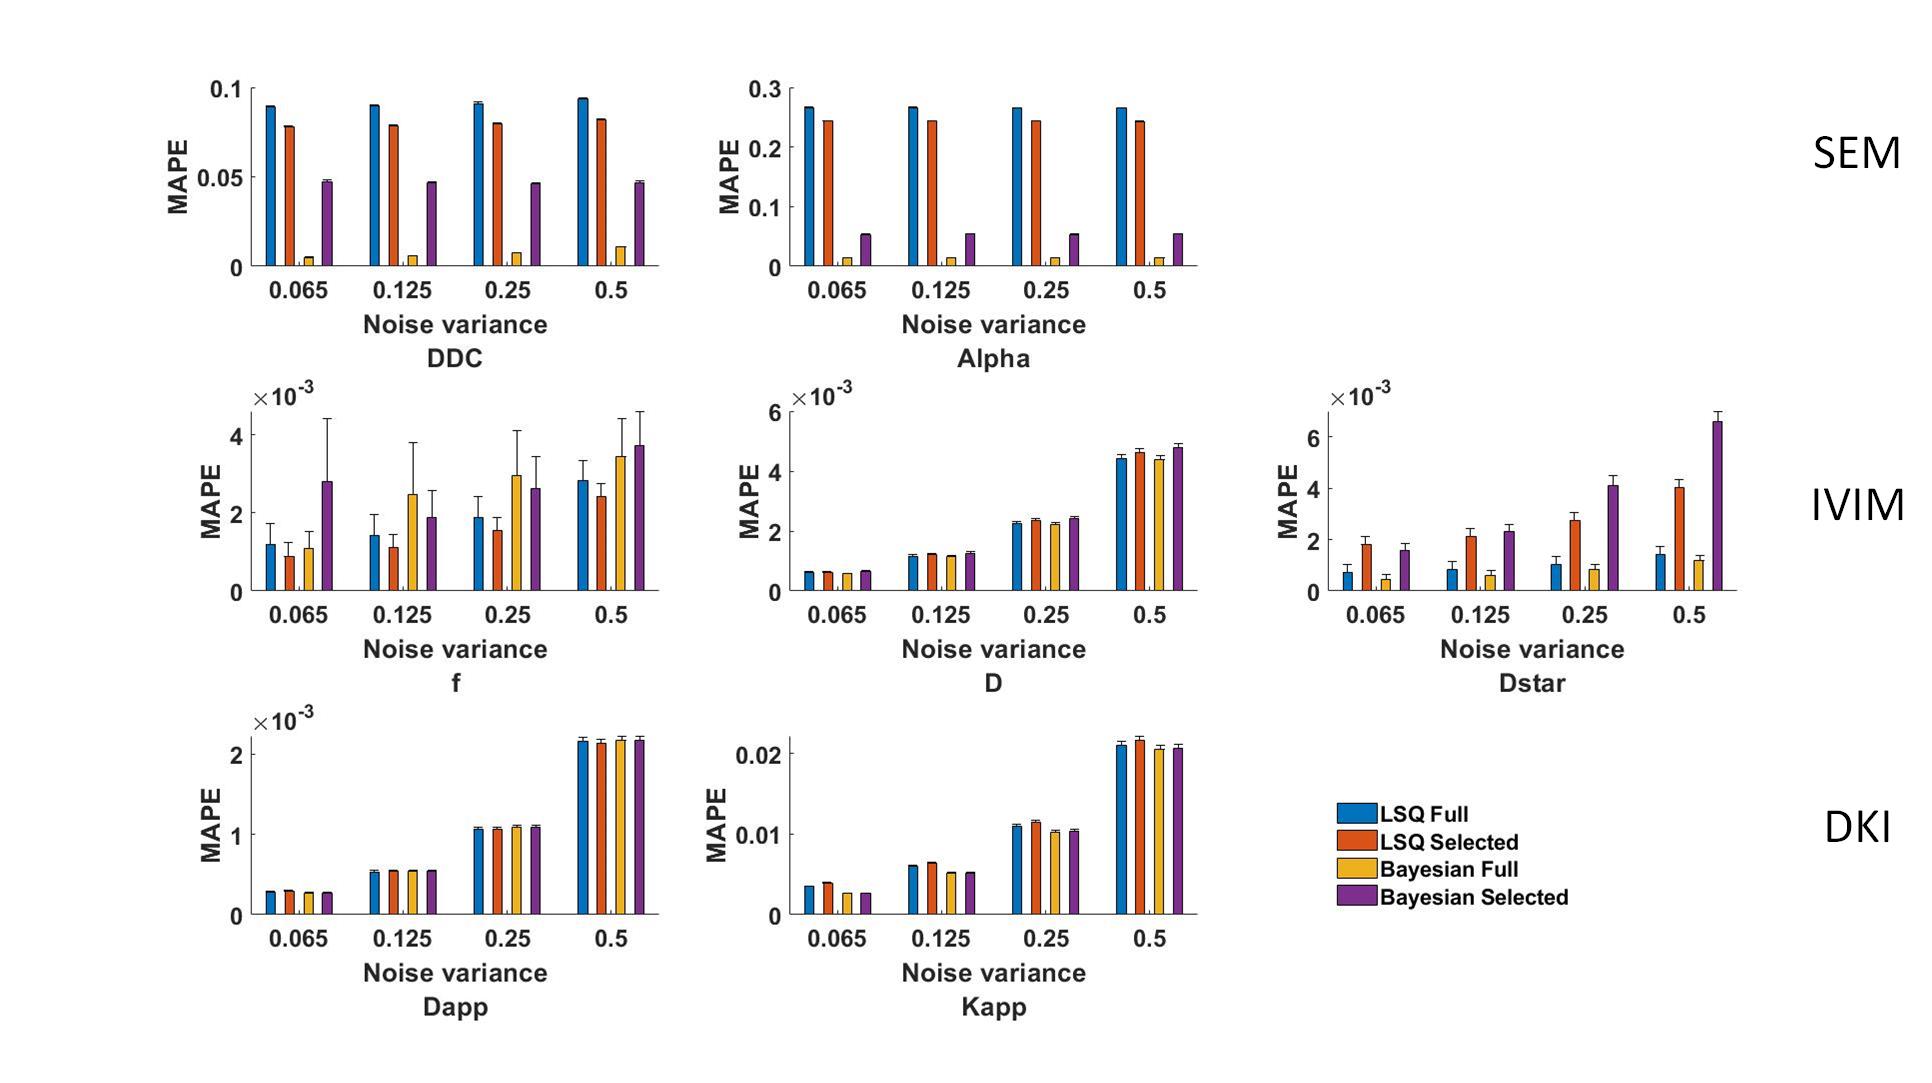
Fig.2. MAPE on the parameter estimation computed over simulated
liver data for the different fitting method and set of b values (‘Full’ and
‘Selected’ by the Monte Carlo method), and diffusion models. Error bars
correspond to standard error of the MAPE over the simulated liver.
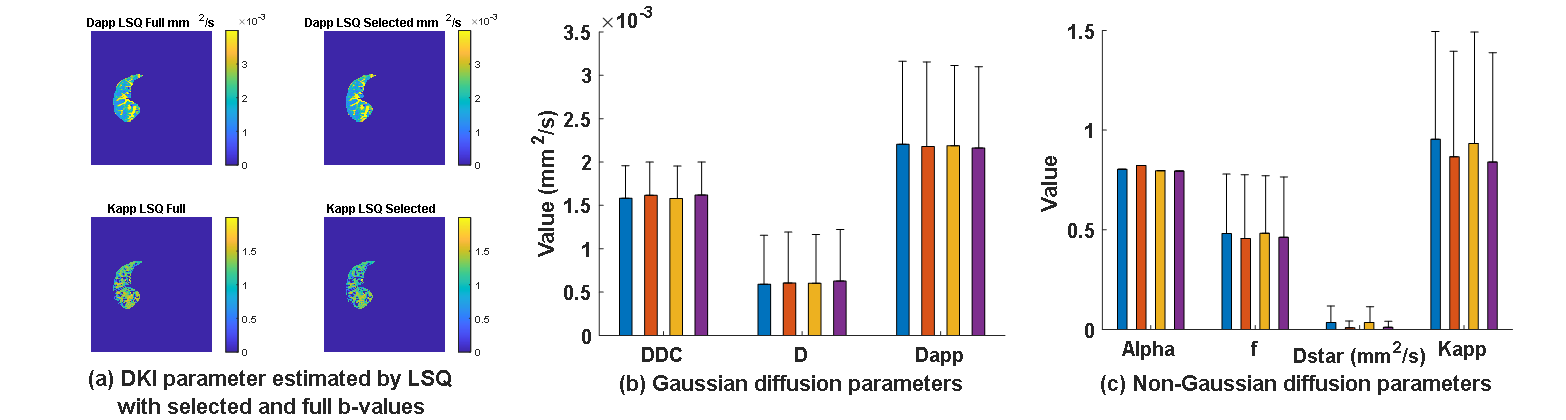
Fig.3. Average and standard
deviation of the diffusion parameters fitted by different methods and with set
of b values on real data acquired on a patient.