2124
Staging chronic hepatitis B related liver fibrosis with a fractional order calculus diffusion model1Zhongshan Hospital affiliated to Fudan University, Shanghai, China, 2Central Research Institute, United Imaging Healthcare, Shanghai, China
Synopsis
Recently, a novel non-Gaussian DWI model, known as the fractional order calculus (FROC) model, was developed for biomedical applications. Until now, hardly has the FROC-DWI been applied in the hepatic imaging Thus, this study aimed to evaluate the value of FROC diffusion model in staging liver fibrosis. According to our results, the FROC-DWI-derived parameters (D, β, and μ) were significantly correlated with fibrosis stages, contributing positively to non-invasive assessment of liver fibrosis. The combination of FROC-DWI and conventional mono-exponential DWI held great potential in noninvasively staging liver fibrosis, superior to serum fibrosis biomarkers including APRI and FIB-4.
Introduction
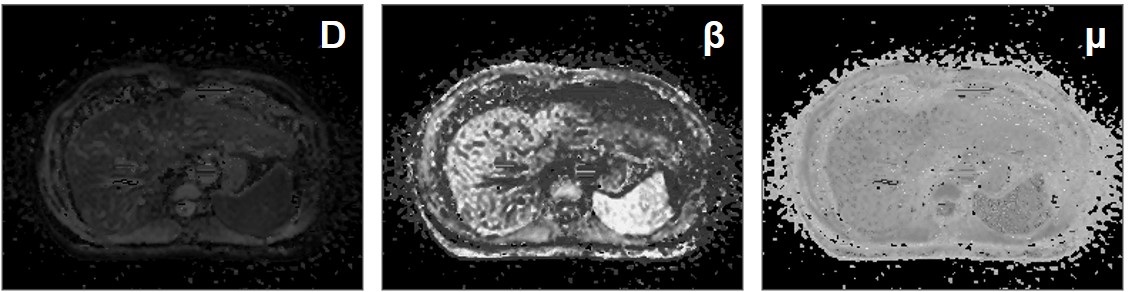
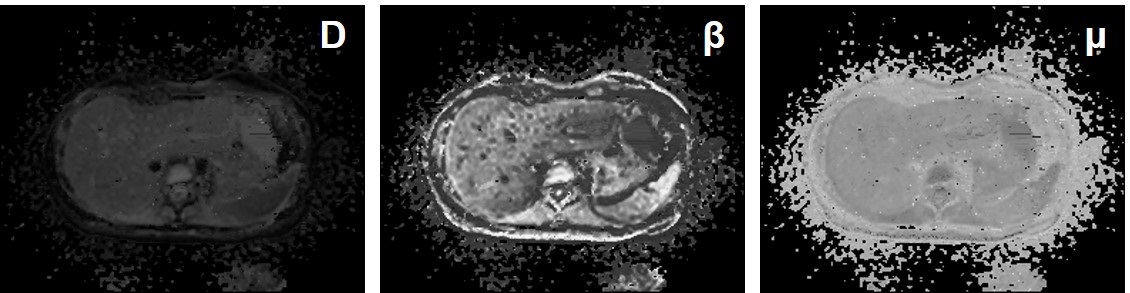
Liver fibrosis plays a key role in the natural history of chronic liver diseases, untreated fibrosis is likely to progress into cirrhosis with clinical consequences of portal hypertension, liver failure and hepatocellular carcinoma.1,2 Accurately staging the liver fibrosis especially in the early stage is of great clinical significance for both decision-making on anti-fibrosis treatment and the prognostic prediction. Recently, a novel non-Gaussian DWI model, known as the fractional order calculus (FROC) model, was established.3 FROC-DWI showed great clinical potential in tumor grading, therapeutic efficiency evaluation with a set of parameters including diffusion coefficient (D), fractional order derivative in space (β), and a spatial parameter (μ), with capabilities of providing an accurate characterization of tissue cellularity as well as micro-structural heterogeneity. To the best of our knowledge, hardly has the FROC-DWI been applied in hepatic imaging. Therefore, this study aimed to investigate the value of FROC-DWI in staging liver fibrosis in chronic hepatitis B (CHB) patients, and to compare its performance with conventional DWI and fibrosis biomarkers including aspartate aminotransferase-to-platelet ratio index (APRI) and fibrosis-4 (FIB-4).Methods
This prospective study included 82 patients with CHB and all patients underwent the DWI-MRI examination with a 3.0T scanner (uMR 770; United Imaging Healthcare, Shanghai, China). DWI-derived parameters including diffusion coefficient (D), fractional order parameter (β) and the microstructural quantity (μ) of FROC-DWI, as well as apparent diffusion coefficient (ADC) of mono-exponential DWI were calculated with previously-reported fitting method.3 Spearman correlation analyses and stepwise multiple regression analyses were utilized to quantify the correlations among DWI-derived parameters, serum fibrosis biomarkers including APRI and FIB-4, and the fibrosis stages or inflammatory activity. Diagnostic efficacy of different DWI-derived parameters, APRI and FIB-4 for staging liver fibrosis was assessed and compared by receiver operating characteristic (ROC) analyses.Results
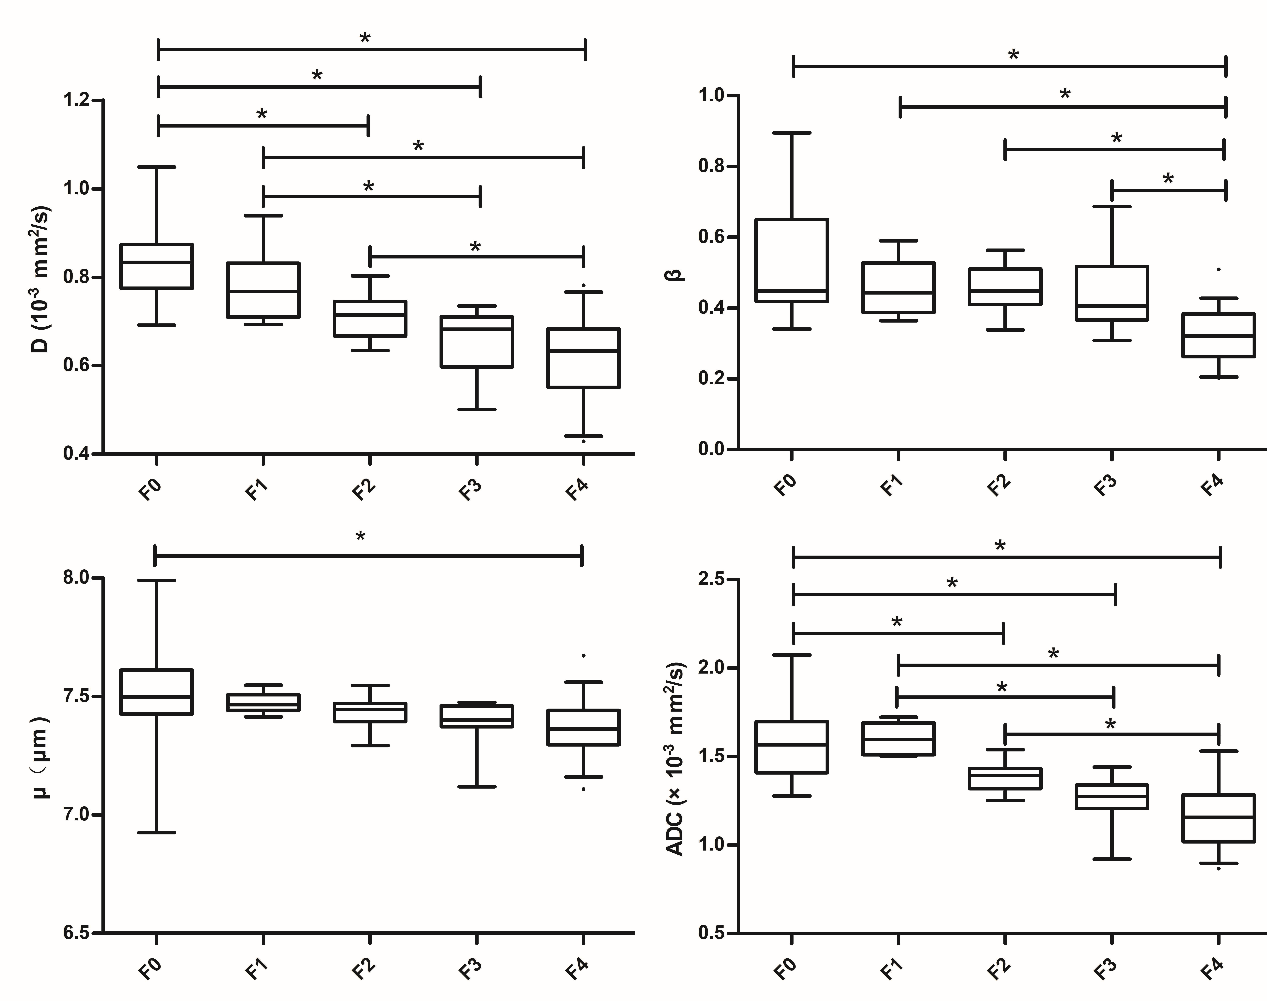
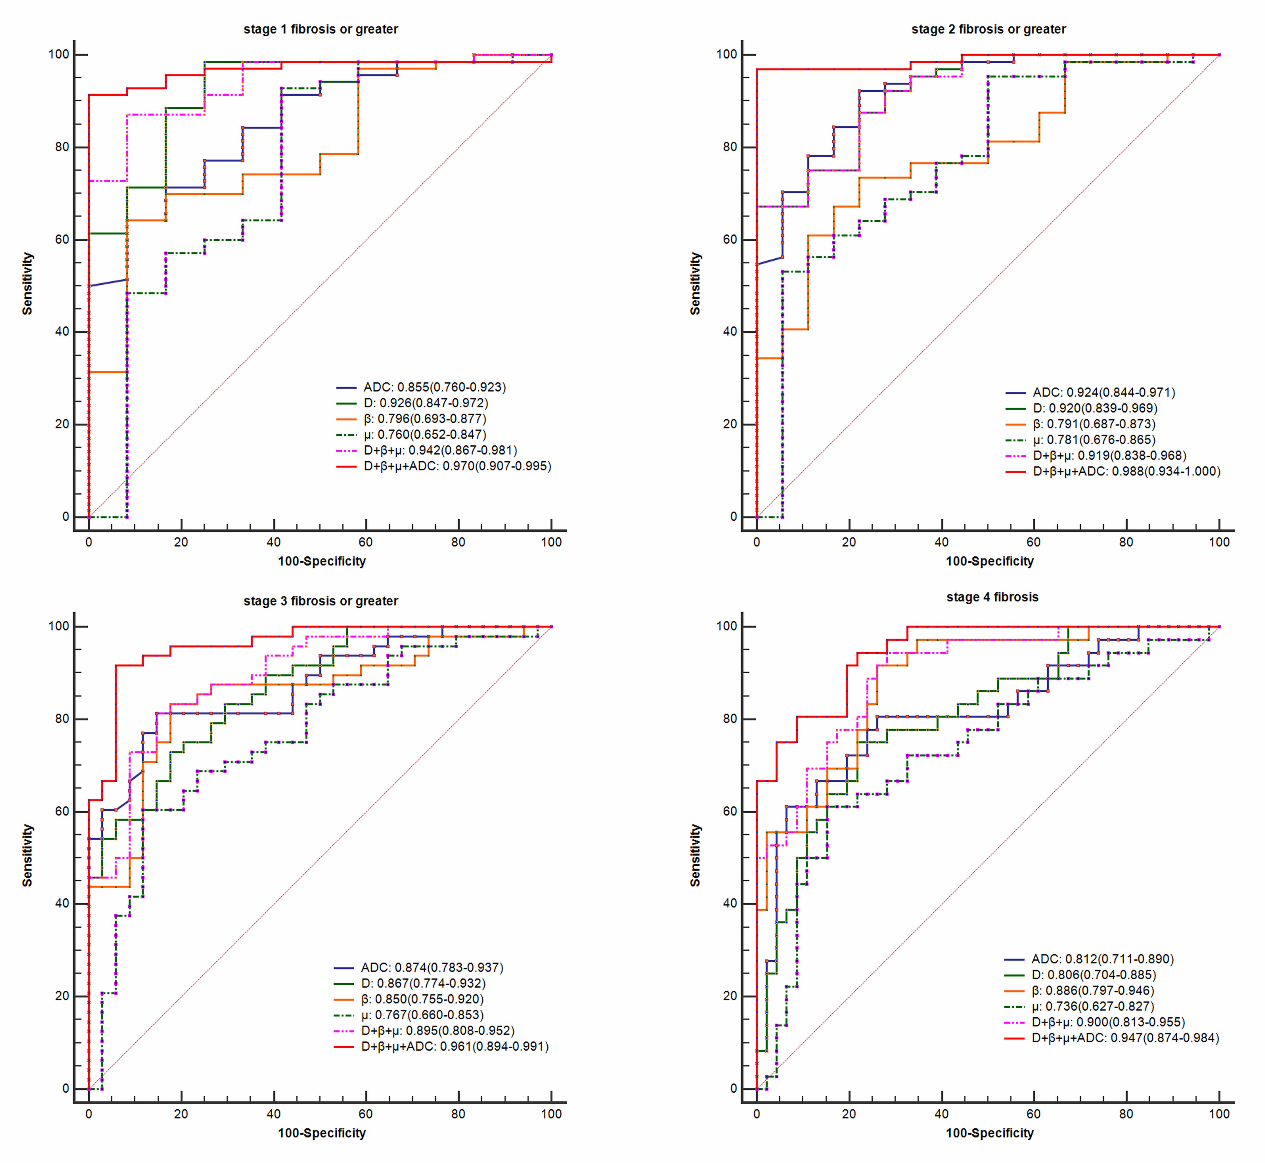
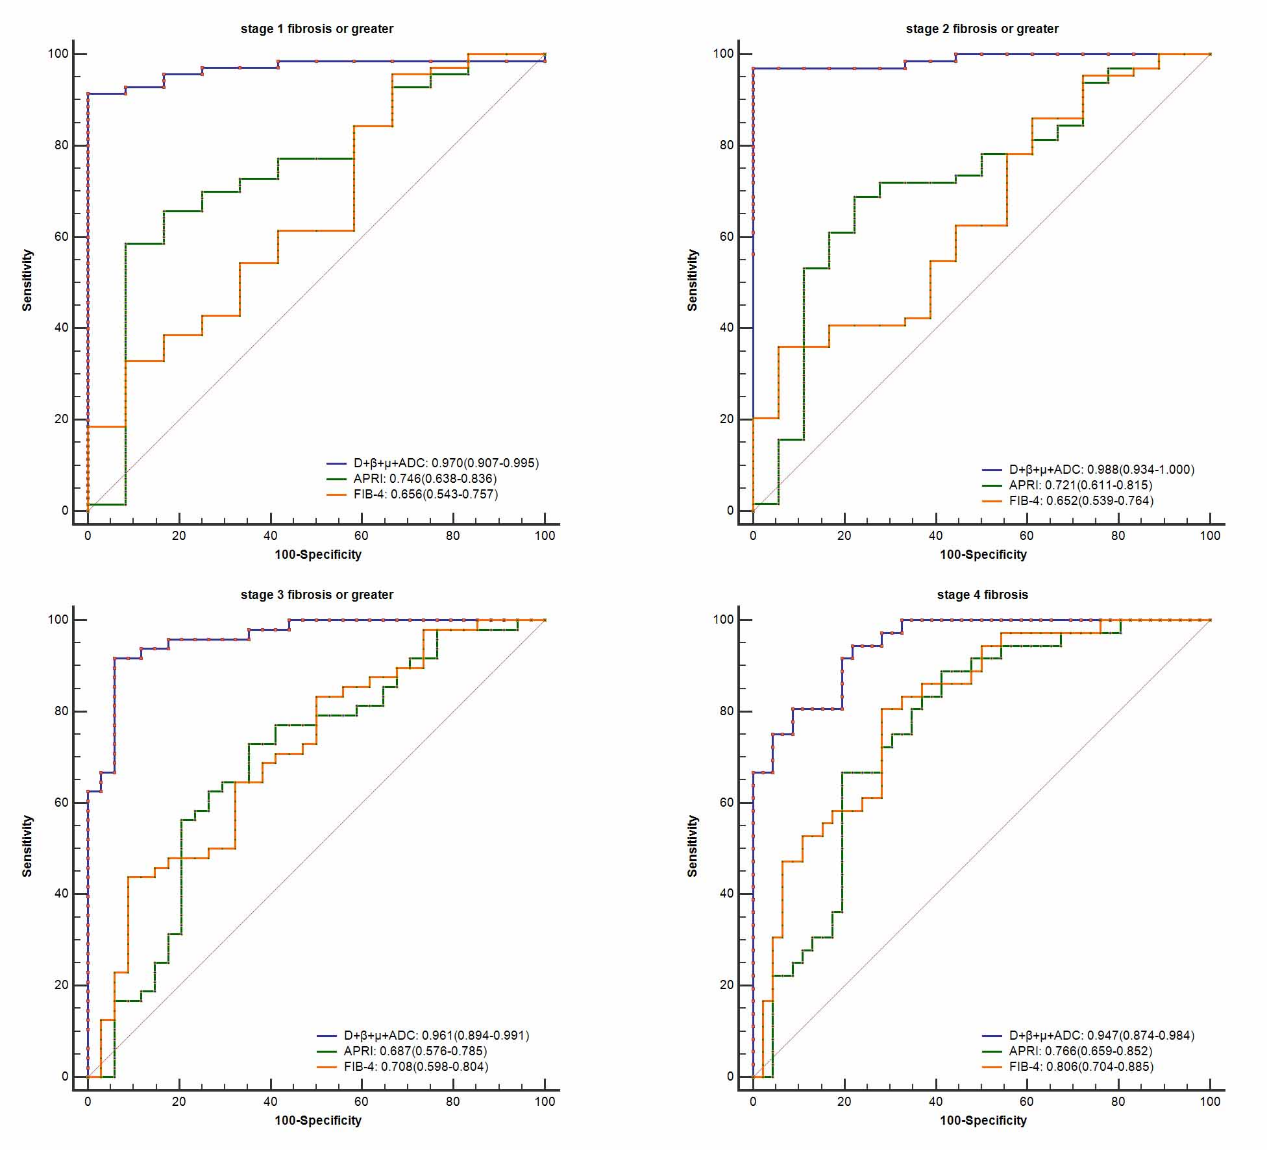
Histopathologically, 12, 6, 16, 12 and 36 patients were staged as F0, F1, F2, F3 and F4. There were significant differences among liver fibrosis stages for DWI-derived parameters including D (F = 18.22, P < 0.001), β (F = 13.14, P < 0.001), μ (P < 0.001) and ADC (F = 18.23, P < 0.001), although some overlaps existed in pairwise subgroup comparisons (Fig.3). D (r = -0.667), β (r = -0.671), μ (r = -0.481) and ADC (r = -0.665) values displayed significant inverse correlations with fibrosis stages (P < 0.001). Multiple regression analyses suggested that D (β = -0.347, P < 0.001), β (β = -0.261, P = 0.001) and ADC (β = -0.492, P < 0.001) were independently associated with fibrosis (R2 = 0.735). Compared to inflammatory activity, fibrosis was the independent factor significantly correlated with D (β = -0.688, P < 0.001, R2 = 0.474), β (β = -0.605, P < 0.001, R2 = 0.366) and ADC (β = -0.685, P < 0.001, R2 = 0.470). There were no significant differences between the AUCs of D, β, μ or their combinations and ADC for predicting the fibrosis stages (P > 0.05). The AUC values of the combination of all four metrics (D, β, μ, ADC) were 0.970 (95% CI: 0.907-0.995) for the prediction of fibrosis stage 1 or greater, 0.988 (95% CI: 0.934-1.000) for stage 2 or greater, 0.961 (95% CI: 0.894-0.991) for stage 3 or greater, and 0.947 (95% CI: 0.874-0.984) for stage 4. The diagnostic performance of the combined indexes with four diffusion metrics (D, β, μ and ADC) was better than D, β, μ or ADC used alone (P < 0.05, Fig.4) as well as APRI or FIB-4 (P < 0.01, Fig.5) in fibrosis staging.Discussion
Our study concluded that the FROC-DWI-derived parameters (D, β, and μ) were significantly correlated with fibrosis stage, contributing positively to non-invasive assessment of liver fibrosis. More importantly, the combination of FROC-derived parameters and ADC value resulted in a better diagnostic performance than APRI and FIB-4. Diffusion coefficient usually correlated with extracellular diffusion space. The β value was indicated as inversely correlated with micro-structural complexity, which could naturally distinguish simple diffusion from anomalous diffusion; smaller β value implied more significant intravoxel heterogeneity.4,5 The lower D and β values observed in patients with higher fibrosis stages can be explained by the restricted diffusion and increased microstructural complexity with the presence of increased extracellular collagen deposition, narrowed sinusoids, and decreased blood flow in higher stages of liver fibrosis.6 Meanwhile, according to our results, fibrosis was the independent factor significantly correlated with D and β, in comparison to necroinflammatory activity. Thus, FROC-derived D and β may serve as reliable indicators in staging liver fibrosis for CHB patients. Another promising finding of this research was that the combination of FROC-derived parameters and ADC values resulted in the best diagnostic performance for fibrosis staging, superior to serum indices of APRI and FIB-4.Conclusion
FROC-DWI is valuable for liver fibrosis staging, and the combination of DWI-derived indexes including D, β, μ and ADC may serve as a promising and reliable tool for the noninvasive staging and surveillance of liver fibrosis in patients with CHB, superior to APRI and FIB-4.Acknowledgements
NoneReferences
1. Lok AS, McMahon BJ, Brown RS, et al. Antiviral therapy for chronic hepatitis B viral infection in adults: a systematic review and meta‐analysis. Hepatology (Baltimore, Md) 2016;63(1):284-306.
2. Parola M, Pinzani M. Liver fibrosis: Pathophysiology, pathogenetic targets and clinical issues. Molecular aspects of medicine 2019;65:37-55.
3. Sui Y, Wang H, Liu G, et al. Differentiation of low-and high-grade pediatric brain tumors with high b-value diffusion-weighted MR imaging and a fractional order calculus model. Radiology 2015;277(2):489-496.
4. Sui Y, Xiong Y, Jiang J, et al. Differentiation of low-and high-grade gliomas using high b-value diffusion imaging with a non-Gaussian diffusion model. Am J Neuroradiol 2016;37(9):1643-1649.
5. Chen W, Zhu L-N, Dai Y-M, et al. Differentiation of salivary gland tumor using diffusion-weighted imaging with a fractional order calculus model. The British journal of radiology 2020;93(1113):20200052.
6. Taouli B, Chouli M, Martin AJ, Qayyum A, Coakley FV, Vilgrain V. Chronic hepatitis: role of diffusion‐weighted imaging and diffusion tensor imaging for the diagnosis of liver fibrosis and inflammation. Journal of Magnetic Resonance Imaging: An Official Journal of the International Society for Magnetic Resonance in Medicine 2008;28(1):89-95.
Figures