2122
Echo time dependence of the biexponential and triexponential IVIM parameters in the liver1University Hospital Erlangen, Erlangen, Germany, 2Lund University, Lund, Sweden, 3Friedrich-Alexander-Universität Erlangen-Nürnberg, Erlangen, Germany
Synopsis
In this study, we acquired diffusion-weighted image data of 15 healthy volunteers at four different TE. A ROI-based IVIM analysis showed that the pseudodiffusion coefficients did not change with TE, whereas the perfusion fractions rose significantly for bi- and triexponential IVIM curves at longer TE. A quantitative analysis indicates that the triexponential perfusion fractions are unlikely attributable to venous and arterial blood compartments. Our results indicate moreover that the pseudodiffusion coefficients can be compared without TE-correction among studies performed with different TE.
Introduction
The intravoxel incoherent motion (IVIM) effect allows one to distinguish between diffusion and perfusion by considering the diffusion-weighted signal at various b-values. Recent studies showed that a triexponential signal curve describes the data better in several organs than the classically used biexponential signal curve1-4. In our study, the TE dependence of the IVIM parameters in the liver was measured with a twofold purpose. First, to investigate whether the well-documented TE-dependence of the biexponential perfusion fraction f also occurs for the biexponential pseudodiffusion coefficient and for the triexponential IVIM parameters; and would thus require a correction strategy similar to the f-correction approach by Jerome et al.5 Second, to elucidate whether the triexponential perfusion fractions f1 and f2 might be linked to arterial and venous compartments. This might be the case because arterial and venous blood exhibit different T2 times.Methods
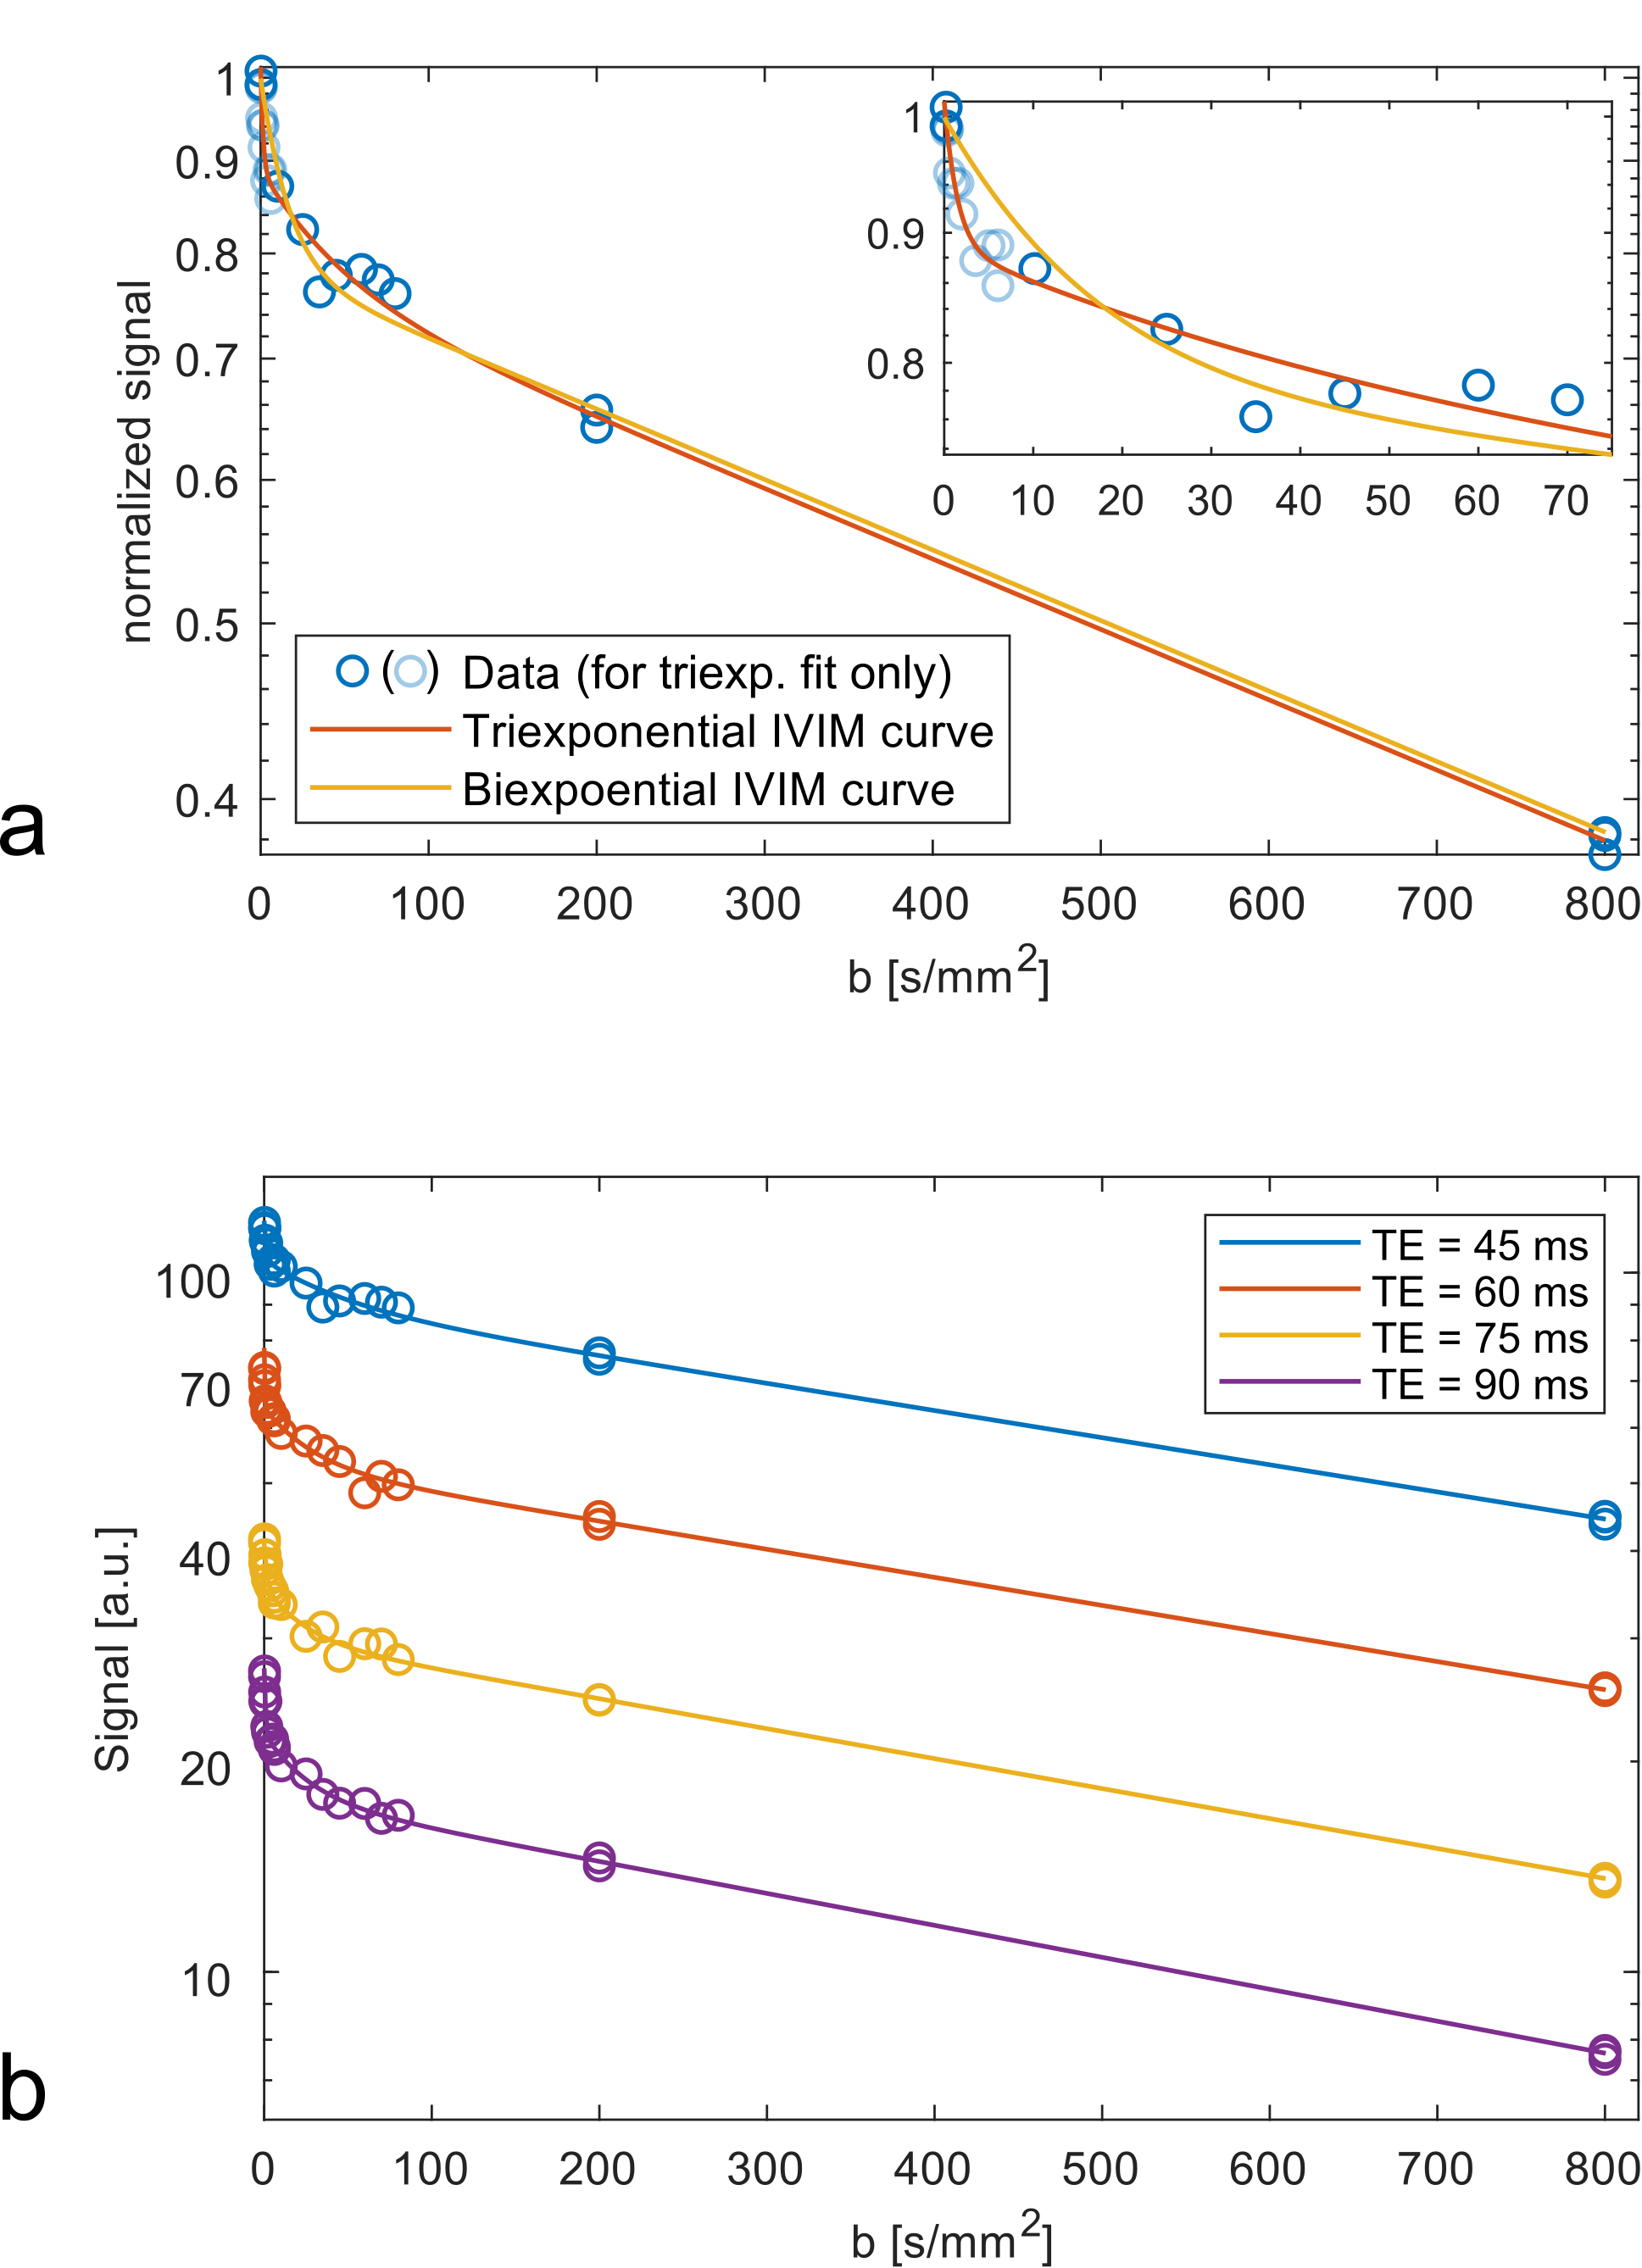
At 3 T, diffusion-weighted images of the liver of 15 healthy volunteers were acquired at TE = 45 ms, 60 ms, 75 ms, 90 ms.6 For 24 b-values, which were spaced between 0.2 s/mm2 and 800 s/mm2, data for six diffusion directions and of six transversal slices were acquired. The diffusion time and the diffusion gradient length were kept constant at 21640 µs and 12240 µs, respectively, for all diffusion weightings and echo times. The b-values used in the evaluation were calculated numerically in order to take additional diffusion weightings generated e.g. by imaging gradients into account.The evaluation of the images was done with MATLAB R2017b. For each slice, a single region of interest (ROI) under exclusion of large vessels was drawn and evaluated using the median of all included voxel signals. The signals were normalized to the signal at the lowest b-value of the respective echo time. The triexponential IVIM curve was fitted to all data points; data from each direction and slice was treated as equally-weighted data points. The biexponential IVIM curve was fitted to all b-values except for those in the interval [0.3 s/mm2, 6 s/mm2] to ensure consistency with previous biexponential IVIM studies. The fits were performed in a two-step multistart approach. The formula for the biexponential IVIM signal curve reads:
$$S(b) = S_0 ((1-f) \exp(-bD) + f \exp(-bD^*))$$ where f denotes the biexponential perfusion fraction, D the diffusion coefficient and D* the pseudodiffusion coefficient. The formula for the triexponential IVIM signal curve reads:
$$S(b) = S_0 ((1-f_1-f_2) \exp(-bD) + f_1 \exp(-bD_1^*) + f_2 \exp(-bD_2^*))$$ where f1 and f2 denote the triexponential perfusion fractions and D1* and D2* denote the triexponential pseudodiffusion coefficients. Statistical analysis was performed with the Kruskal-Wallis test and the Dunn-Sidak test as post-hoc test.
Results
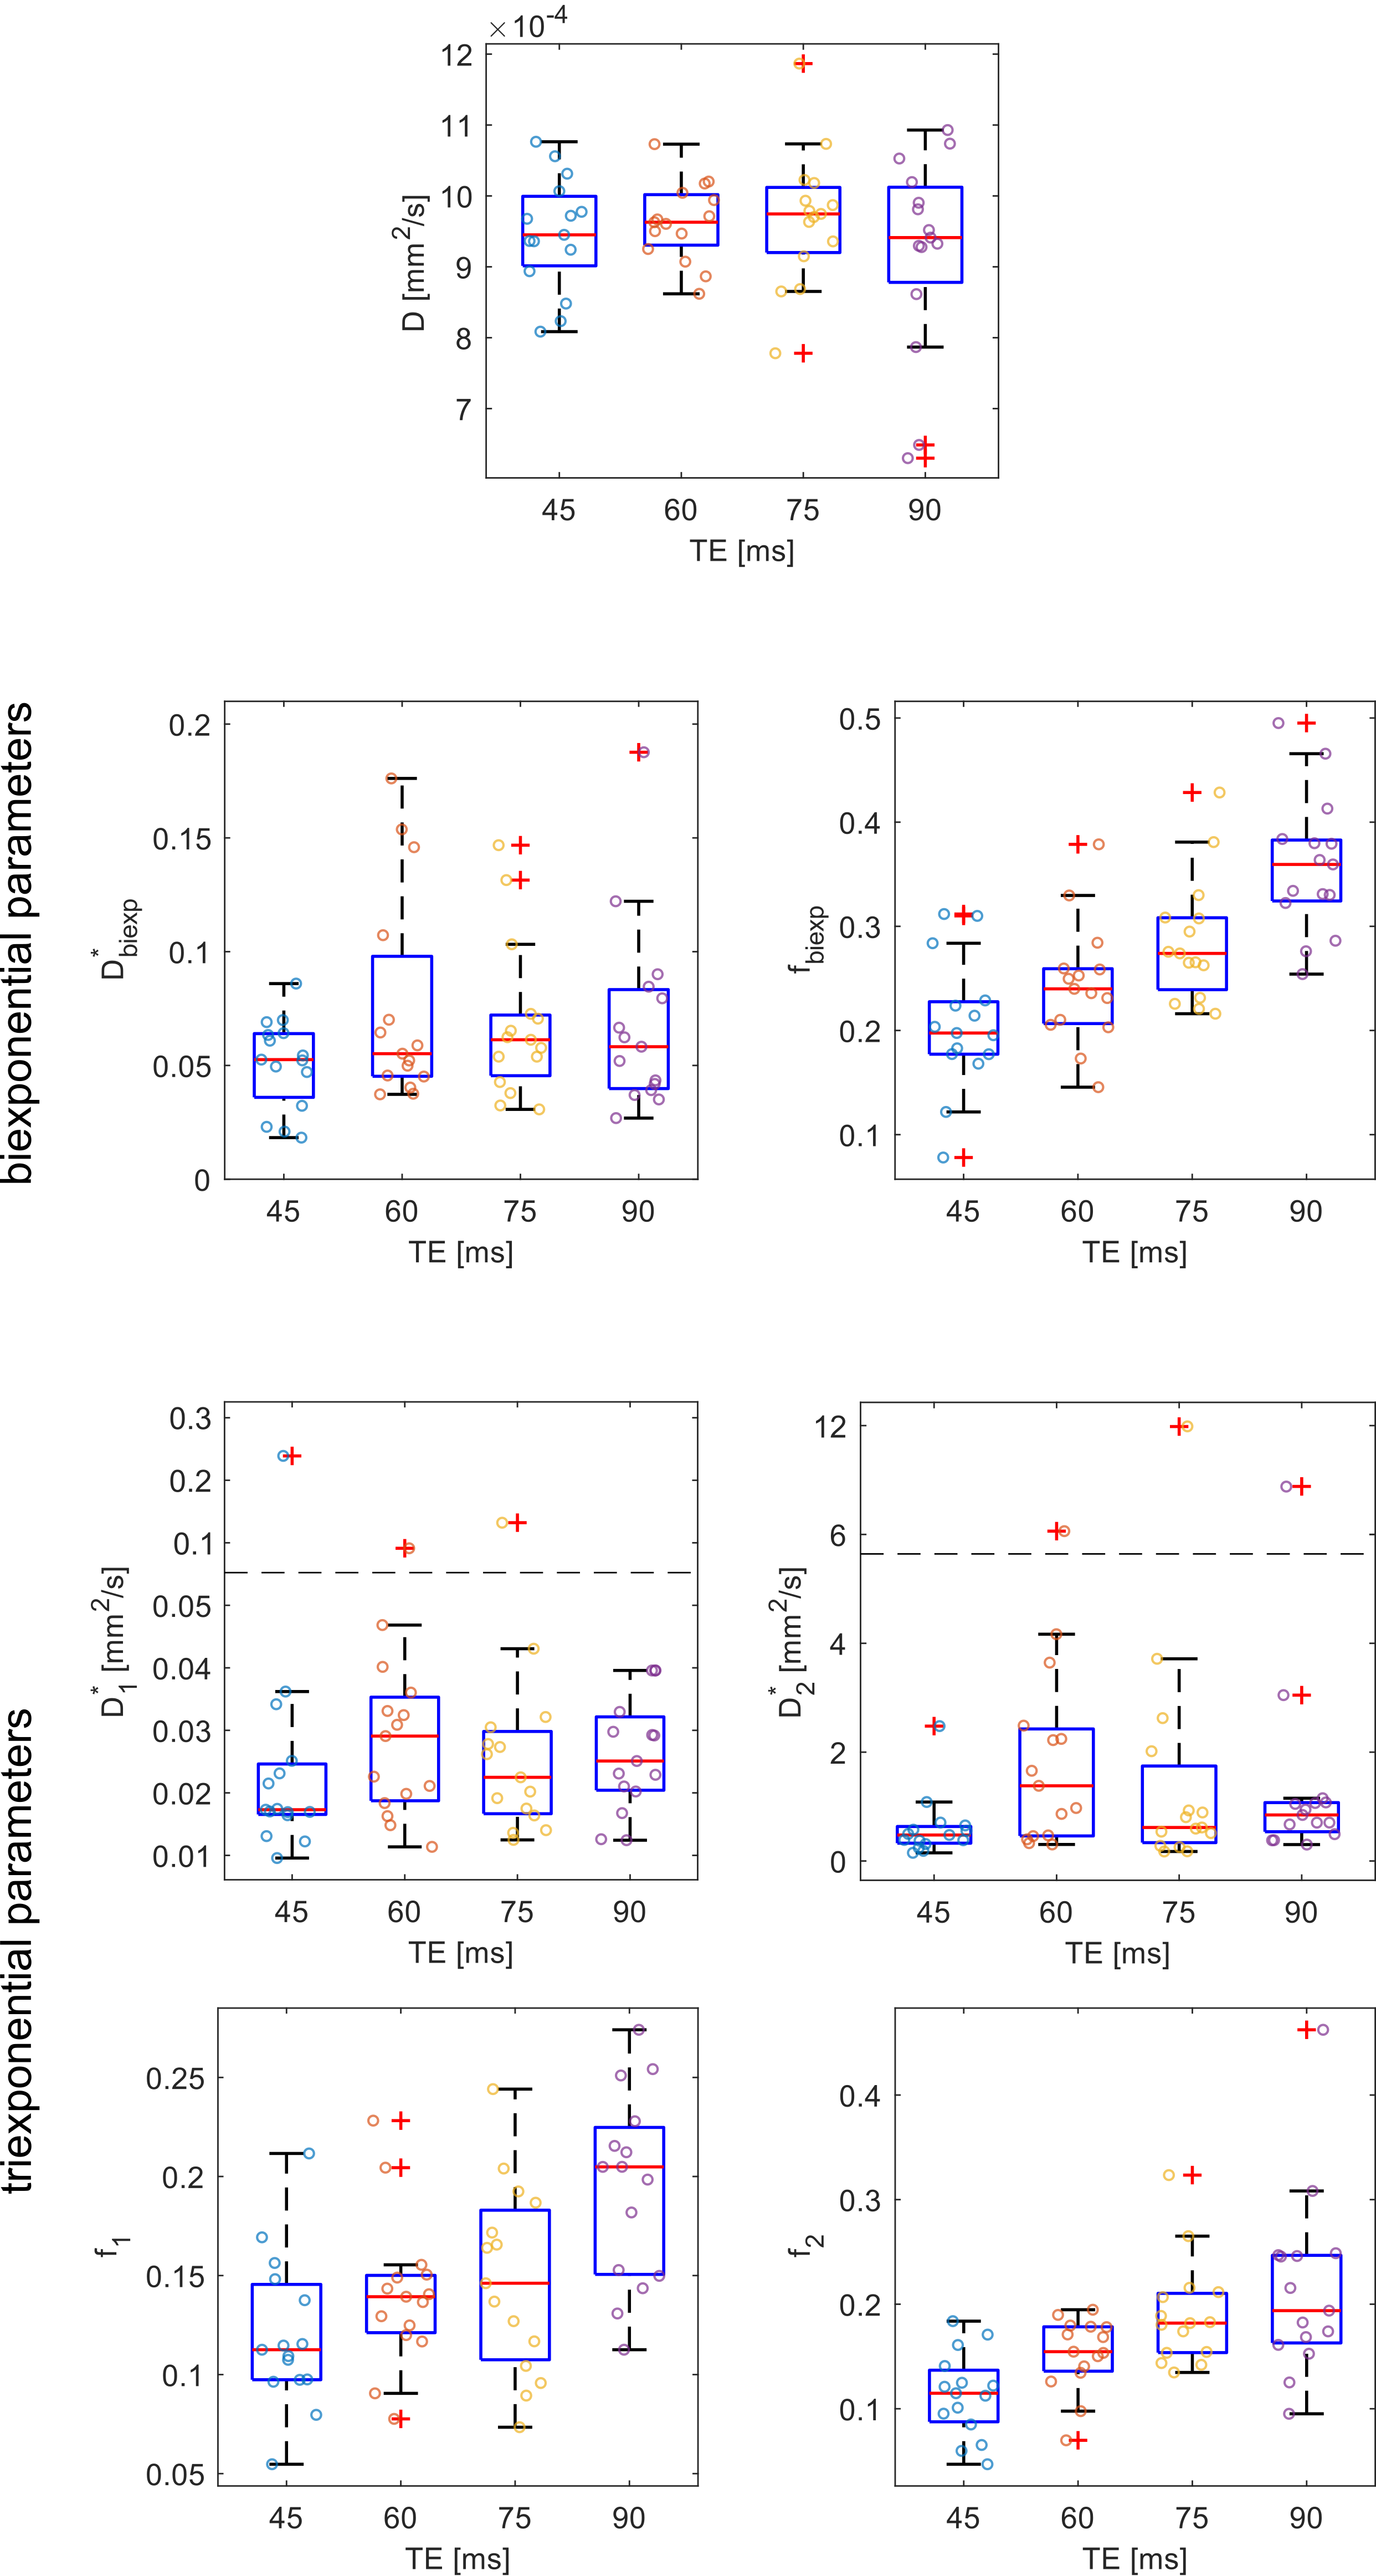
Representative data and fits are shown in Figure 1. The resulting parameters are shown in boxplots in Figure 2. The median diffusion coefficient D was in a range between 9.45 x 10⁻⁴ mm2/s and 9.75 x 10⁻⁴ mm2/s and not echo-time dependent (p = 0.848).Biexponential parameters: The median biexponential perfusion fraction f was in the range [19.76 %, 35.94 %] and was significantly dependent on the echo time (p < 0.001). Significant changes occured between (45 ms, 75 ms), (45 ms, 90 ms), and (60 ms, 90 ms). The median biexponential pseudodiffusion coefficient D* assumed values in a range of [5.26 x 10⁻² mm2/s, 6.13 x 10⁻² mm2/s] and was not echo time dependent (p = 0.360).
Triexponential parameters: The median perfusion fractions f1 and f2 were in the range [11.25 %, 20.49 %] and [11.48 %, 19.38 %], respectively. Both were echo time dependent (p = 0.001 and p < 0.001, respectively). For f1, significant changes occured between the echo time pairs (45 ms, 90 ms) and (60 ms, 90 ms), for f2 between (45 ms, 75 ms) and (45 ms, 90 ms). The median pseudodiffusion coefficients D1* and D2* were in the range [1.73 x 10⁻² mm2/s, 2.91 x 10⁻² mm2/s] and [0.478 mm2/s, 1.385 mm2/s], respectively. Both of them did not show a significant echo time dependence (p = 0.360 and p = 0.053, respectively).
Discussion
The values of the biexponential IVIM parameters are well in line with other studies.7 The fact that the biexponential perfusion fraction rises with the echo time was also described in previous studies and can be explained by the different T2 times of blood and tissue.8 The behavior of the triexponential perfusion fractions is in accordance with the observations made for biexponential IVIM.8 The observation that the pseudodiffusion coefficients are not significantly echo time dependent is consistent with previous reports.9Conclusion
The almost identical monotonic rise of the triexponential perfusion fractions f1 and f2 with echo time indicates that their T2 times are similar and that corresponding compartments may not be linked straightforwardly to arterial and venous blood compartment, which is in agreement with the study by Riexinger et al.1 The independence of bi- and triexponential pseudodiffusion coefficients indicates that they can be compared without TE-correction among studies.Acknowledgements
Funding by the Deutsche Forschungsgemeinschaft is gratefully acknowledged (LA 2804/12-1, LA 2804/13-1). We thank the Imaging Science Institute (Erlangen, Germany) for providing us with measurement time.References
1. Riexinger AJ, Martin J, Rauh S, et al. On the Field Strength Dependence of Bi- and Triexponential Intravoxel Incoherent Motion (IVIM) Parameters in the Liver. Journal of magnetic resonance imaging : JMRI. 2019.
2. van Baalen S, Leemans A, Dik P, Lilien MR, Ten Haken B, Froeling M. Intravoxel incoherent motion modeling in the kidneys: Comparison of mono-, bi-, and triexponential fit. Journal of magnetic resonance imaging : JMRI. 2017;46(1):228-239.
3. Cercueil JP, Petit JM, Nougaret S, et al. Intravoxel incoherent motion diffusion-weighted imaging in the liver: comparison of mono-, bi- and tri-exponential modelling at 3.0-T. Eur Radiol. 2015;25(6):1541-1550.
4. Wurnig MC, Germann M, Boss A. Is there evidence for more than two diffusion components in abdominal organs? - A magnetic resonance imaging study in healthy volunteers. NMR in biomedicine. 2017.
5. Jerome NP, d'Arcy JA, Feiweier T, et al. Extended T2-IVIM model for correction of TE dependence of pseudo-diffusion volume fraction in clinical diffusion-weighted magnetic resonance imaging. Physics in medicine and biology. 2016;61(24):N667-N680.
6. Hanspach J, Nagel AM, Hensel B, Uder M, Koros L, Laun FB. Sample size estimation: Current practice and considerations for original investigations in MRI technical development studies. Magnetic resonance in medicine. 2020.
7. Li YT, Cercueil JP, Yuan J, Chen W, Loffroy R, Wang YX. Liver intravoxel incoherent motion (IVIM) magnetic resonance imaging: a comprehensive review of published data on normal values and applications for fibrosis and tumor evaluation. Quantitative imaging in medicine and surgery. 2017;7(1):59-78.
8. Lemke A, Laun FB, Simon D, Stieltjes B, Schad LR. An in vivo verification of the intravoxel incoherent motion effect in diffusion-weighted imaging of the abdomen. Magnetic resonance in medicine. 2010;64(6):1580-1585.
9. Barbieri S, Donati OF, Froehlich JM, Thoeny HC. Comparison of Intravoxel Incoherent Motion Parameters across MR Imagers and Field Strengths: Evaluation in Upper Abdominal Organs. Radiology. 2016;279(3):784-794.
Figures