2119
Noninvasive Diagnosis of Portal Hypertension and Screening Varices with 4D Flow MRI: A Pilot Study1Center for Biomedical Imaging Research, Department of Biomedical Engineering, Tsinghua University, Beijing, China, 2Department of Radiology, The Fifth Medical Centre of Chinese PLA General Hospital, Beijing, China, Beijing, China, 3First Liver Cirrhosis Diagnosis and Treatment Center, The Fifth Medical Center of Chinese PLA General Hospital, Beijing, China, Beijing, China, 4Department of Radiology, First Center Hospital of Tianjin, Tianjin, China, Tianjin, China, 5CHESS Center, Institute of Portal Hypertension, The First Hospital of Lanzhou University, Lanzhou, China, Lanzhou, China
Synopsis
Portal hypertension (PH) is a severe liver disease which could lead to gastroesophageal varices. Noninvasive methods to diagnose PH and to evaluate the risk of variceal bleeding are needed. 4D Flow MRI is an advanced technique which could provide visualization and quantification of blood flow. In the study, we identified the reproducibility of the processing and quantifying procedure of 4D Flow data and discovered the significant hemodynamic differences in portal vein between PH patients and controls using 4D Flow MRI. Additionally, we tested the performance of 4D Flow MRI in diagnosing PH and stratifying the risk of variceal bleeding.
Introduction
Portal hypertension (PH) is commonly observed in patients with chronic liver disease1. The clinical marker for the diagnosis of PH is hepatic venous pressure gradient (HVPG), by which clinically significant portal hypertension (CSPH) is defined when HVPG is over 10mmHg2. However, HVPG is an invasive, costly measurement and not available in primary medical centers. Severe PH could lead to gastroesophageal varices. It’s a lethal complication and the management of variceal hemorrhage is crucial1,3. Therefore, repetitive endoscopy exams are performed to monitor the risk of variceal bleeding. During this process, patients carry the risk of sedation, perforation and infection4. Therefore, noninvasive methods to diagnose PH and evaluate the risk of variceal bleeding are urgently needed.Four-dimensional (4D) Flow MRI provides a time-resolved, three-dimensional, three-directionally velocity-encoded flow information5. With this approach, the visualization of the blood flow and the quantification of various hemodynamic parameters could be achieved. We hypothesize that the hemodynamic condition in the portal vein (PV) evaluated by 4D Flow MRI could help diagnose CSPH and monitor the risk of variceal bleeding. The objectives of the study are to: a) identify the reproducibility of the quantification of hemodynamic parameters of PV using 4D Flow MRI; b) investigate the performance of 4D Flow MRI in detecting CSPH; c) utilize 4D Flow MRI to help evaluate the risk of variceal bleeding.
Materials and Methods
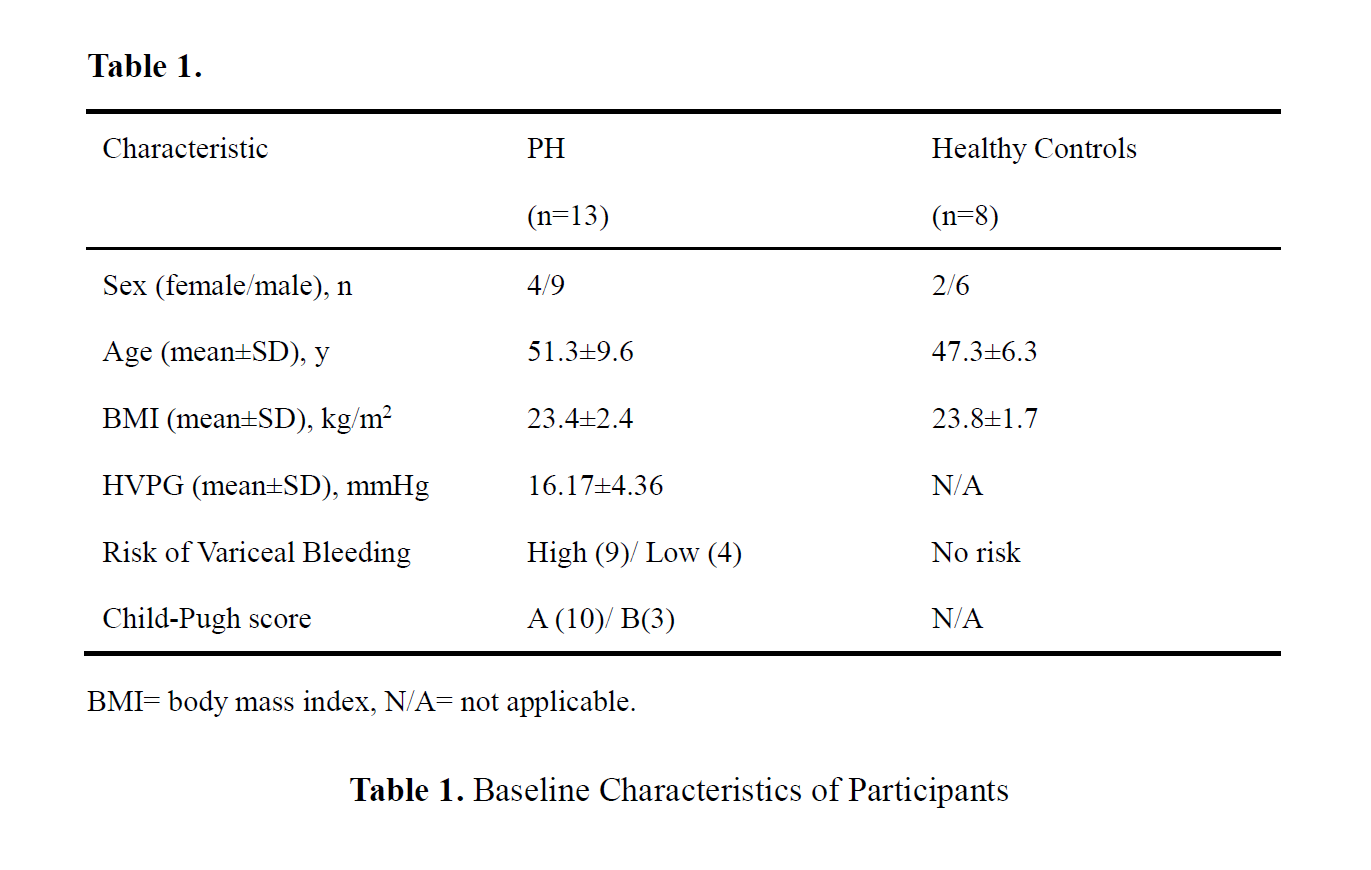
The retrospective single-center study was approved by the local ethics review board. Written informed consent was obtained from all subjects.A total of 13 PH patients were recruited at The Fifth Medical Center of Chinese PLA General Hospital. All of them underwent HVPG examinations and were diagnosed as CSPH. They also underwent endoscopy to screen varices and the risk of bleeding was stratified by experienced doctors. 8 healthy volunteers with no history of liver disease were recruited during the same period. All subjects underwent 4D Flow MRI scans. For patients, the scans were scheduled 1 week within the HVPG examinations. Crucial information of the subjects is displayed in Table 1.
The MRI examinations were performed on a 3T MR scanner (Philips Ingenia). All subjects had sinus rhythm and were scanned in the supine position. The 4D Flow scans were performed by a free-breathing, prospective respiratory navigator gated and peripheral pulse gated multi-shot turbo field echo sequence with three-directional velocity encoding. The Venc was set to 50/75/150 (RL/AP/FH) cm/s. With a SENSE (P, 1.5) acceleration, the planned scan time is about 8 minutes.
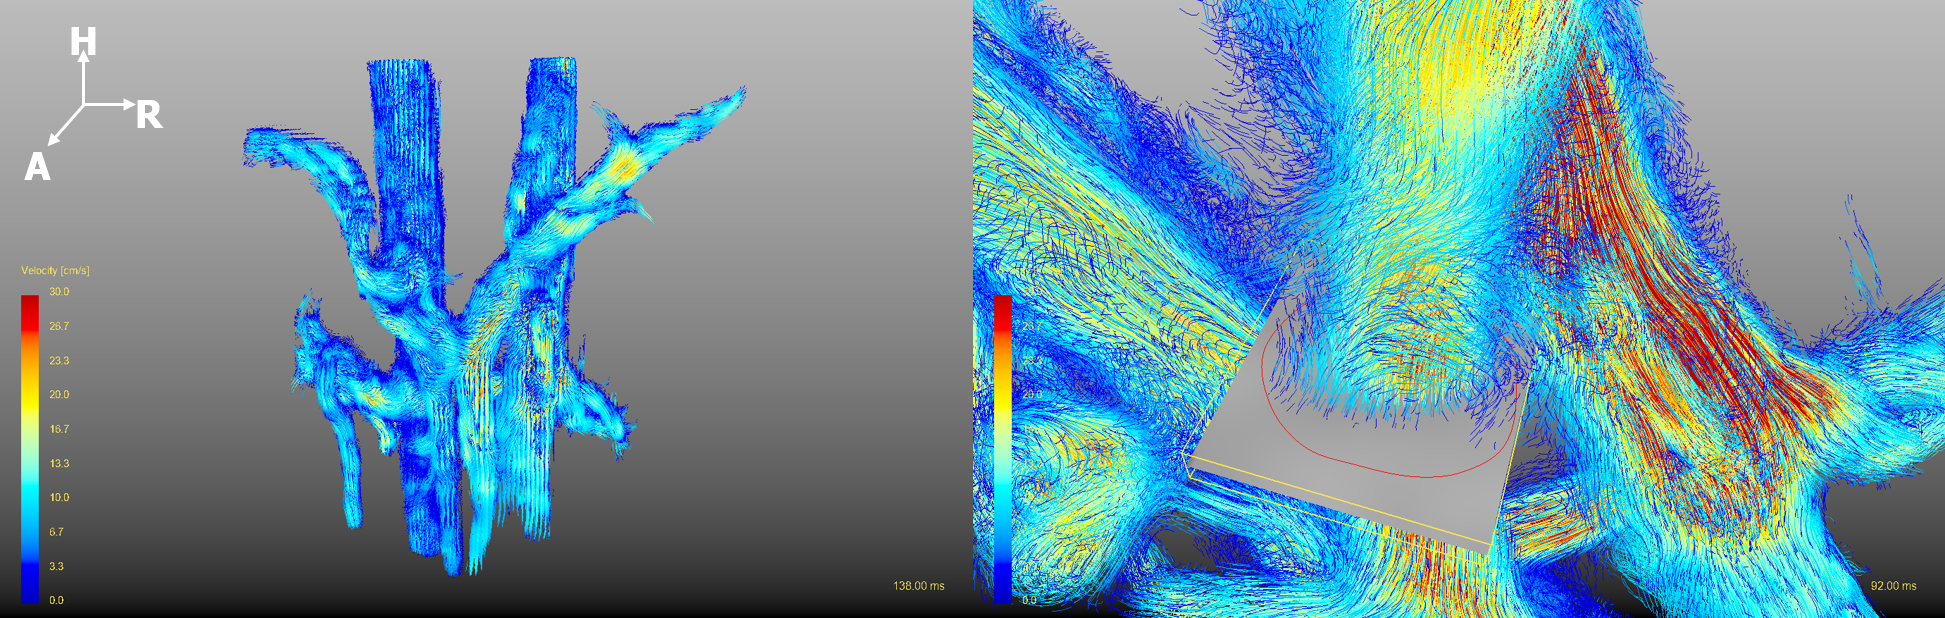
The pre-processing, visualization, and quantification of 4D Flow MRI data were performed with GTFlow (Gyrotools). The pre-processing procedure included the correction of eddy current and velocity aliasing, and the application of velocity and signal intensity masks. A vessel wall was segmented based on the velocity-weighted masks and a visible pathline graph was reconstructed from the velocity field. To quantify the hemodynamic parameters, a plane was created perpendicular to PV at liver hilum. A contour was drawn manually inside the plane to cover all the blood flow, as shown in Figure 1 (right). The flow volume inside the contour in one cardiac cycle (Flowcyc) and the average velocity of the flow (Vavg) were measured. Flowcyc was divided by body weight to be normalized for the following analysis.
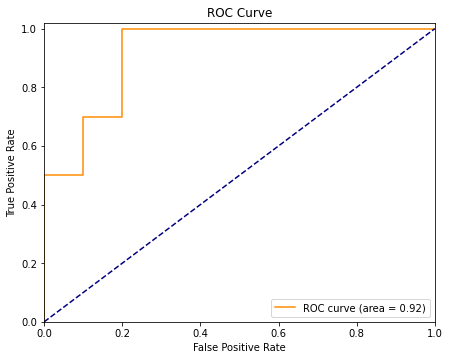
The data of 5 PV patients and 5 volunteers (randomly chosen) were included in the reproducibility test using Bland-Altman analysis. A set of Student t-tests of the hemodynamic parameters measured from 4D Flow MRI were operated between the 2 groups. A receiver operating characteristic curve (ROC) was depicted to evaluate the diagnostic performance.
Results
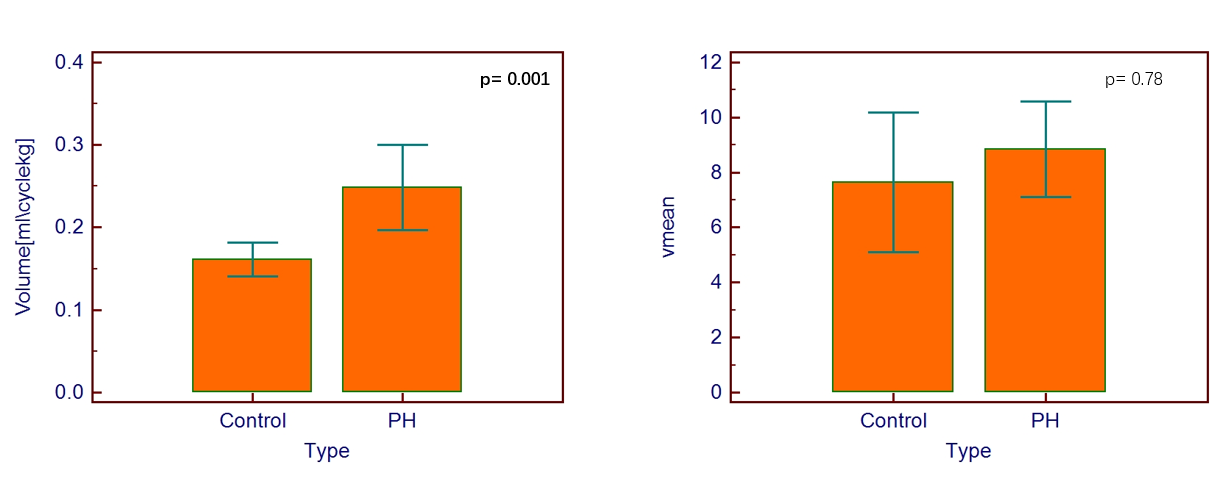
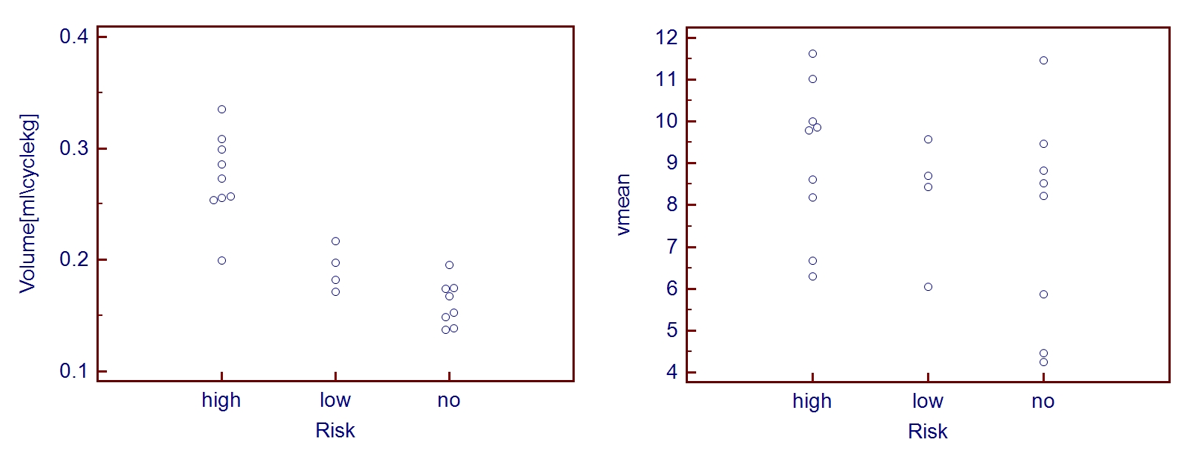
The calculation of the hemodynamic parameters from the 4D Flow data showed great intra-observer reproducibility (Bland-Altman bias=-2.7% (Flowcyc)/ -3.7% (Vavg)) and inter-observer reproducibility (Bland-Altman bias=4.2% (Flowcyc)/ -4.4% (Vavg)). As shown in Figure 2, PH patients have significantly lower normalized Flowcyc than healthy volunteers (0.161±0.019 vs 0.249±0.050). This index could also help stratify the risk of variceal bleeding, shown in Figure 3. The 2 groups don’t have significantly different Vavg. For normalized Flowcyc, the area under ROC (AUC) to detect CSPH is 0.92, shown in Figure 4.Discussion
We observed excellent inter/intra-observer reproducibility of the processing and measuring procedure, which could ensure the reliability of the results and the possibility of the clinical training and uses of the method. The results indicated significantly lower normalized blood flow in PH patients. This phenomenon could be explained by the system vasodilatation and hypervolemia of PH patients6. The normalized flow volume of PV showed great performance in detecting CSPH (AUC=0.92) and stratifying the risks of variceal bleeding. As a noninvasive imaging modality, we could expect 4D Flow MRI to become a potential biomarker in diagnosing CSPH and screening varices. More subjects could be involved into the study and more information could be extracted from the 4D Flow data to validate the clinical value of the method.Conclusion
To conclude, on the basis of the great reproducibility, the study discovered the hemodynamic difference of PV between PH patients and controls and validated the performance in diagnosing CSPH and screening varices of the method. We believe 4D Flow MRI, as a non-invasive technique could offer more help in evaluating and better understanding the disease.Acknowledgements
No acknowledgement found.References
1. Tsochatzis EA, Bosch J, Burroughs AK. Liver cirrhosis. Lancet 2014;383(9930): 1749–1761.
2. de Franchis R; Baveno VI Faculty. Expanding consensus in portal hypertension: report of the Baveno VI Consensus Workshop—stratifying risk and individualizing care for portal hypertension. J Hepatol 2015;63(3):743–752.
3. Garcia-Tsao G, Bosch J. Management of varices and variceal hemorrhage in cirrhosis. N Engl J Med 2010;362(9):823–832 [Published correction appears in N Engl J Med 2011;364(5):490. Dosage error in article text.] https://doi.org/ 10.1056/NEJMra0901512.
4. Leffler DA, Kheraj R, Garud S, et al. The incidence and cost of unexpected hospital use after scheduled outpatient endoscopy. Arch Intern Med 2010;170(19): 1752–1757.
5. Markl M , Frydrychowicz A , Kozerke S , et al. 4D flow MRI[J]. Journal of Magnetic Resonance Imaging, 2012, 36(5):1015-1036.
6. Shung D L , Guadalupe Garcia‐Tsao. Liver Capsule: Portal Hypertension and Varices: Pathogenesis, Stages, and Management[J]. Hepatology, 2017, 65(3).
Figures