2116
Contrast-enhanced MRI radiomics for predicting therapeutic response to transcatheter arterial chemoembolization in HCC1The First Affiliated Hospital of Dalian Medical University, Dalian, China, 2Chengdu Institute of Computer Application, Chinese Academy of Sciences, Chengdu, China, 3University of Chinese Academy of Sciences, Beijing, China, 4GE Healthcare (China), ShangHai, China
Synopsis
In the present study, contrast-enhanced MRI radiomics was demonstrated to be capable to predict therapeutic response in hepatocellular carcinoma treated with transcatheter arterial chemoembolization, which will provide some guidance for treatment decisions.
Purpose
To explore the application of contrast-enhanced MRI radiomics to predict therapeutic response in hepatocellular carcinoma (HCC) after transcatheter arterial chemoembolization (TACE).Introduction
HCC is the sixth most common cancer and ranks as the fourth leading cause of cancer-related deaths worldwide [1]. TACE as the first-line therapy, is accepted as an effective mean to control tumor growth, to prolong survival, and to improve quality of life for intermediate-stage HCC patients [2,3]. Accurate assessment of therapeutic response to predict efficacy before the performance of TACE is important for treatment planning. Thus, it is necessary to explore an non-invasive method to preoperatively identify factors that can predict treatment response before TACE for guiding further surveillance and treatment. Radiomics is an emerging method that converts medical images into high-dimensional quantitative features through different algorithms, potentially aiding in cancer detection, diagnosis, treatment response assessment, and prognosis prediction [4]. Therefore, contrast-enhanced MRI radiomics was introduced in the present study to evaluate its clinical application in predicting therapeutic response of HCC after TACE.Methods
We retrospectively analyzed 122 HCCs treated with TACE who underwent contrast-enhanced MRI before initial TACE. The diagnosis of HCC was determined by pathology or imaging features on the basis of the guidelines of the American Association for the Study of Liver Disease (AASLD). All patients have underwent preoperative contrast-enhanced MR examinations within two weeks before TACE and a follow-up MRI scan after TACE (within 2 months). To assess tumor response, the modified Response Evaluation Criteria in Solid Tumors (mRECIST) criteria was applied to MRI findings, and the mRECIST system grades target lesion responses as follows: complete response (CR), partial response (PR), stable disease (SD) and progressive disease (PD). We classified CR and PR as objective response (OR), and SD and PD as non-response (NR). On the arterial, portal venous and delayed phase images, two radiologists manually outlined the regions of interest (ROIs) which enclosed the boundary of target lesions. A total of 789 radiomics features from each enhanced phase were extracted, which were composed of histogram features, formfactor features, texture (Haralick, GLSZM, GLCM, and RLM) features, and higher order statistics features via Gaussian transformation. Intraclass correlation coefficient (ICC), Spearman’s rank correlation test, univariate logistic regression, and least absolute shrinkage and selection operator (LASSO) logistic regression algorithm were performed for dimensionality reduction and identifying the most valuable features. Radiomics model was constructed using logistic regression analysis. The clinical-radiological model was constructed based on independent risk factors identified by univariate and multivariate logistic regression analyses. The combined model incorporating radiomics score and clinical-radiological risk factors was established, and the final model was presented as a nomogram. The prediction models were evaluated by receiver operating characteristic (ROC) curves and decision curve analysis.Results
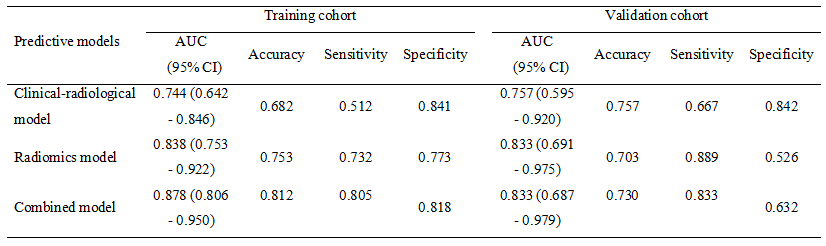
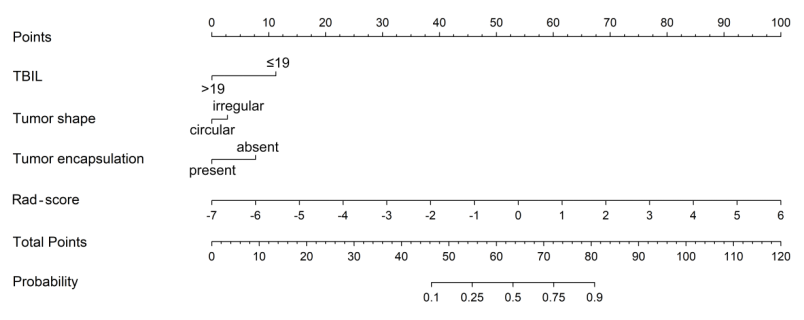
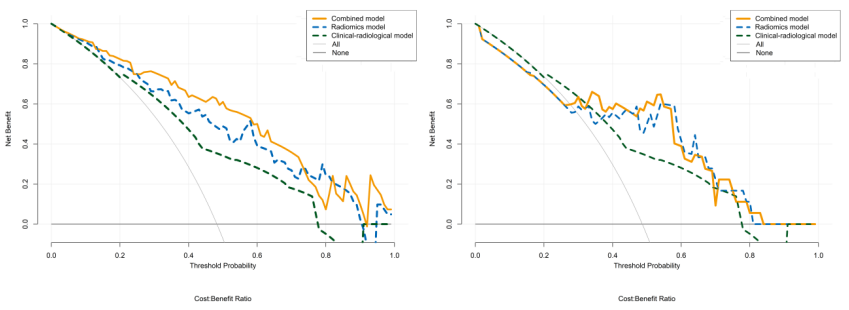
The AUCs of radiomics model were 0.838 and 0.833 in the training and validation cohorts, respectively. The clinical-radiological model that employed three effective predictors (total bilirubin, tumor shape and encapsulation) had the AUCs of 0.744 and 0.757, respectively. The combined model integrated the radiomics score and clinical-radiological risk factors, presenting a preferable performance compared to the clinical-radiological model alone, with AUCs of 0.878 and 0.833, respectively. The predictive performance and ROC curves of the radiomics model, clinical-radiological model, and combined model were shown in Table 1 and Figure 1. A combined nomogram was built based on this final model, and achieved good clinical utility (Figure 2 and 3).Discussion and Conclusion
We found that radiomics features derived from pretherapeutic contrast-enhanced MR images might be potential biomarkers of the response to TACE in patients with HCC. The combined model integrating the radiomics score with clinical-radiological factors demonstrates favorable performance, and the study presents a novel nomogram based on the combined model for the individualized and visualized prediction of therapeutic response of HCC patients undergoing TACE therapy. The proposed methodology could potentially recognize patients who would benefit from TACE, thereby further guide treatment planning.Acknowledgements
NoneReferences
[1] Villanueva A . Hepatocellular carcinoma. N Engl J Med. 2019; 380: 1450-1462.
[2] Kumari R, Sahu MK, Tripathy A, et al. Hepatocellular carcinoma treatment: hurdles, advances and prospects. Hepat Oncol. 2018; 5(2): HEP08.
[3] Marrero JA, Kulik LM, Sirlin CB, et al. Diagnosis, staging and management of hepatocellular carcinoma: 2018 Practice Guidance by the American Association for the Study of Liver Diseases. Hepatology. 2018; 68(2): 723-750.
[4] Bell M, Turkbey EB, Escorcia FE. Radiomics, Radiogenomics, and Next-Generation Molecular Imaging to Augment Diagnosis of Hepatocellular Carcinoma. Cancer J. 2020; 26(2):108-115.
Figures