2114
Comparing dedicated 2D-GRE to 3D-SPGR Dixon in- and opposed-phase imaging for the detection of hepatic intralesional fat or iron.1Radiology, Stanford University, Palo Alto, CA, United States
Synopsis
In- and opposed-phase imaging has become integral in liver MR imaging due to its ability to identify intravoxel fat or iron, important ancillary features in lesion characterization, particularly during hepatocellular carcinoma surveillance. Potentially, these features can be assessed through images acquired from dynamic contrast-enhanced imaging, rather than separate sequence acquisitions, decreasing scan times. Two blinded radiologists retrospectively reviewed MR liver examinations comparing in- and opposed-phase 2D-GRE imaging to 3D-SPGR Dixon imaging for the assessment of intralesional fat or iron. We found that there is no difference in fat or iron detection performance between dedicated 2D-GRE and 3D-SPGR Dixon sequences.
Introduction
Fat and iron content are important liver lesion imaging features1 and serve as quantitative biomarkers for metabolic derangements, such as hepatic steatosis2 or hemochromatosis3. One of the most common indications for liver lesion characterization is hepatocellular carcinoma (HCC) surveillance. Liver reporting and data system (LI-RADS), the predominant classification scheme for hepatic masses in patients at high risk for HCC, uses intralesional fat or iron as ancillary features favoring HCC or benignity, respectively4.In- and opposed-phase (IOP) imaging can detect intravoxel fat and iron based on the phase shift between water and fat5,6. IOP images are often acquired using a dedicated 2D-Gradient Recalled Echo (GRE) acquisition optimized for fat and iron detection. Another common sequence in liver imaging is 3D-Spoiled Gradient Recalled Echo (SPGR) dynamic post contrast imaging using a 2-point Dixon technique, which has robust fat-saturation and multiplanar reformat capabilities. This Dixon method can also be used to produce IOP images7,8.
As MRI is time intensive, it would be ideal to replace the separate dedicated 2D-GRE IOP acquisition with processed 3D-SPGR Dixon data already acquired for post contrast imaging; however, potential disadvantages include decreased signal-to-noise ratio and potential artifacts, such as fat-water swap7,9. To our knowledge, no study to date has compared the performance of dedicated 2D-GRE IOP images to those produced from 3D-SPGR Dixon data in the detection of fat or iron content in liver lesions.
Methods
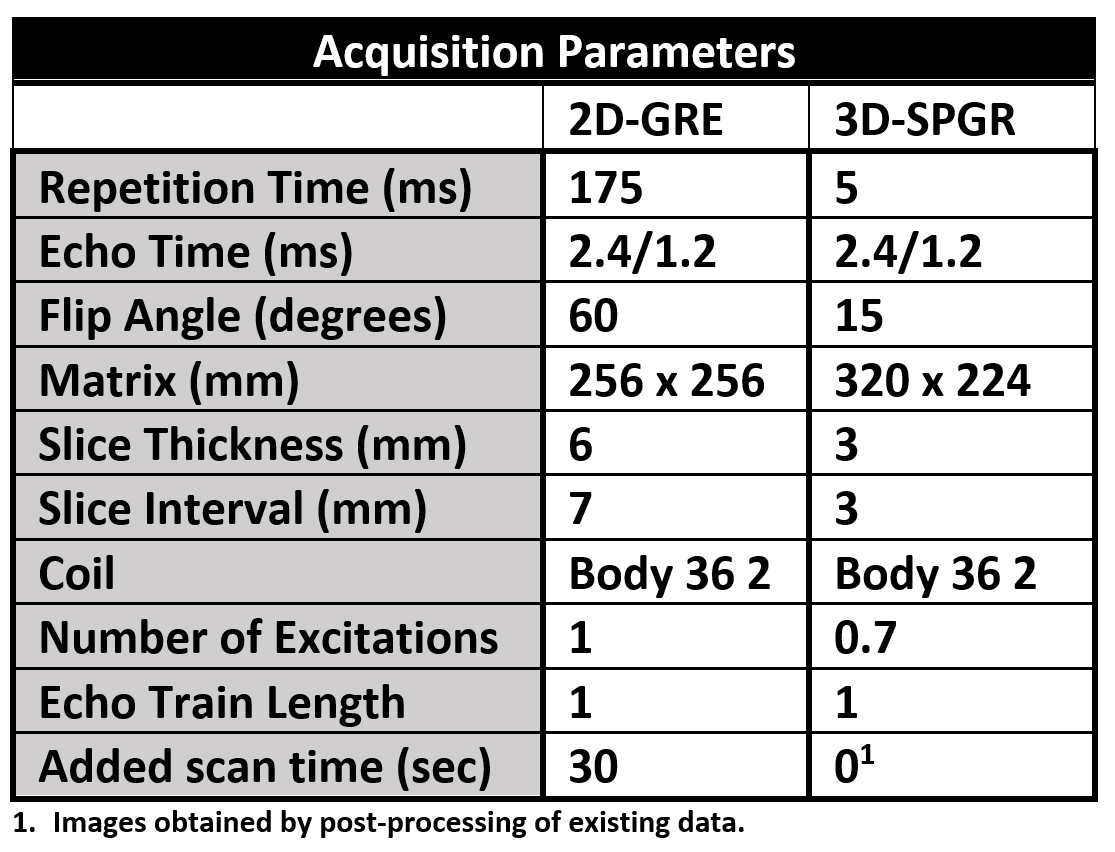
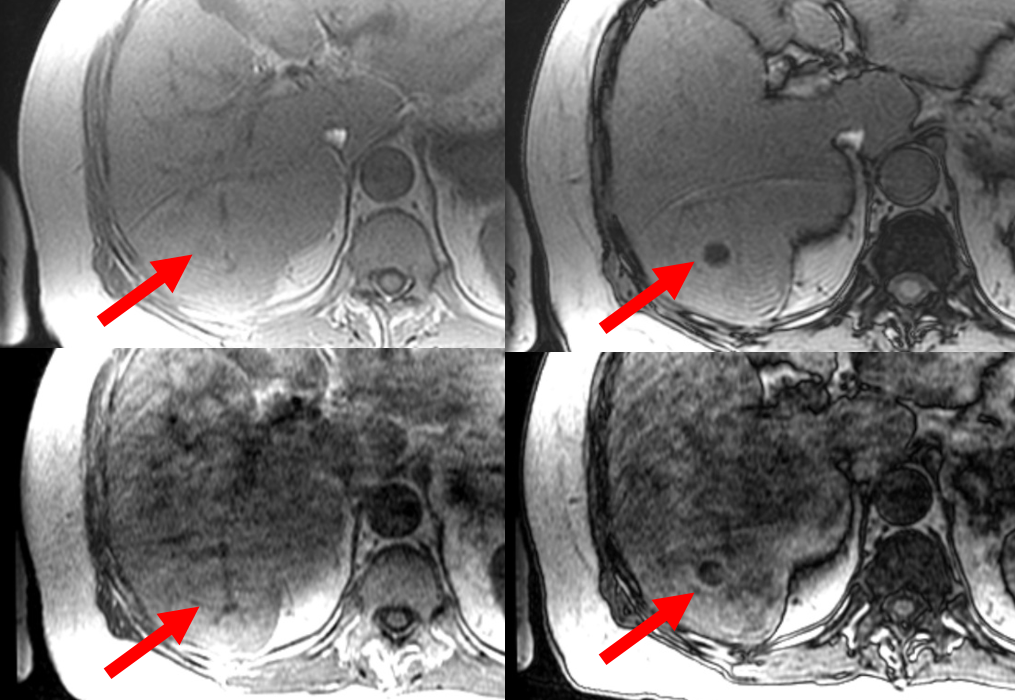
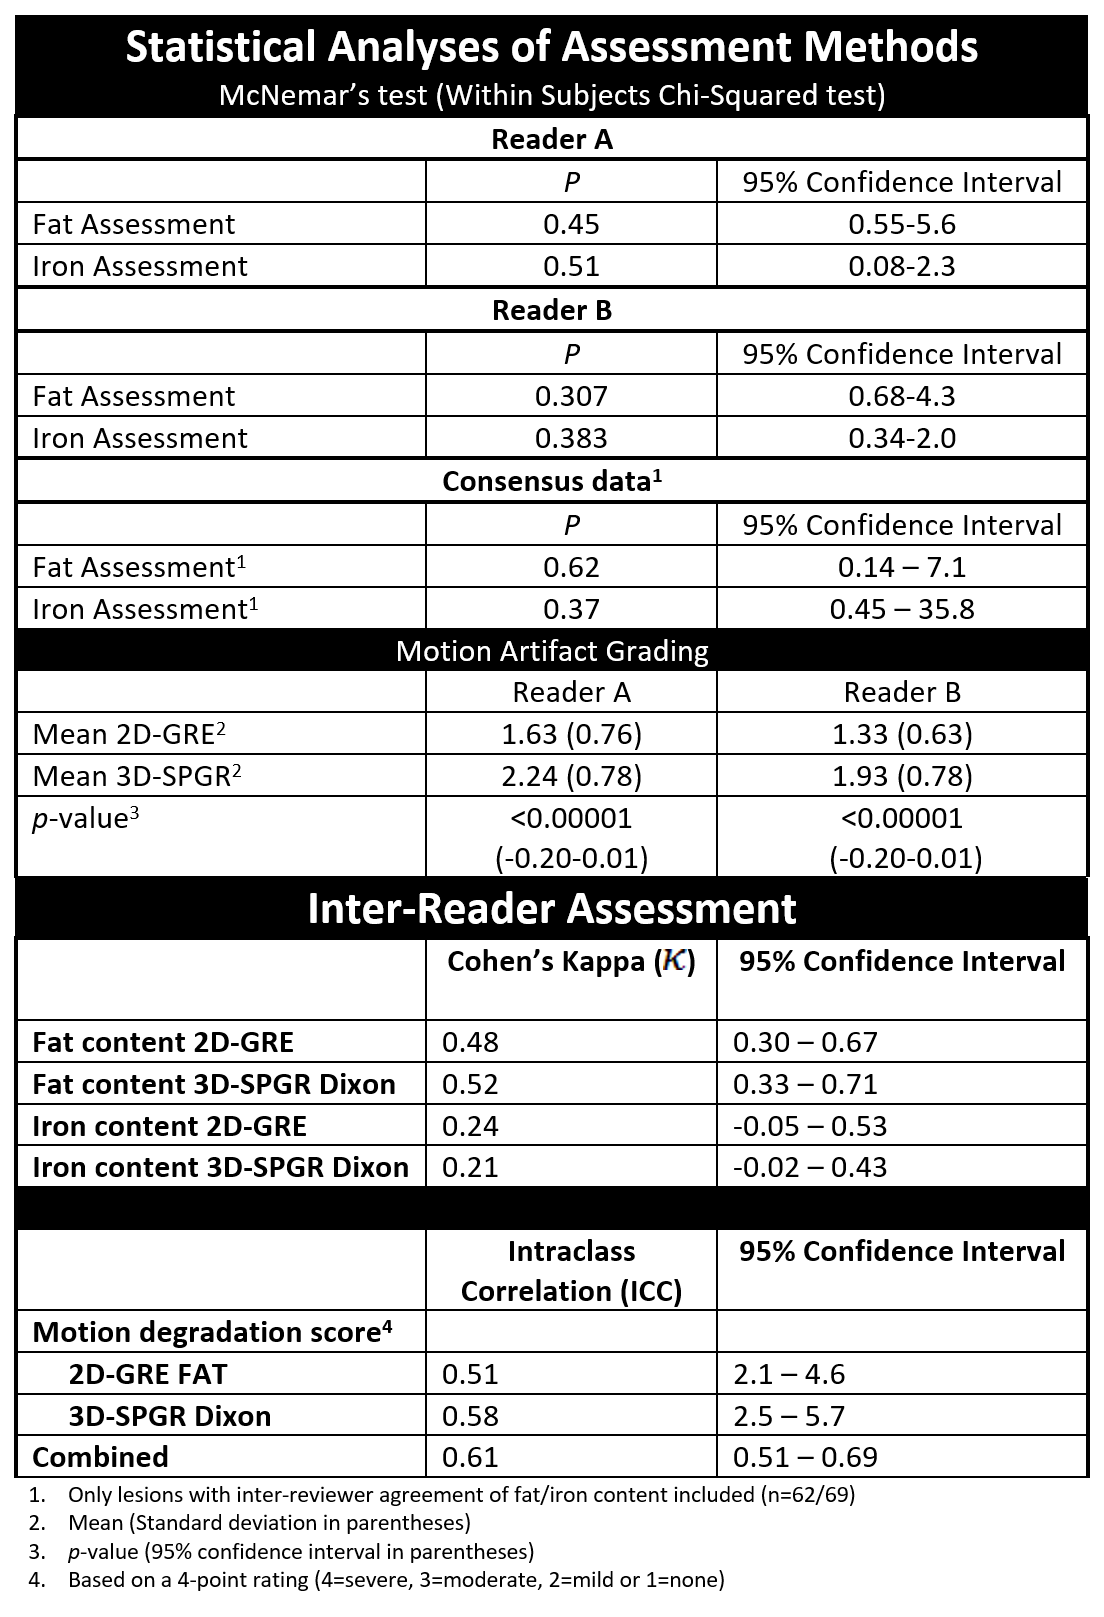
This retrospective study was performed with institutional review board approval and informed consent waiver. Consecutive MR liver examinations with both dedicated 2D-GRE and 3D-SPGR Dixon IOP sequences were identified. All scans were performed on one of seven 3T-MRI scanners (GE, Waukesha, WI) at a single institution (parameters detailed in Figure 1). Image sets displaying IOP sequences, with a post-contrast image best exemplifying the lesion(s) of interest, were presented to two independent radiologists (both fellows with 3 years of liver MRI reading experience) using a picture archiving and storage display system (PACS) (Sectra PACS IDS7, Sectra AB, Teknikringen, Sweden). Reviewers classified all lesions as having more, less, or equal fat relative to liver parenchyma and graded motion degradation on a 4-point scale, first for the full slate of dedicated 2D-GRE IOP images, and subsequently the pre-contrast 3D-SPGR IOP images (Figure 2). Proton density fat fraction (PDFF) and R2* imaging data derived from multi-echo acquisitions were used as reference standards10,11. McNemar’s test was used to assess equivalence between the two IOP sequences. Inter-observer performance was assessed using Cohen’s Kappa (k) and intraclass correlation coefficients (ICC). The sensitivity, specificity, positive predictive value, and negative predicted value were calculated for the detection of intralesional fat and iron. P < 0.05 was considered significant.Results
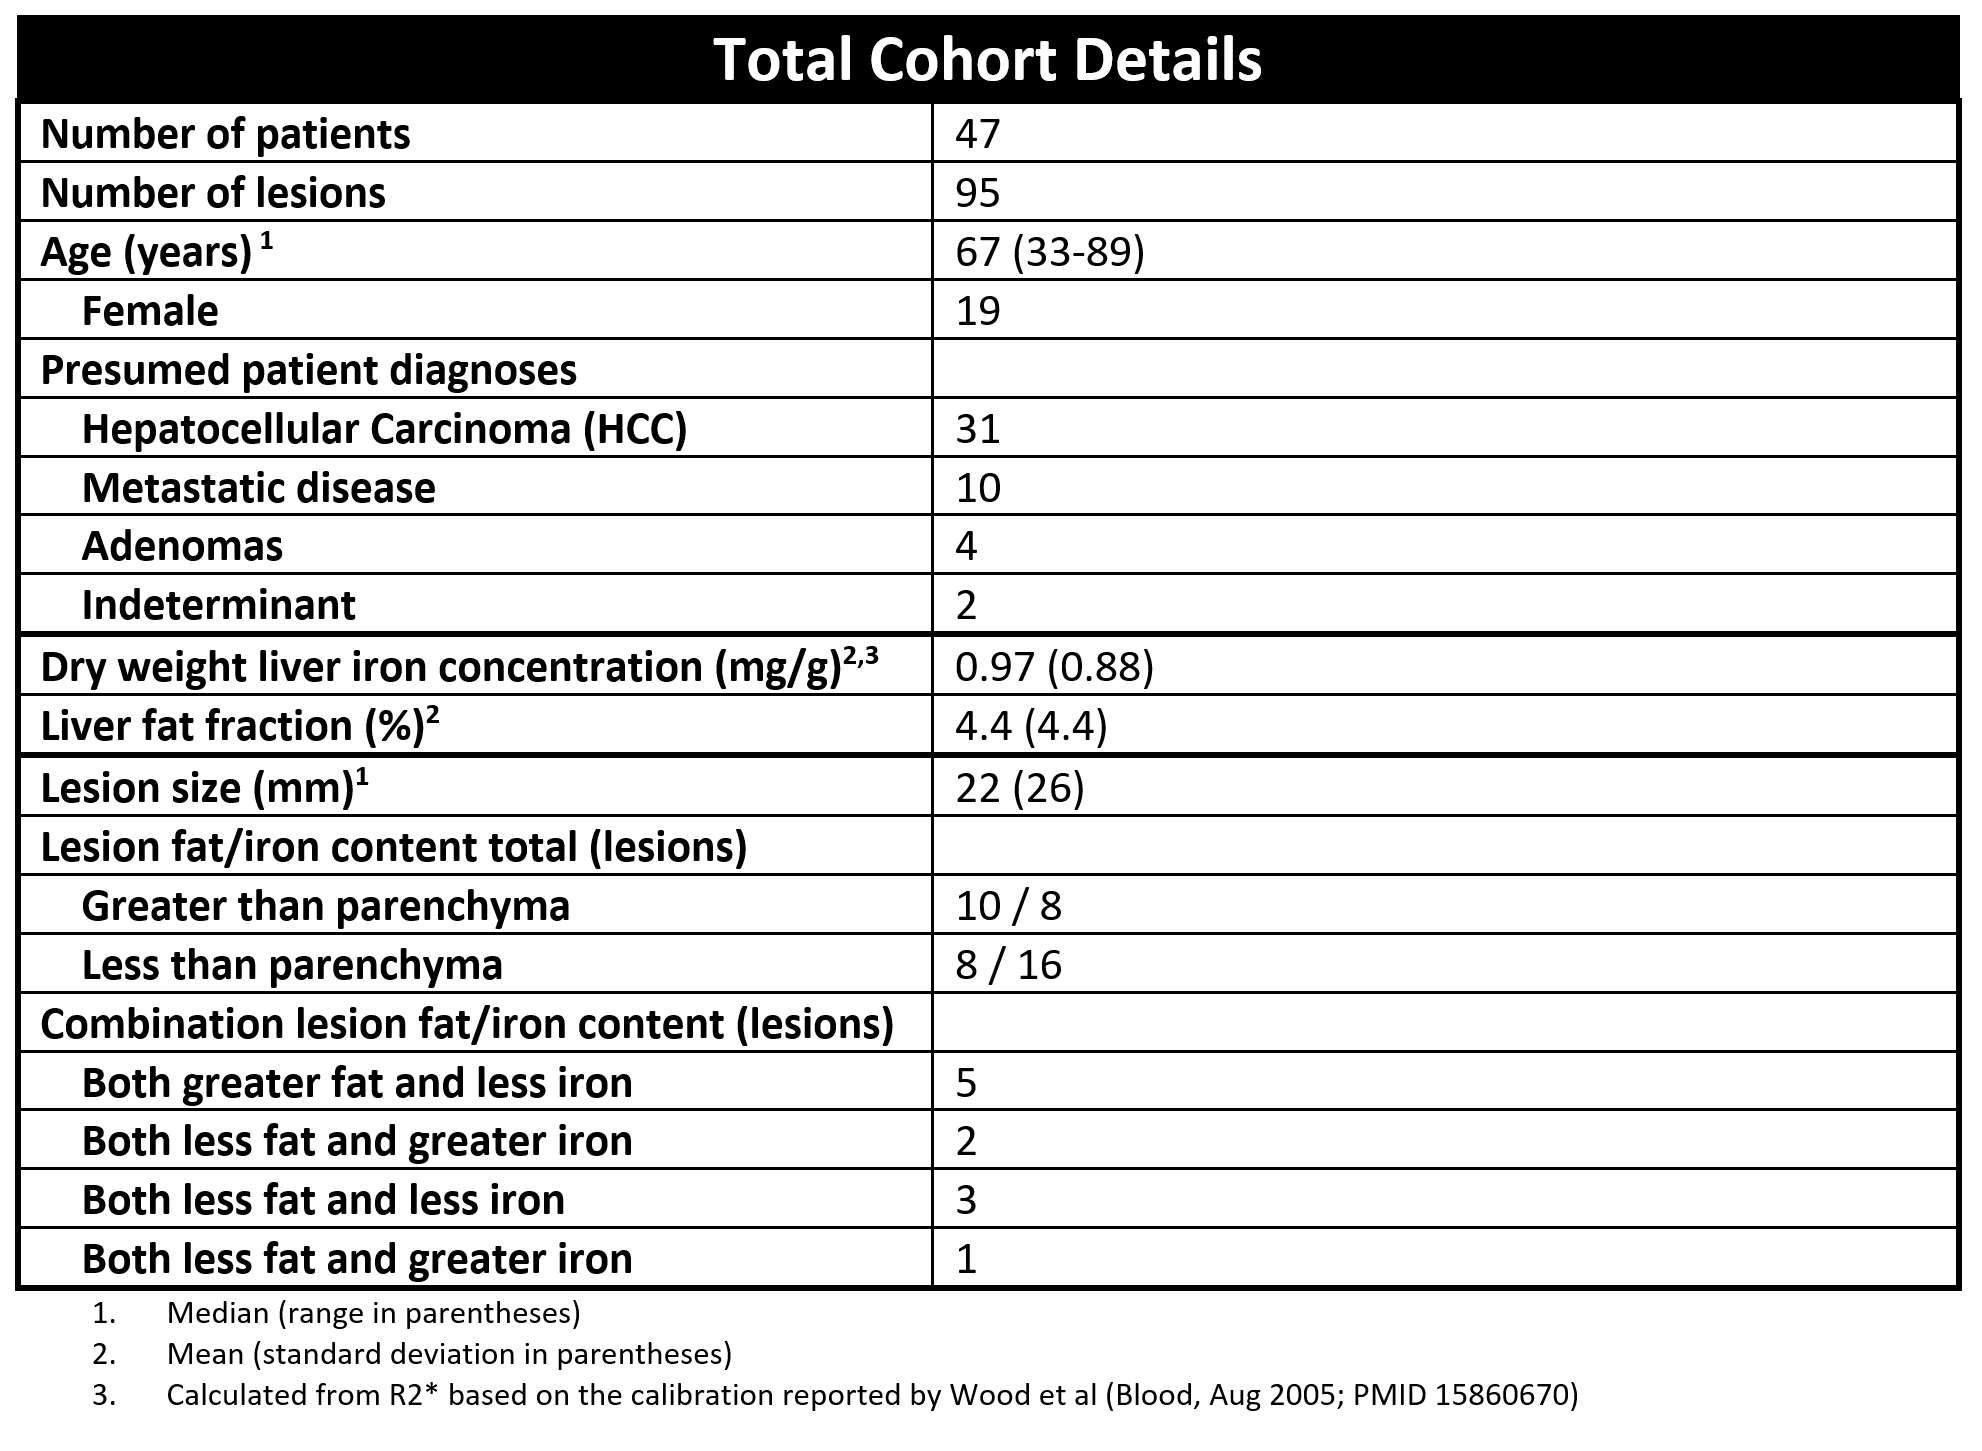
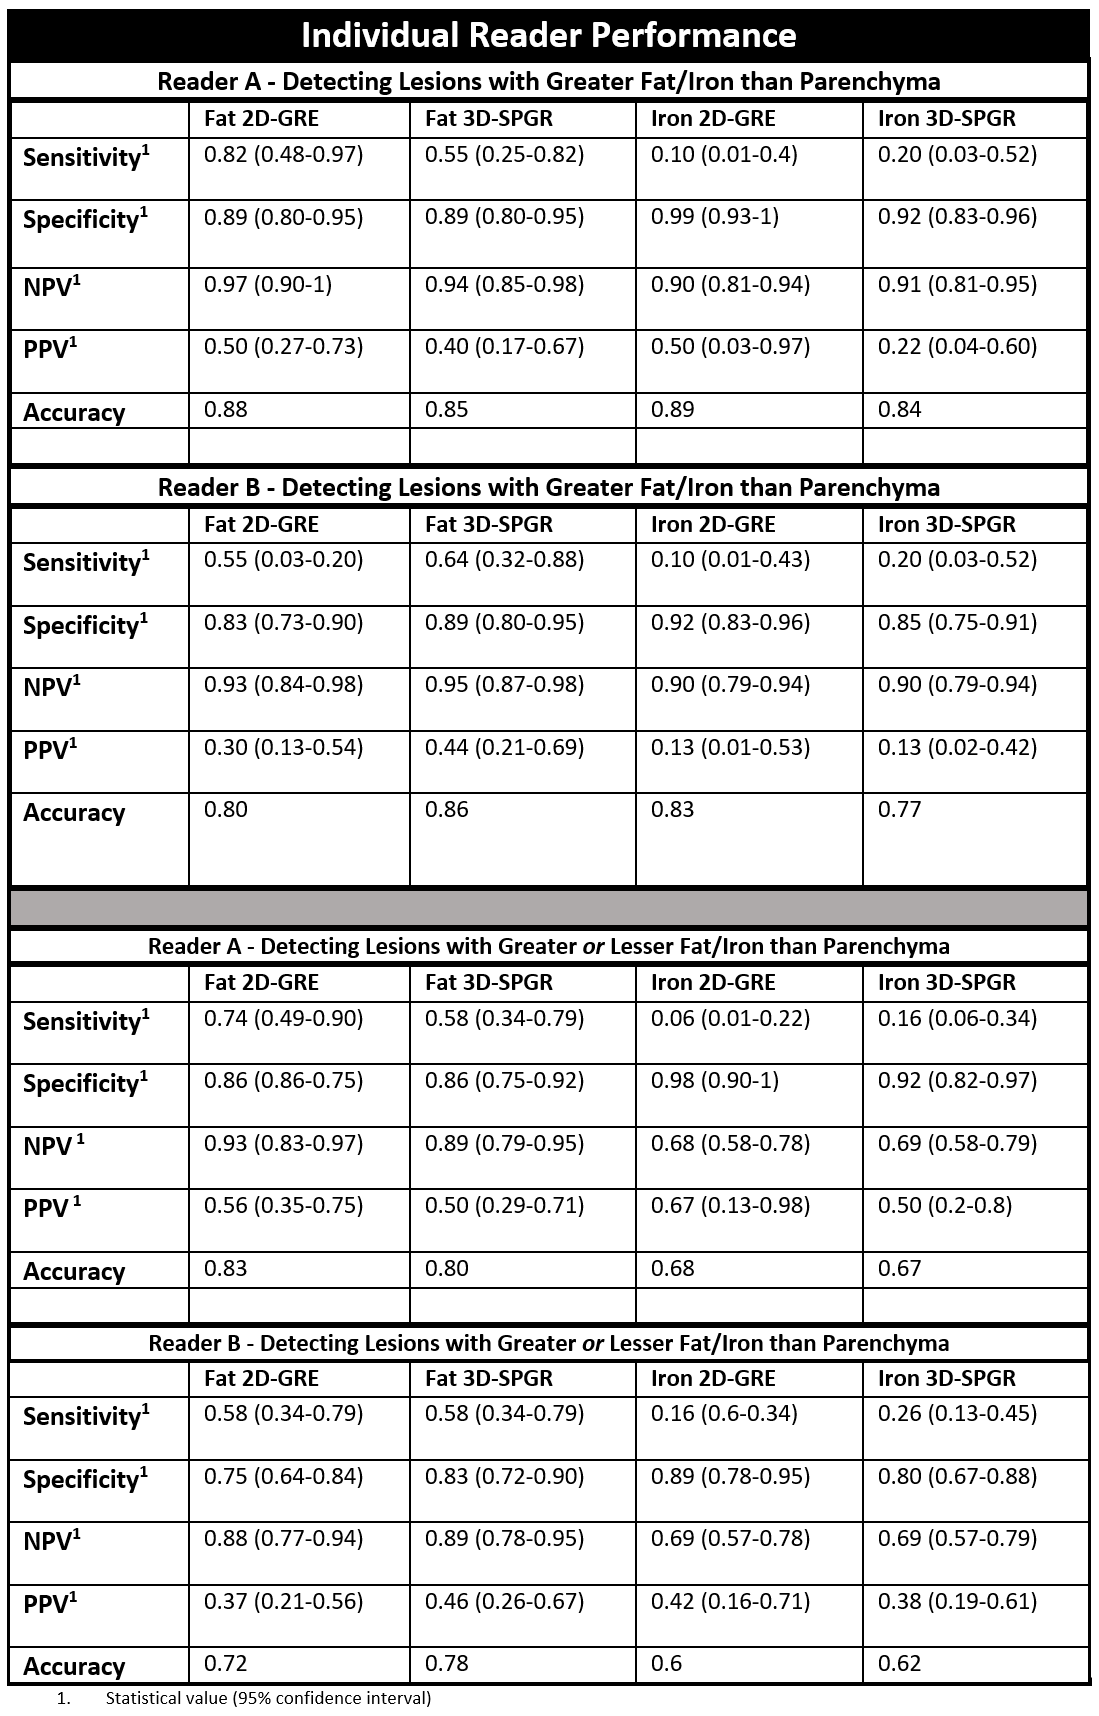
A total of 47 patients with 95 lesions were included (Figure 3). Lesion etiologies included HCC (31), metastases (10), adenomas (4), and indeterminant (2). Of the 95 lesions, 10 demonstrated more fat compared to background parenchyma, 8 less fat, 8 more iron, and 16 less iron on PDFF or R2* imaging, respectively. The median lesion size was 22 mm (range 5-229 mm).Reader sensitivities to altered intralesional fat (greater or lesser than parenchyma) with 2D-GRE were 0.74 (95% CI 0.49-0.90) and 0.58 (95% CI 0.34-0.79) compared to 0.58 (95% CI 0.4-0.79) for both readers with 3D-SPGR. Reader sensitivities to altered intralesional iron were 0.06 (95% CI 0.01-0.22) and 0.16 (95% CI 0.6-0.34) for 2D-GRE versus 0.16 (95% CI 0.06-0.34) and 0.26 (95% CI 0.13-0.45) for 3D-SPGR (complete data in Figure 4). Performance differences between sequences was not statistically significant in fat (p=0.62, 95% CI 0.14-7.1) or iron evaluation (p=0.37, 95% CI 0.45-35.8). There was greater motion artifact scored in 3D-SPGR versus 2D-GRE images by both Reader A (35% vs. 13%, p<0.05) and Reader B (20% vs. 5%, p<0.05), with moderate interobserver agreement (ICC=0.61, 95% CI 0.51-0.69). There was moderate agreement in fat assessment on 2D-GRE and 3D-SPGR (k= 0.483, 0.518, respectively) and fair agreement for iron (k= 0.237, 0.205, respectively) (Figure 5).
Discussion
In this study, we show similar performance in the detection of hepatic intralesional fat or iron using dedicated 2D-GRE IOP images versus those derived from the pre-contrast phase of a dynamic contrast-enhanced 3D-SPGR Dixon acquisition. There was no significant difference in inter-reader correlation when assessing either fat or iron between the two sequences, despite both readers reporting more motion artifact with 3D-SPGR images. The finding of non-inferiority between these sequences suggests that using processed data from 3D-SPGR Dixon acquisitions may replace dedicated IOP imaging when evaluating liver lesions, decreasing scan time.This study is limited by small sample size, which could result in type-2 error. A larger study is planned, which will allow detailed subgroup analyses assessing the affect of background parenchymal fat and the presence of concurrent intralesional fat and iron on sequence performance. As both readers for this study are fellow-level trainees, more experienced readers may impact inter-reader variability and diagnostic performance. This study only evaluated liver lesions; however, assessment of other abdominal lesions, such as adrenal masses, may be a topic for future study.
Conclusion
Intralesional fat and iron content are equally well-assessed on either dedicated 2D-GRE or 3D-SPGR Dixon in- and opposed-phase MRI sequences.Acknowledgements
No acknowledgement found.References
1. Merkle EM, Nelson RC. Dual gradient-echo in-phase and opposed-phase hepatic MR imaging: A useful tool for evaluating more than fatty infiltration or fatty sparing. Radiographics. 2006. doi:10.1148/rg.265055711
2. Hussain HK, Chenevert TL, Londy FJ, et al. Hepatic fat fraction: MR imaging for quantitative measurement and display - Early experience. Radiology. 2005. doi:10.1148/radiol.2373041639
3. Queiroz-Andrade M, Blasbalg R, Ortega CD, et al. MR imaging findings of iron overload. Radiographics. 2009. doi:10.1148/rg.296095511
4. American College of Radiology . Liver Imaging Reporting and Data System. https://www.acr.org/Clinical-Resources/Reporting-and-Data-Systems/LI-RADS. Accessed December 10, 2020.
5. Shetty AS, Sipe AL, Zulfiqar M, et al. In-phase and opposed-phase imaging: Applications of chemical shift and magnetic susceptibility in the chest and abdomen. Radiographics. 2019. doi:10.1148/rg.2019180043
6. İdilman İS, Akata D, Özmen MN, Karçaaltıncaba M. Different forms of iron accumulation in the liver on MRI. Diagnostic Interv Radiol. 2016. doi:10.5152/dir.2015.15094
7. Ma J. Dixon techniques for water and fat imaging. J Magn Reson Imaging. 2008. doi:10.1002/jmri.21492
8. Dixon WT. Simple proton spectroscopic imaging. Radiology. 1984. doi:10.1148/radiology.153.1.6089263
9. Grande F Del, Santini F, Herzka DA, et al. Fat-suppression techniques for 3-T MR imaging of the musculoskeletal system. Radiographics. 2014. doi:10.1148/rg.341135130
10. Reeder SB, Hu HH, Sirlin CB. Proton density fat-fraction: a standardized MR-based biomarker of tissue fat concentration. J Magn Reson Imaging. 2012;36(5):1011-1014. doi:10.1002/jmri.23741
11. İdilman İS, Akata D, Özmen MN, Karçaaltıncaba M. Different forms of iron accumulation in the liver on MRI. Diagn Interv Radiol. 2016;22(1):22-28. doi:10.5152/dir.2015.15094
Figures