2112
3D Dual Flip Angle (DFA) T1 mapping at 3T for focal liver lesions: comparison with diffusion-weighted imaging1Anqing municipal hospital, Anqing, China, 2MR scientific Marketing, Diagnostic Imaging, Siemens Healthcare Ltd, Shanghai, China
Synopsis
The diagnostic value of dual-flip angle (DFA) T1 mapping and DWI imaging in the diagnosis of benign and malignant focal liver lesions (FLLs) were compared.T1 mapping includes Native T1,Enhanced T1 in the equilibrium period of 2 minutes after Gd-DTPA enhancement,and T1 enhancement rate ΔT1%.In T1 mapping, the enhanced T1 value and ΔT1% have diagnostic sensitivity and specificity similar with DWI.The Native T1 value is superior to DWI in the differential diagnosis of liver cysts and hemangioma.T1 mapping has a promising future as a non invasive alternative method for biopsy identification of benign and malignant FLLs.
Objectives
Compare the diagnostic value of three-dimensional dual flip angle (DFA) T1 mapping imaging and DWI imaging for benign and malignant focal liver lesions (FLLs) and the identification significance of cysts and hemangiomas.Methods
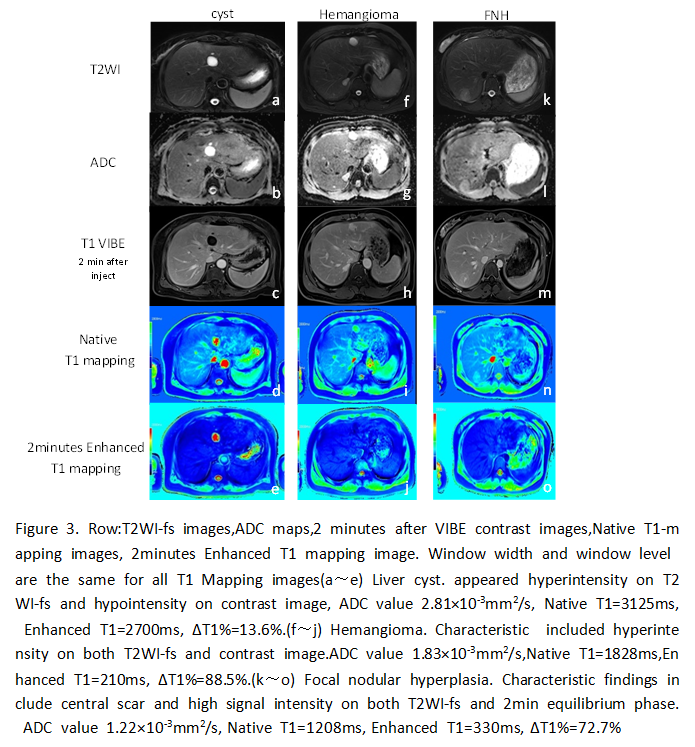
A retrospective study of 294 FLLs (150 benign and 144 malignant) in 173 patients who underwent both T1 mapping and DWI examinations. Data acquisitions were performed on a 3T MR scanner (Magnetom Skyra, Siemens Healthcare, Erlangen, Germany) with an 18-channel phased array coil. T1-mapping including B1 field calibration sequence (scan time 10s) and double-flip Angle (3o, 15o) 3D volumetric interpolated breath-hold examination (VIBE) sequence (scan time 18s) was applied before and 2 min after the injection of Gd-DTPA. T1 mapping includes initial T1 mapping (Native T1), T1 mapping (Enhanced T1) in the equilibrium period of 2 minutes after enhancement, and T1 enhancement rate ΔT1%=[(Native T1﹣Enhanced T1)/ Native T1]×100%. Compare the difference between ADC value and Native T1 value, Enhanced T1 value and ΔT1% between benign and malignant FLLs. One-way ANOVA analysis and the receiver operating characteristic curve (ROC) was used to compare and analyze the accuracy of T1 mapping and DWI in identifying benign and malignant FLLs, and to compare the value of Native T1 and ADC in the identification of cysts and hemangioma. The correlation between Native T1 value, Enhanced T1 value, ΔT1% and ADC value are also evaluated.Results
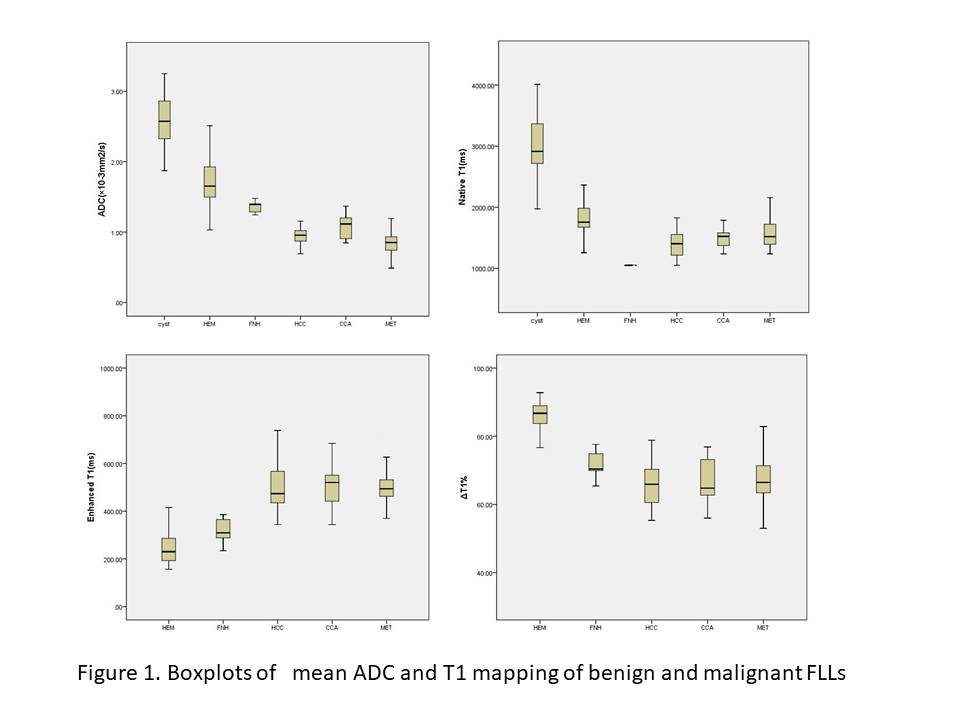
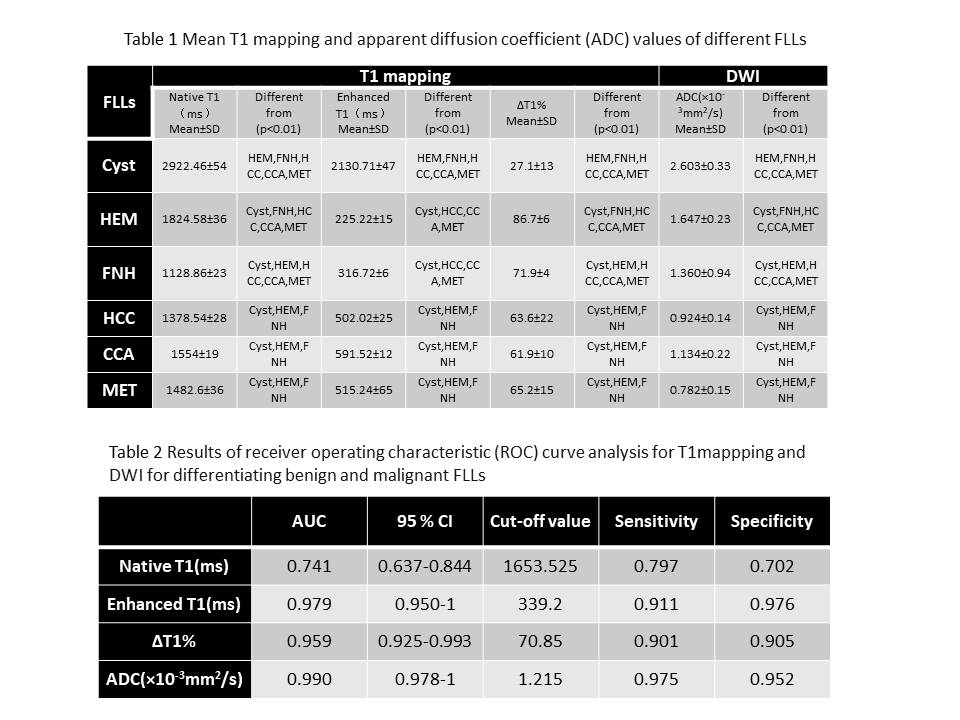
In 3T MRI,Native T1 value of benign and malignant FLLs was 2073.35±727ms vs 1487.29±361ms, Enhanced T1 value was 268.71±377ms vs 486.04±314ms, ΔT1% was (80.5±16)% vs (63.42±11)%, and ADC value was (2.133±0.55)×10-3mm2/s vs (0.903±0.28)×10-3mm2/s.When distinguishing between benign and malignant lesions, boundary value and AUC of Native T1 was 1653.525ms and 0.741, Enhanced T1 value was 339.2ms and 0.949, ΔT1% was 70.85% and 0.959, ADC value was 1.215×10⁻³mm2/s and 0.99. The sensitivity and specificity of those parameters for distinguishing benign and malignant FLLs were 0.797/0.702(Native T1), 0.911/0.976(Enhanced T1), 0.901/0.905(ΔT1%), 0.975/0.952(ADC), respectively. When diagnosing cysts and hemangioma, the best cut-off values of Native T1 value and ADC value are 2422.85ms (AUC 0.990, P<0.01) and 2.077×10⁻³mm2/s (AUC 0.949, P<0.01), respectively. The sensitivity and specificity of Native T1 and ADC were 0.963/1 and 0.852/0.892, respectively.
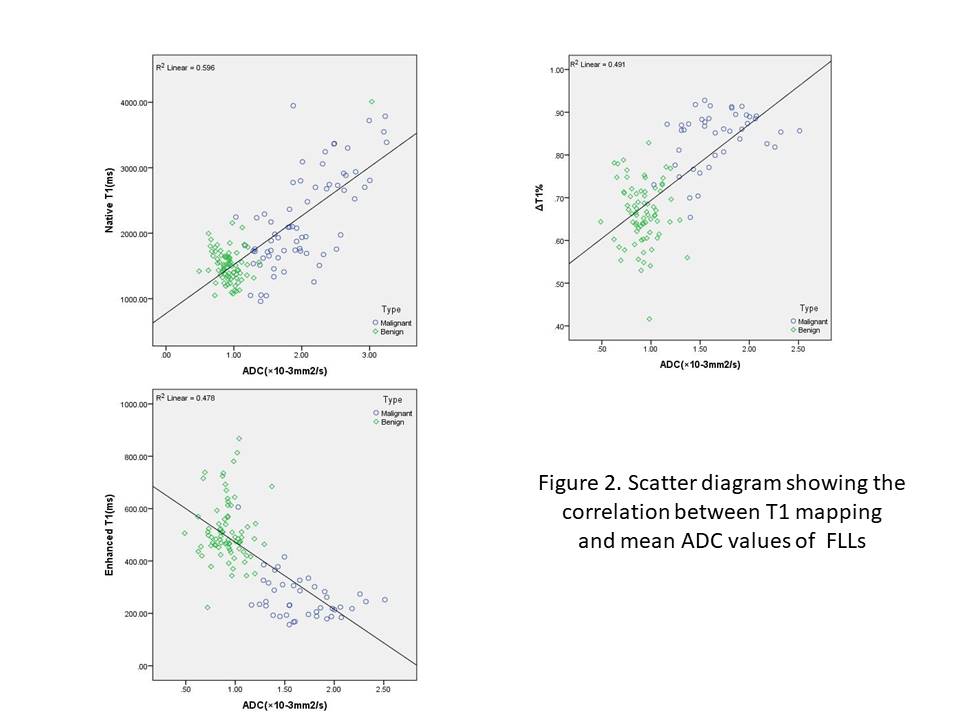
For the diagnosis of benign and malignant FLLs, there was a significant positive correlation between Native T1 value and ADC value (r=0.772, P<0.01), and a significant negative correlation between Enhanced T1 value and ADC value (r=0.691, P<0.01), there was a significant positive correlation between ΔT1% value and ADC value (r=0.632, P<0.01).
Discussion and Conclusion
Three-dimensional double flip angle T1 mapping is a reliable and accurate technique for diagnosing and evaluation benign and malignant FLLs. Enhanced T1 value and ΔT1% at the 2min equilibrium period after injection of Gd-DTPA have the similar diagnostic sensitivity and specificity to DWI. The Native T1 value was superior to DWI in the identification of liver cysts and hemangiomas.Acknowledgements
No acknowledgement found.References
1.Besa C, Bane O, Jajamovich G,et al.3D T1 relaxometry pre and post gadoxetic acid injection for the assessment of liver cirrhosis and liver function.Magn Reson Imaging.2015,33(9):1075-1082.
2.Peng Z, Li C, Chan T, et al.Quantitative evaluation of Gd-EOB-DTPA uptake in focal liver lesions by using T1 mapping: differences between hepatocellular carcinoma, hepatic focal nodular hyperplasia and cavernous hemangioma.Oncotarget. 2017,8(39):65435-65444.
3.Yoshimura N, Saito K, Saguchi T, et al.Distinguishing hepatic hemangiomas from metastatic tumors using T1 mapping on gadoxetic-acid-enhanced MRI.Magn Reson Imaging.2013,31(1):23-27.
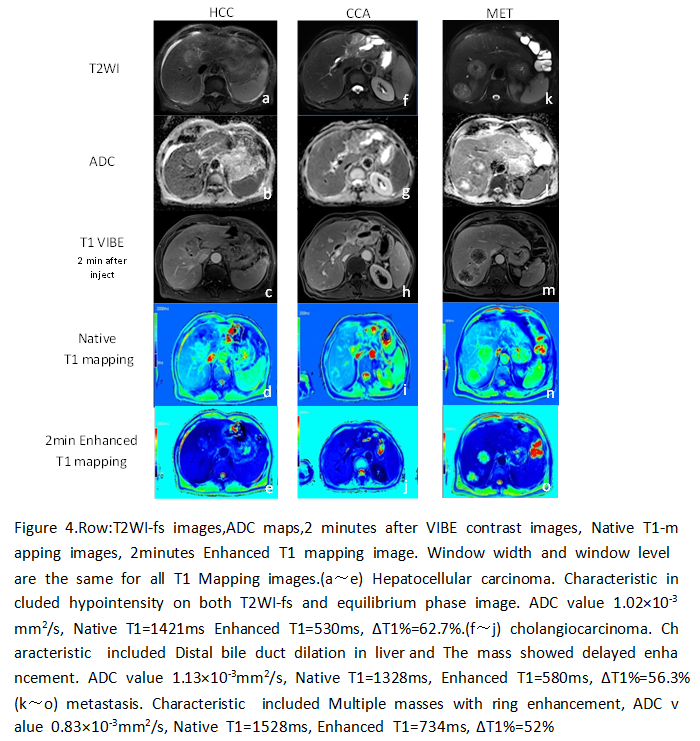
Figures