2111
Dynamic contrast enhanced imaging (DCE-MRI) combined with T1 and T2 mapping for differentiation between HCC and HM1The First Affiliated Hospital of Dalian Medical University, Dalian, China, 2Philips Healthcare, Beijing, China
Synopsis
Liver cancer and liver metastases are the most common liver malignancies. The accurate diagnosis of hepatocellular carcinoma (HCC) and hepatic metastasis (HM) is of great significance to the choice of treatment options. We aimed to explore the value of dynamic contrast enhanced magnetic resonance imaging (DCE-MRI) combined with T1 and T2 mapping to distinguish HCC from HM. Results showed that DCE combined with T1 and T2 mapping had the highest efficacy (AUC: 0.936; sensitivity: 81.8%; specificity: 100%).
Summary of Main Findings
Dynamic contrast enhanced imaging (DCE-MRI) combined with T1 and T2 mapping showed a high efficacy to distinguish hepatocellular carcinoma (HCC) from hepatic metastasis (HM) (AUC: 0.936; sensitivity: 81.8%; specificity: 100%).Introduction
Hepatocellular carcinoma (HCC) from hepatic metastasis (HM) are the most common liver malignancies. The accurate diagnosis of HCC and HM is of great significance to the choice of treatment options [1]. Routine diagnosis of HCC and HM is based on their imaging manifestations on conventional contrast enhanced examination, and the accuracy is relatively low [2]. Quantitative analysis of dynamic contrast enhanced imaging (DCE-MRI) through the introduction of a pharmacokinetic model to mathematically fit the concentration-time curve of the contrast agent, and calculate multiple reflections of tissue perfusion (including Ktrans, Kep, Ve, Vp), which can more comprehensively evaluate the microcirculation characteristics of lesions [3]. Peng et al. [4] used T1 mapping to evaluate the HCC grading and found that the difference of T1 and the decrement rate of T1 in enhanced hepatobiliary tumors could identify different grades In HCC. They found that the reduction rate of T1 was moderately correlated with HCC grading. This study aims to explore the value of DCE combined with T1 and T2 mapping in differential diagnosis between HCC and HM.Materials and Methods
This research has been approved by the local IRB. We retrospectively analyzed 17 patients with liver cancer in our hospital, including 6 patients with 10 HMs (3 men; mean age, 56 years; range, 49-66 years) and 11 HCCs (8 men; mean age, 61 years; range, 54-76 years). All patients were scanned using a 3.0 T MR scanner (Ingenia CX, Philips Healthcare, the Netherlands) with a seven-channel bilateral phase-array abdominal coil. MR sequences included T2 weighted imaging, DCE-MRI, T1 and T2 mapping. The detailed scanning parameters were shown in Table 1. The DCE-MRI and T1&T2 mapping data were transferred to the workstation (Intellispace Portal v10.1; Philips Healthcare) for post-processing. Referring to the anatomical position of the lesion obtained on the T2w image, the region of interest (ROI, 100-200 mm2) was manually placed on the largest lesion on the DCE functional maps, T1 and T2 mapping images. The DCE-MRI parameters (Ktrans, Kep, Ve, and Vp), T1 and T2 values of the two groups were recorded, and the Mann-Whitney U test was used for comparison. The ROC curve of the above parameters was used to analyze the diagnostic efficiency between HCC and HM. Logistic regression was used to calculate the DCE combined with T1 and T2 values to identify HM and HCC. Delong’s test was used to compare AUCs between the DCE, T1 and T2 mapping, and their combination.Results
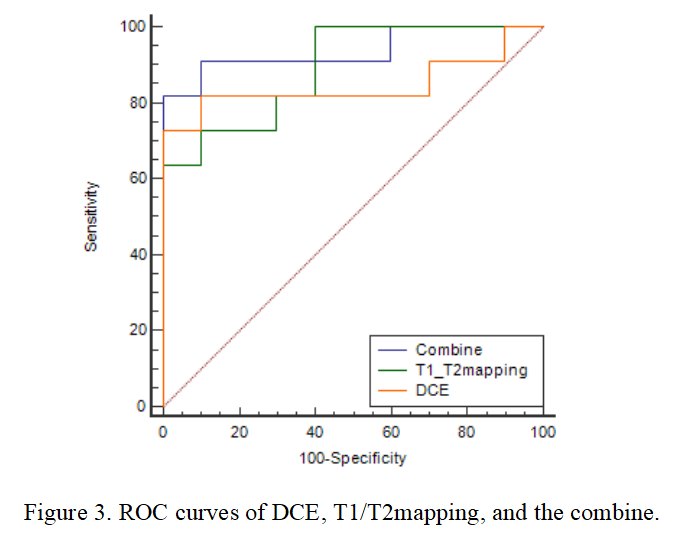
Table 2 shows the comparison of Ktrans, Kep, Ve, Vp, T1, and T2 values between HM and HCC. T1 and T2 values of HM were higher than those of HCC, while the Ktrans, Kep, and Vp values of HM were lower than those of HCC (all P < 0.05). The area under the ROC curves (AUCs) of Ktrans, Kep, Vp, T1, and T2 were 0.836, 0.809, 0.764, 0.873, and 0.855 for distinguishing HM and HCC, respectively (Table 3). The sensitivity of the above parameters with feasible thresholds were 81.8%, 54.5%, 100%, 63.6%, and 81.8%, the corresponding specificity were 100%, 100%, 60%, 100%, and 90% (Table 3). Combining T1 and T2 mapping with DCE parameters for the diagnosis of HM and HCC, we found that the diagnostic efficacy was significantly improved (AUC = 0.936, sensitivity = 81.8%, and specificity = 100%, Table 4 and Figure 3).Discussion and Conclusion
Jajamovich GH et al. [5] has shown that DCE-MRI adopts thin-slice non-interval scanning, which can effectively detect small lesions in the liver. The continuous acquisition of DCE-MRI in the liver volume enables reconstruction of liver parenchymal and blood vessel images. Results of this study show that combination of DCE-MRI with T1 and T2 mapping can achieve significantly improved accuracy in differential diagnosis of HM and HCC, which may benefits clinical diagnosis of liver cancer.Acknowledgements
No acknowledgement found.References
[1] AUBE,CHRISTOPHE, OBERT, et al. EASL and AASLD recommendations for the diagnosis of HCC to the test of daily practice. Liver International, 2017,37(10):1515-1525.
[2] Li Z, Yu M, Wei H, et al. Texture-based classification of different single liver lesion based on SPAIR T2W MRI images. BMC Med Imag, 2017,17(1):42-44.
[3] Bang-Bin Chen, Tiffany Ting-Fang Shih. DCE-MRI in hepatocellular carcinoma-clinical and therapeutic image biomarker. World Journal of Gastroenterology, 2014,20(12):3125-3134.
[4] Peng Z, Jiang M, Cai H, et al. Gd-EOB-DTPA- enhanced magnetic resonance imaging combined with T1 mapping predicts the degree of differentiation in hepatocellular carcinoma. BMC Cancer, 2016,16:625 12885-016-2607-4.
[5] Jajamovich G H, Dyvorne H, Donnerhack C, e t al. Quantitative Liver MRI Combining Phase Contrast Imaging, Elastography, and DWI: Assessment of Reproducibility and Postprandial Effect at 3.0T. Plos One, 2014, 9 (5): e97355.
Figures
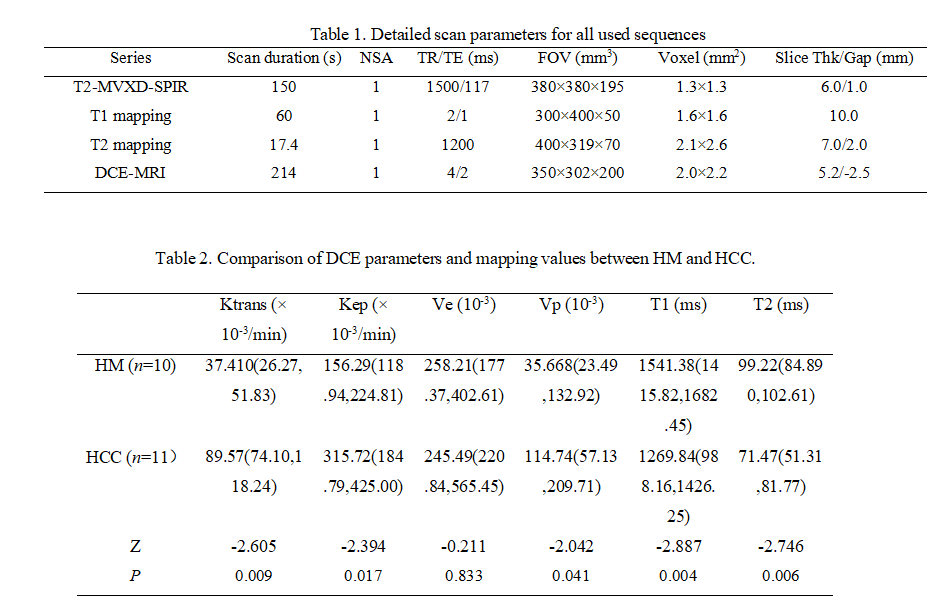
Table 1. Detailed scan parameters for all used sequences
Table 2. Comparison of DCE parameters and mapping values between HM and HCC.
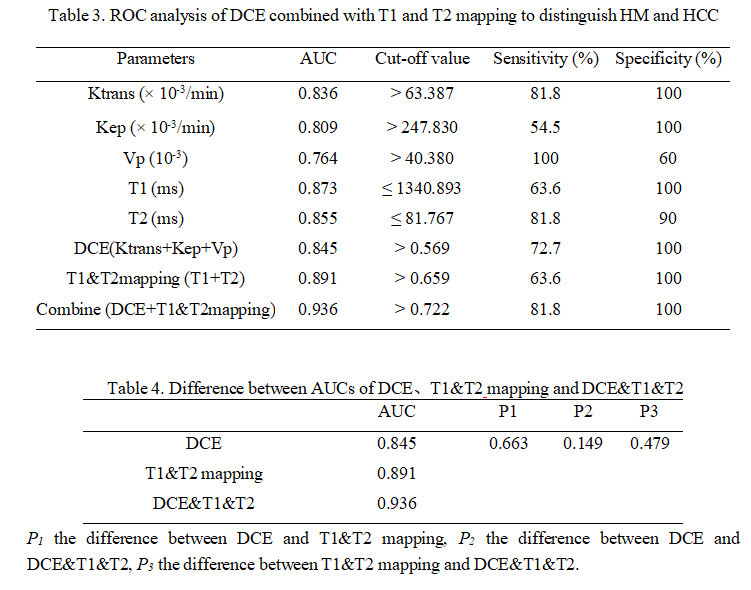
Table 3. ROC analysis of DCE combined with T1 and T2 mapping to distinguish HM and HCC
Table 4. Difference between AUCs of DCE、T1&T2 mapping and DCE&T1&T2
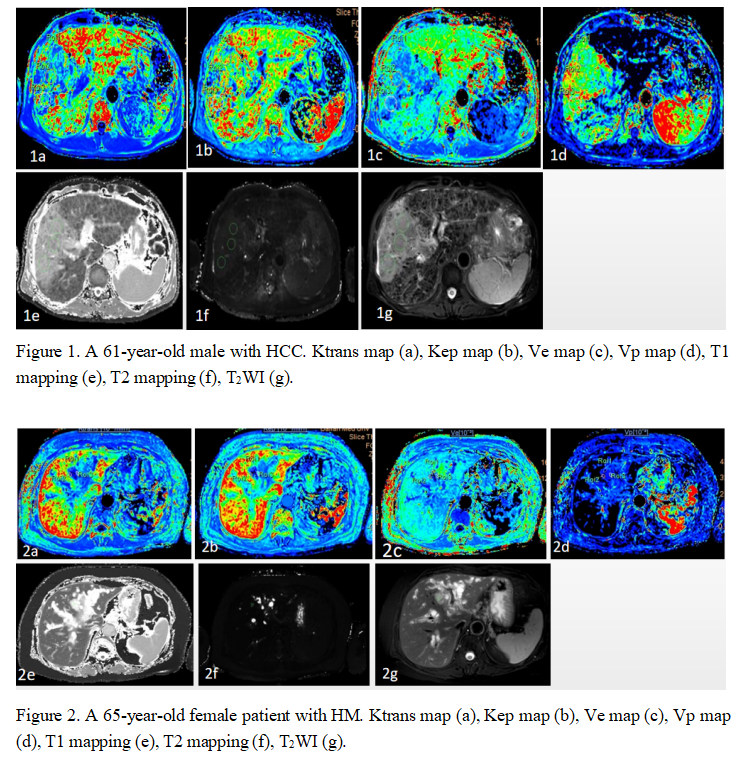
Figure 1. A 61-year-old male with HCC. Ktrans map (a), Kep map (b), Ve map (c), Vp map (d), T1 mapping (e), T2 mapping (f), T2WI (g).
Figure 2. A 65-year-old female patient with HM. Ktrans map (a), Kep map (b), Ve map (c), Vp map (d), T1 mapping (e), T2 mapping (f), T2WI (g).