2110
Correlation of functional MRI with changes in tumor microenvironment following sorafenib and immunotherapy in hepatocellular carcinoma1Department of Radiology, Union Hospital, Tongji Medical College, Huazhong University of Science and Technology, Wuhan 430022, China, Wuhan, China, 2Wuhan National Laboratory for Optoelectronics, Huazhong University of Science and Technology, Wuhan, 430074, China., Wuhan, China, 3State Key Laboratory of Magnetic Resonance and Atomic and Molecular Physics, Wuhan Institute of Physics and Mathmatics, Innovation Academy for Precision Measurement Science and Technology, 430071Wuhan, China, Wuhan, China
Synopsis
Molecular and pathological characteristics of the tumor microenvironment have been shown to cause tumor heterogeneity and variability in therapeutic responses. We used functional MRI to evaluate the changes in tumor microenvironment after treatment with sorafenib and anti-PD-L1 antibody for hepatocellular carcinoma (HCC). The results indicated that DWI-MRI and MRS could dynamically assess microenvironmental changes including tumor necrosis and tumor hypoxia. The findings of this study are conducive to the establishment of an accurate correlation between imaging features-microenvironment characteristics-tumor anti-vascular treatment and immunotherapy, and the realization of scientific and precise individualized treatment of HCC.
Synopsis
Molecular and pathological characteristics of the tumor microenvironment have been shown to cause tumor heterogeneity and variability in therapeutic responses. We used functional MRI to evaluate the changes in tumor microenvironment after treatment with sorafenib and anti-PD-L1 antibody for hepatocellular carcinoma (HCC). The results indicated that DWI-MRI and MRS could dynamically assess microenvironmental changes including tumor necrosis and tumor hypoxia. The findings of this study are conducive to the establishment of an accurate correlation between imaging features-microenvironment characteristics-tumor anti-vascular treatment and immunotherapy, and the realization of scientific and precise individualized treatment of HCC.INTRODUCTION
Lack of durable response in majority of advanced hepatocellular carcinoma (HCC) patients necessitates the exploration to broaden the benefit of sorafenib monotherapy.1 Since immunotherapy can modulate the tumor immunosuppressive microenvironment,2 which contributes to resistance to sorafenib treatment, we hypothesized rationally combining PD-1/PD-L1 blockade with sorafenib could enhance therapeutic efficacy. Previously, few studies have focused on the dynamic monitoring of the tumor microenvironment changes during anti-vascular therapy and immunotherapy.3 Here, we used serial multimodal structural and functional magnetic resonance imaging (MRI) dynamic early assessment of tumor microenvironmental changes in HCC after treatment with sorafenib and anti-PD-L1 antibody and elucidate the synergistic mechanism.METHODS
Subcutaneous syngeneic HCC tumors were established in the right flanks of C57/BL6 mice. Mice were longitudinally scanned using T1/T2-weighted MRI, diffusion-weighted (DW) MRI, and magnetic resonance spectroscopy (MRS) 1 day before and on days 7, 14 and 21 after treatment initiation to determine tumor size, necrosis area, apparent diffusion coefficient (ADC) value, and tumor metabolites including lactate. At indicated days later, the tumor-bearing mice were euthanized, and tumor tissues were harvested for further analysis including western blotting and qPCR array, immunohistochemistry, and immunofluorescence. Tumor hypoxia and tumor necrosis area were analyzed to validate the tumor microenvironment demonstrated by multimodal structural and functional MRI. Meanwhile, in vitro studies were conducted to further corroborate the results of in vivo studies.RESULTS & DISCUSSION
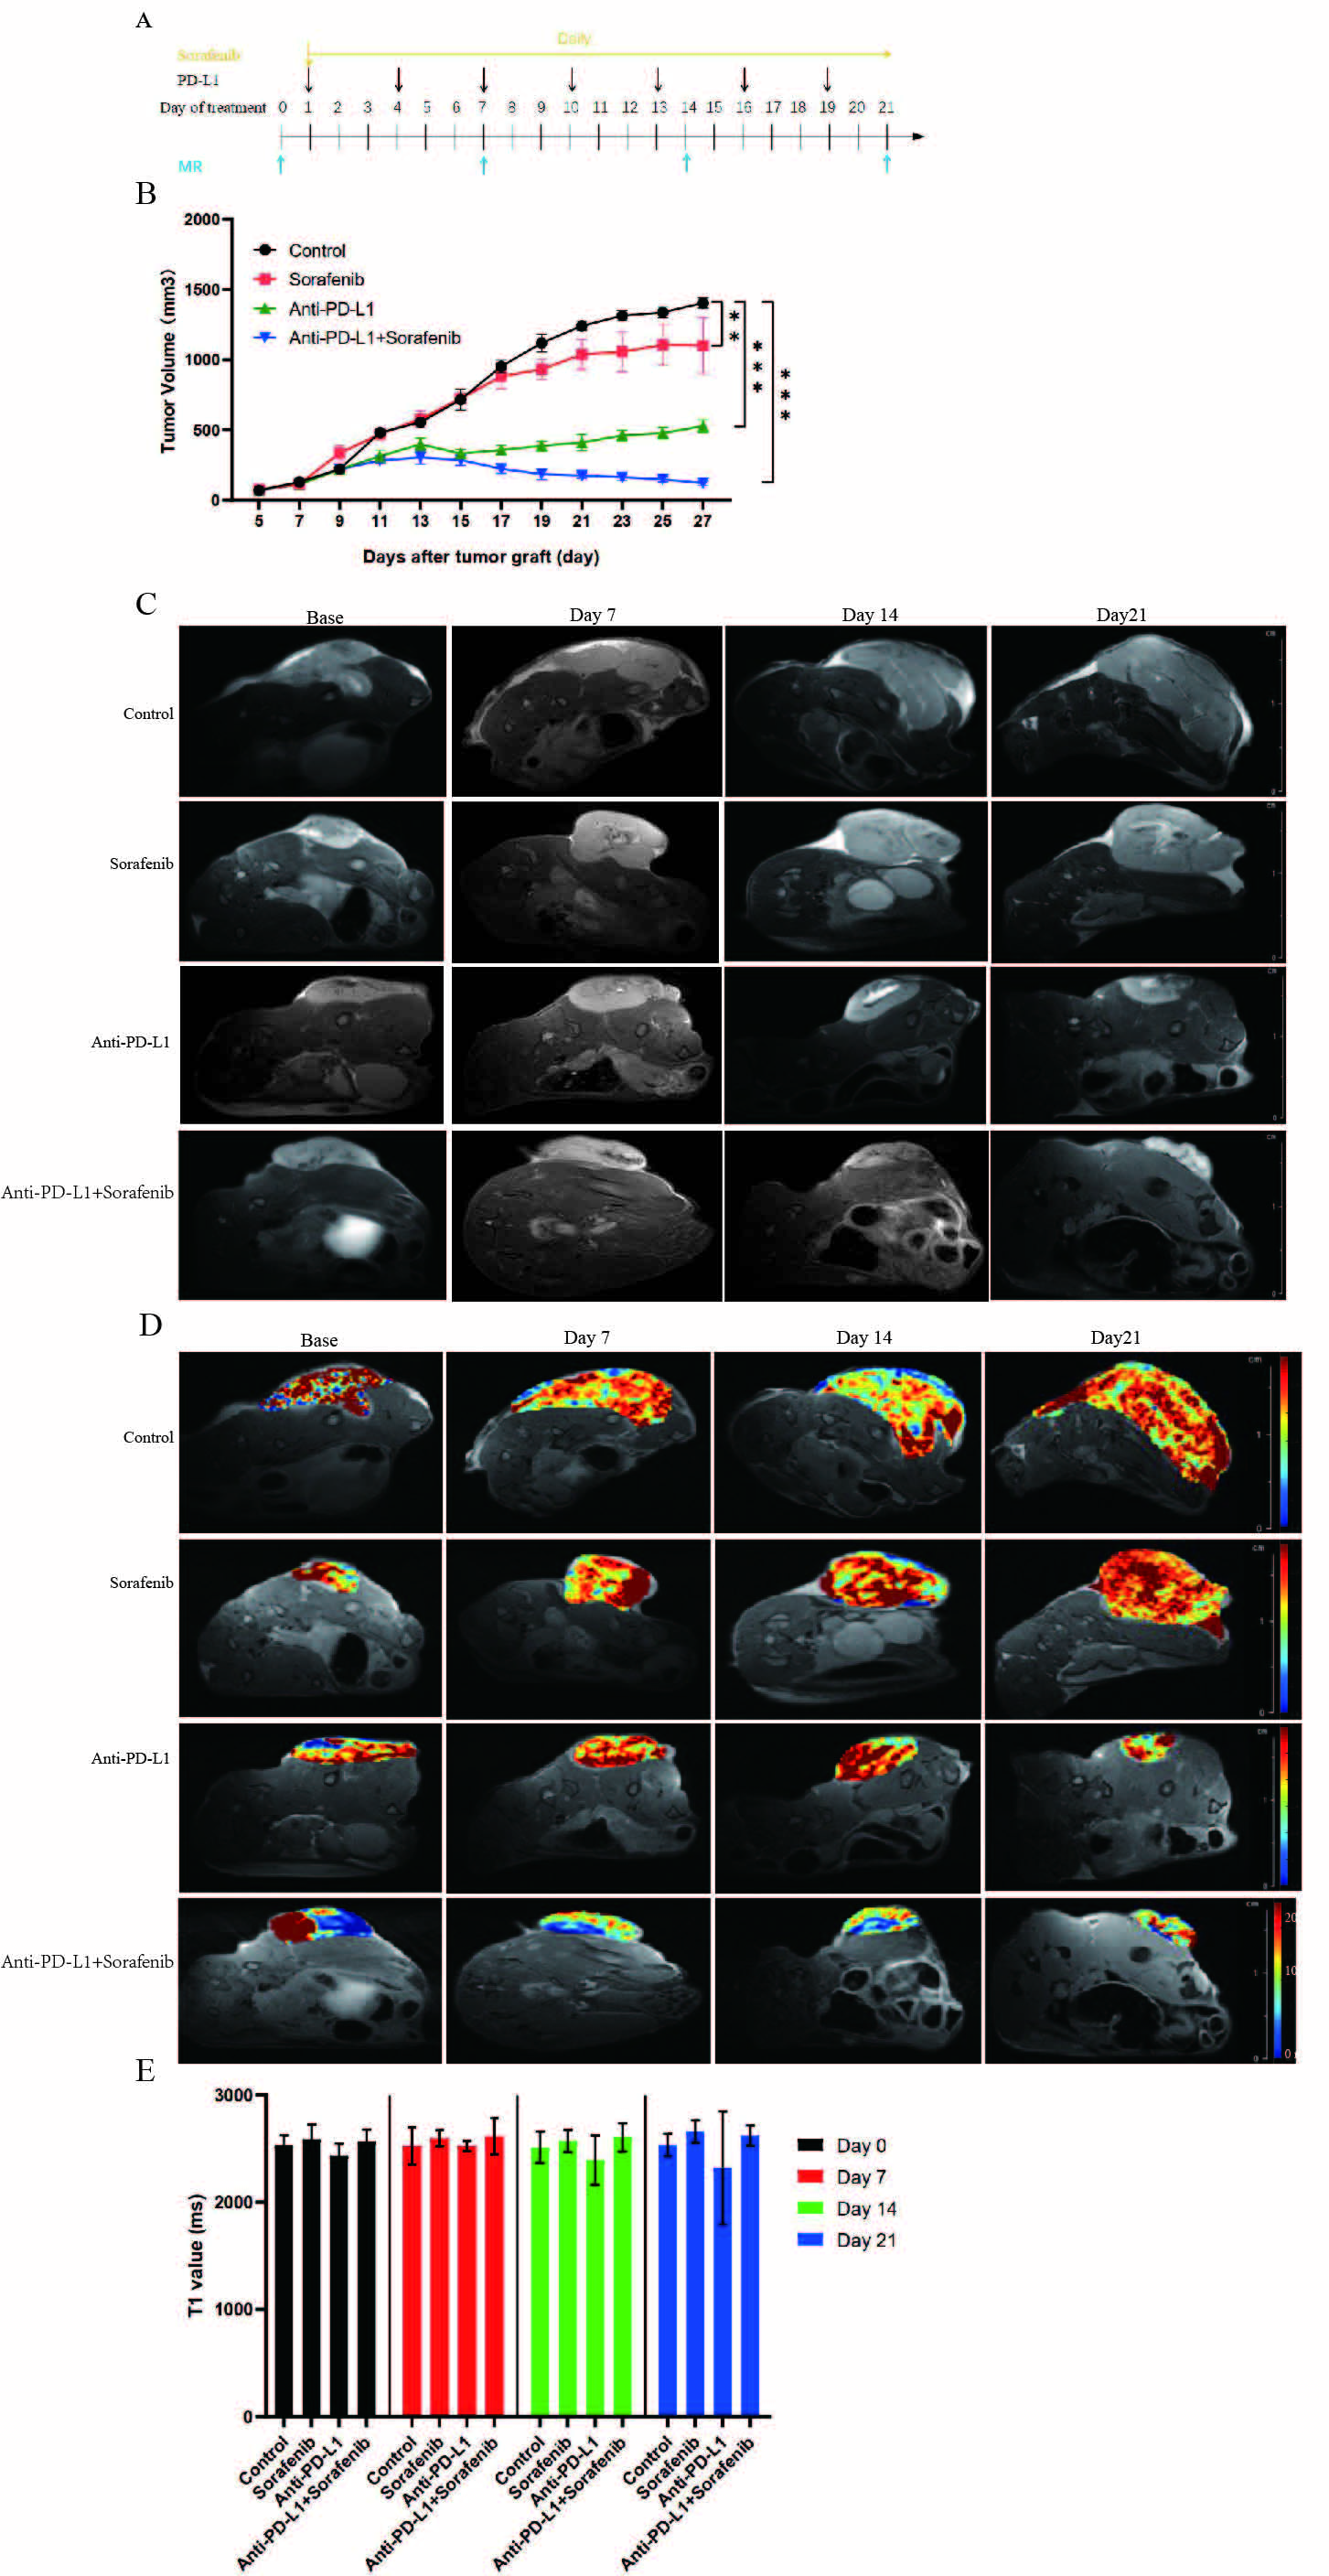
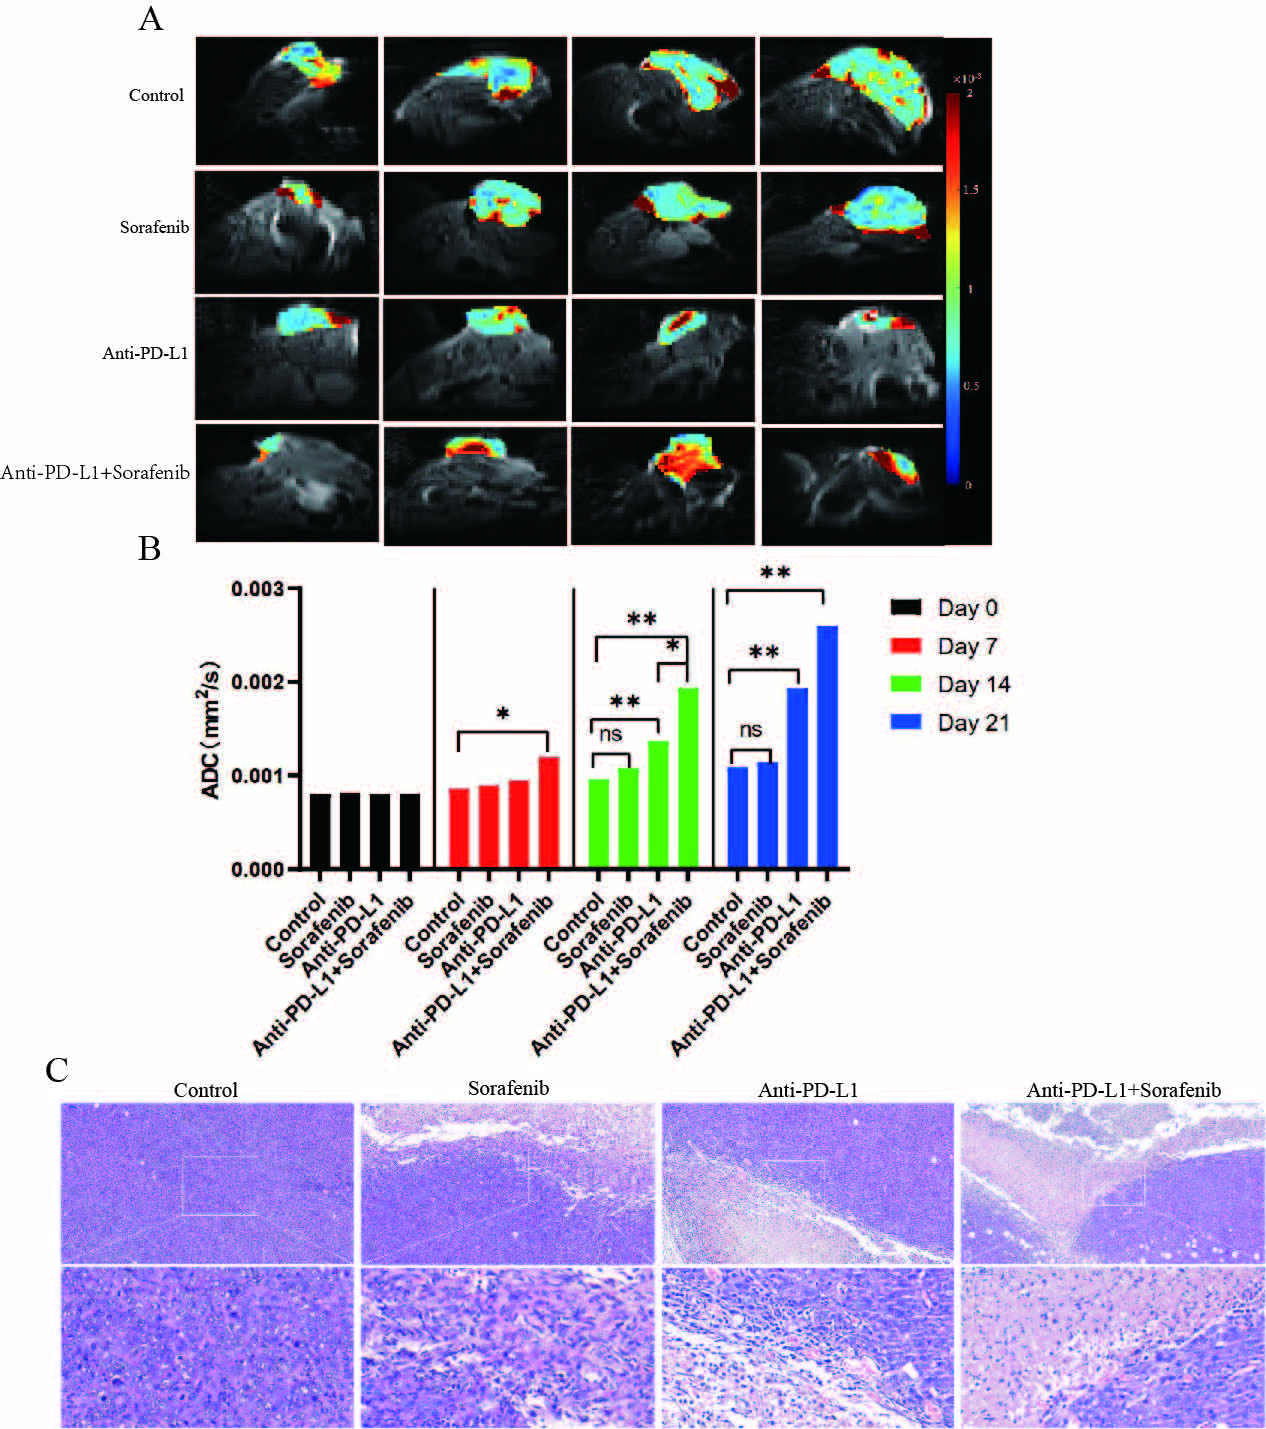
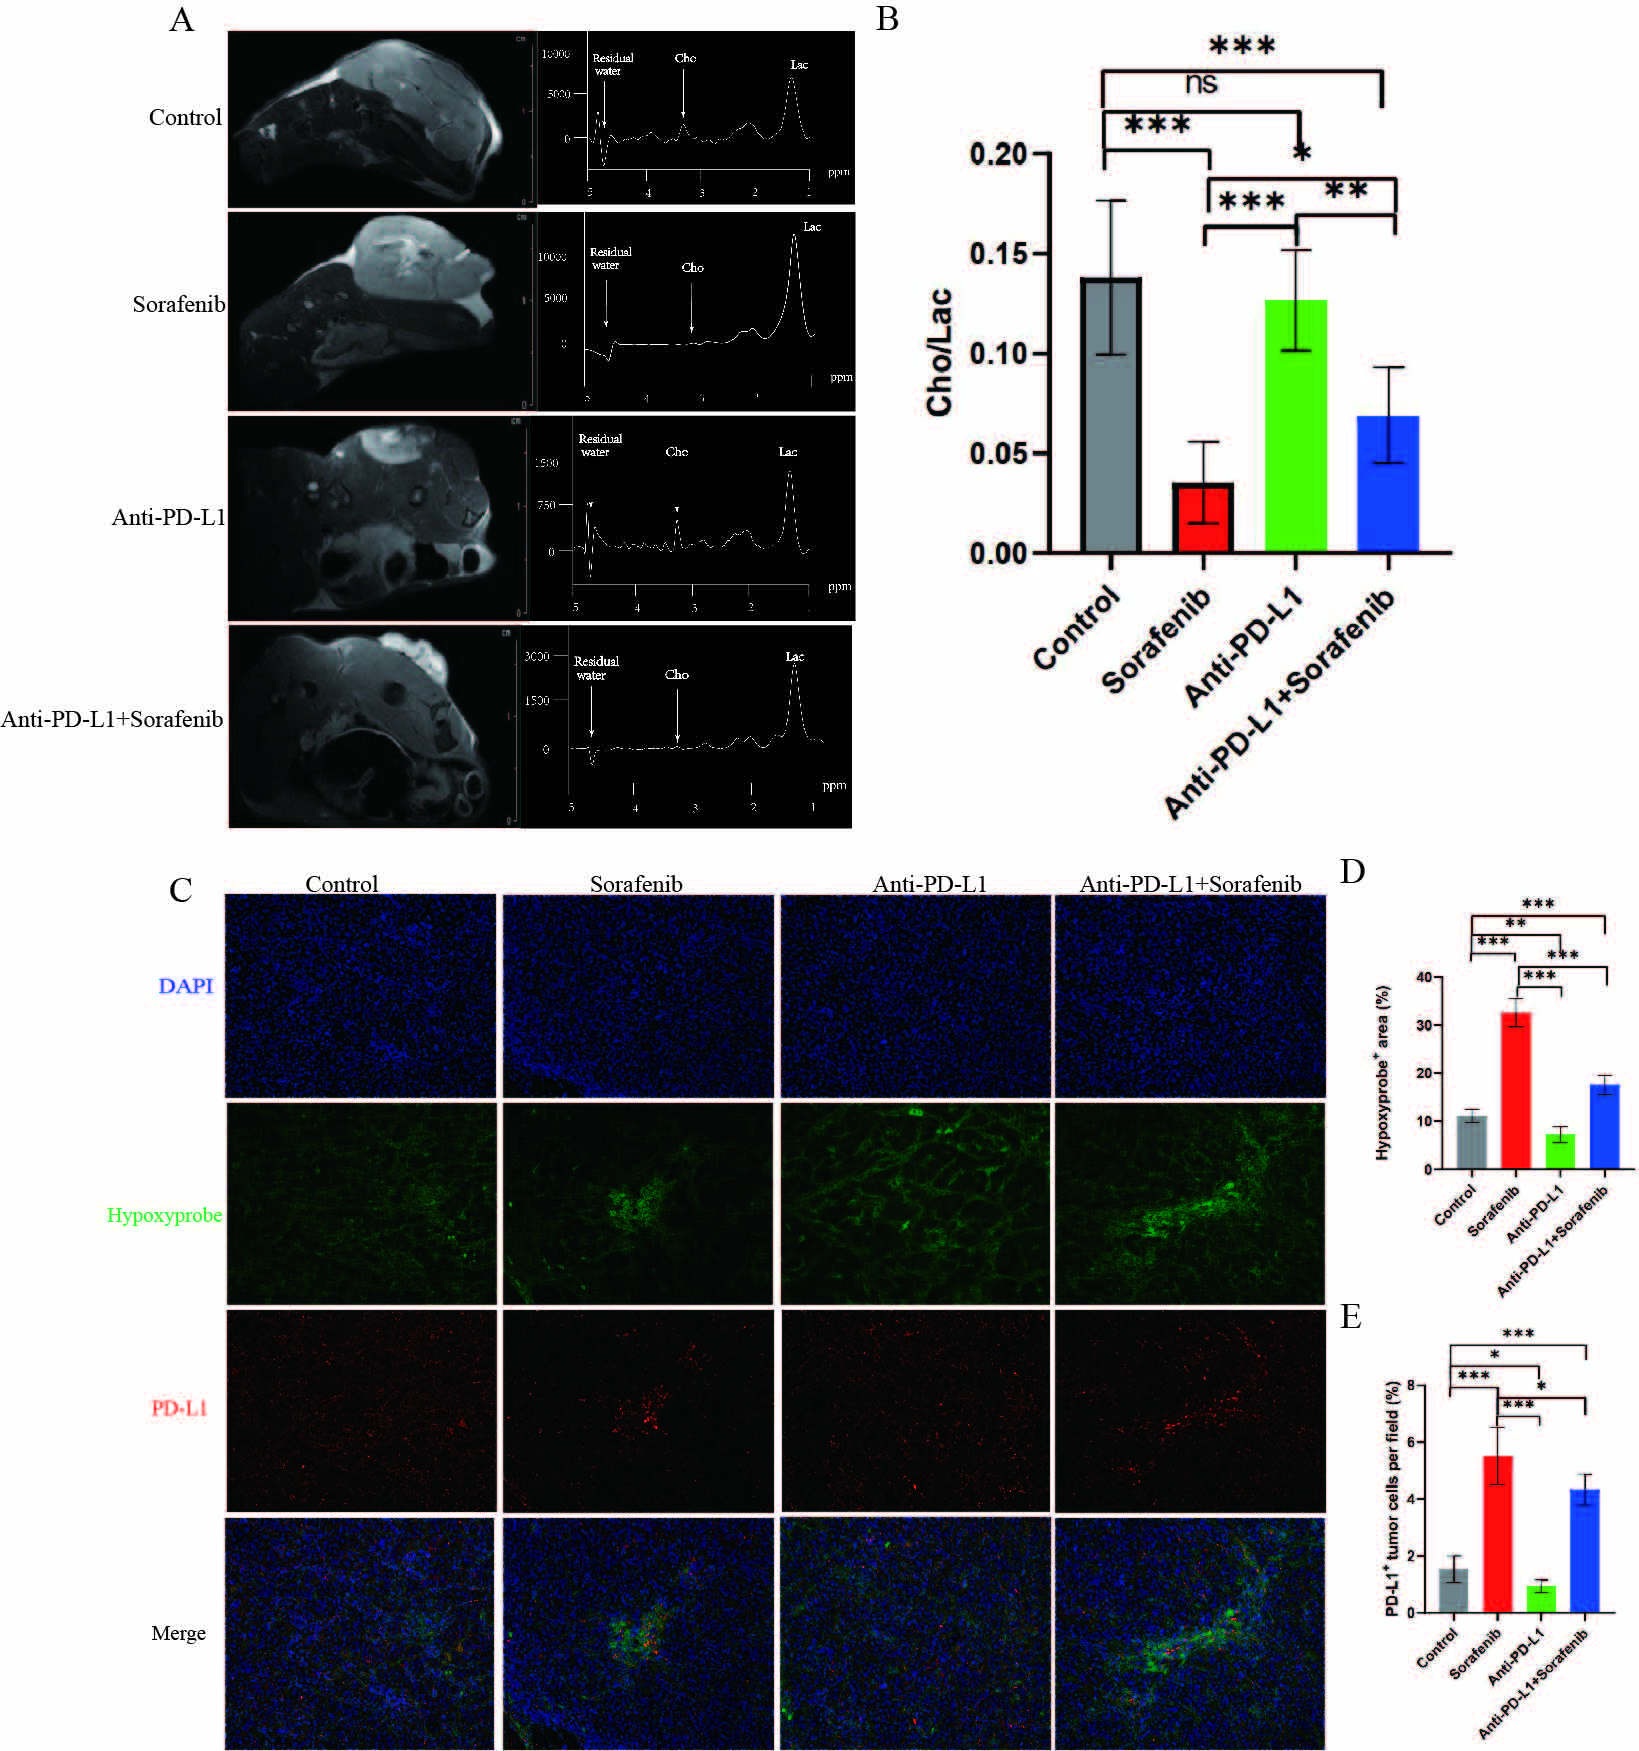
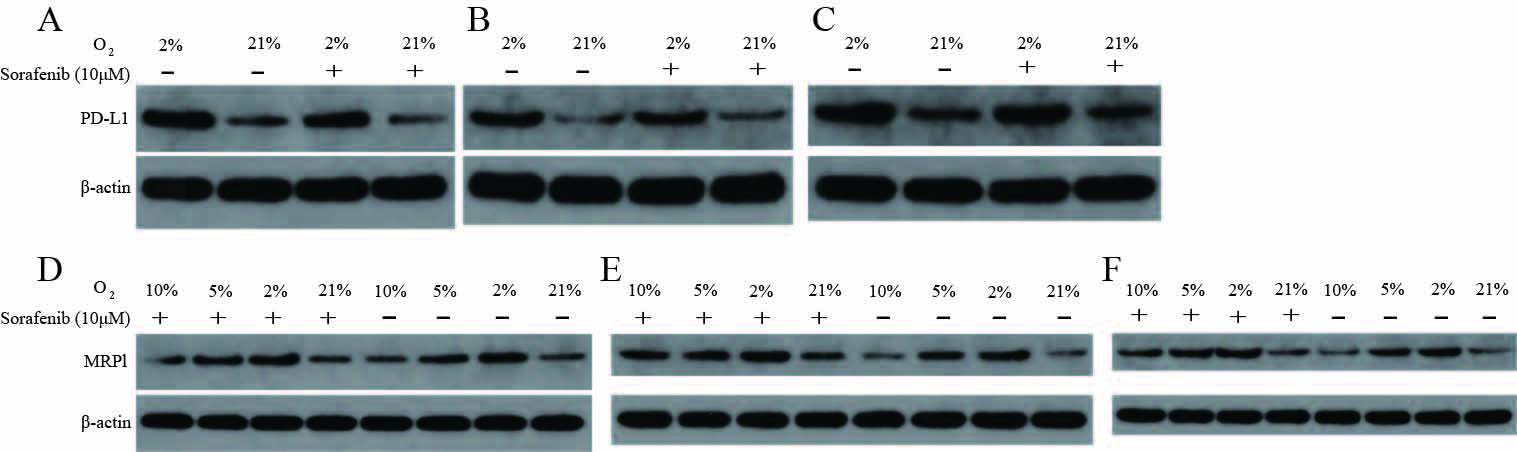
We treated 6-week-old C57/BL6 mice with subcutaneous tumor volume of about 80-120mm3 with daily sorafenib (50mg/kg) gavage or intraperitoneal injection of anti-PD-L1 antibody (10mg/kg) every 3 days, and control mice with intraperitoneal injection of isotype-matched IgG antibody (10mg/kg) every 3 days (Fig. 1A). Compared to sorafenib or anti-PD-L1 antibody, combination therapy of sorafenib and anti-PD-L1 antibody markedly retarded tumor growth (Fig. 1, B-C) increased tumor necrosis area, and led to increases in ADC value (Fig. 2, A-C). However, T1 mapping showed no significant difference in T1 values between the four groups at different time points (Fig. 1, D-E). Excessive pruning of tumor vessels by sorafenib resulted in increased tumor hypoxia in the tumor microenvironment, and MRS showed an enhancement of lactate levels (Fig. 3, A-D). Hypoxia causes drug resistance and high expression of PD-L1 in tumor cells, leading to immunosuppressive microenvironment (Fig.3, C and E). In vitro cell studies indicated that PD-L1 expression increased in HepG2 (Fig.4A), Hep3 (Fig.4B), and Hepa 1-6 cells (Fig.4C) under hypoxia, and the expression of PD-L1 was still higher after sorafenib was added. In addition, after the addition of sorafenib to the culture medium, the expression of multidrug resistance-associated protein 1 (MRPl) was increased compared with that under normal oxygen condition (Fig. 4, D-F).CONCLUSION
Anti-PD-L1 antibody can "normalize" tumor vessels to reduce the hypoxia caused by sorafenib, thus improving hypoxia-related sorafenib resistance and enhancing the therapeutic effect of HCC. DWI can indirectly reflect the degree of tumor necrosis and MRS is useful for predicting tumor hypoxia after anti-vascular therapy and immunotherapy. Hence, these imaging methods serve as a unique and non-invasive MRI biomarker for the early dynamic evaluation of tumor microenvironment changes after anti-vascular treatment and immunotherapy for HCC.Acknowledgements
We gratefully acknowledge the financial support by National Major Scientific Research Equipment Development Project of China (81627901), the National key of R&D Program of China (Grant 2018YFC0115000, 2016YFC1304702), National Natural Science Foundation of China (11575287, 11705274), and the Chinese Academy of Sciences (YZ201677).References
1. Llovet JM, Montal R, Sia D, Finn RS. Molecular therapies and precision medicine for hepatocellular carcinoma. Nat Rev Clin Oncol. 2018; 15(10): 599-616.
2. Prieto J, Melero I, Sangro B. Immunological landscape and immunotherapy of hepatocellular carcinoma. Nat Rev Gastroenterol Hepatol. 2015; 12(12): 681-700.
3. Liang J, Cheng Q, Huang J, et al. Monitoring tumour microenvironment changes during anti-angiogenesis therapy using functional MRI. Angiogenesis. 2019; 22(3): 457-470.
Figures