2108
MR Elastography-based Shear Strain Mapping for Assessment of Microvascular Invasion in Hepatocellular Carcinoma1Radiology, The Third Affiliated Hospital of Sun Yat-Sen University, Guangzhou, China, 2Radiology, Mayo Clinic, Rochester, MN, United States
Synopsis
The presence of microvascular invastion (MVI) at histopathology is an important predictive factor in managing hepatocellular carcinoma (HCC). We evaluated the potential of MRE-based shear strain mapping to assess adhesion characteristics at tumor boundaries and to non-invasively predict the presence of MVI. We retrospectively calculated maps displaying octahedral shear strain in exams of 61 HCC patients who underwent 3D multi-frequency MRE examinations. Results demonstrated that the prevalence of adherent tumor-liver parenchyma interface in positive MVI groups was significantly higher than negative groups. The results provide evidence that MRE-based shear strain mapping is helpful for non-invasive prediction of MVI in HCC.
Introduction
Microvascular invasion (MVI) is an important predictive factor for recurrence and prognosis in patients with hepatocellular carcinoma (HCC) after surgery 1-4. Preoperative prediction of MVI is essential for the patients to choose the optimal clinical treatment. Development of a reliable alternative to biopsy for making this determination would have considerable clinical value. Magnetic resonance elastography (MRE) has been established as a technique with high diagnostic performance in detecting and staging liver fibrosis and has an emerging role in assessing focal malignancy 5-12. Recently, an MRE-based technique that has been called “slip interface imaging” (SII) has used shear strain mapping to quantify the degree of tumor–peritumoral tissue adhesion noninvasively in brain imaging 13-14. We hypothesized that MRE-based shear strain mapping might also be used to characterize the tumor-liver interface in HCC and perhaps predict the presence or absence of MVI non-invasively.Methods
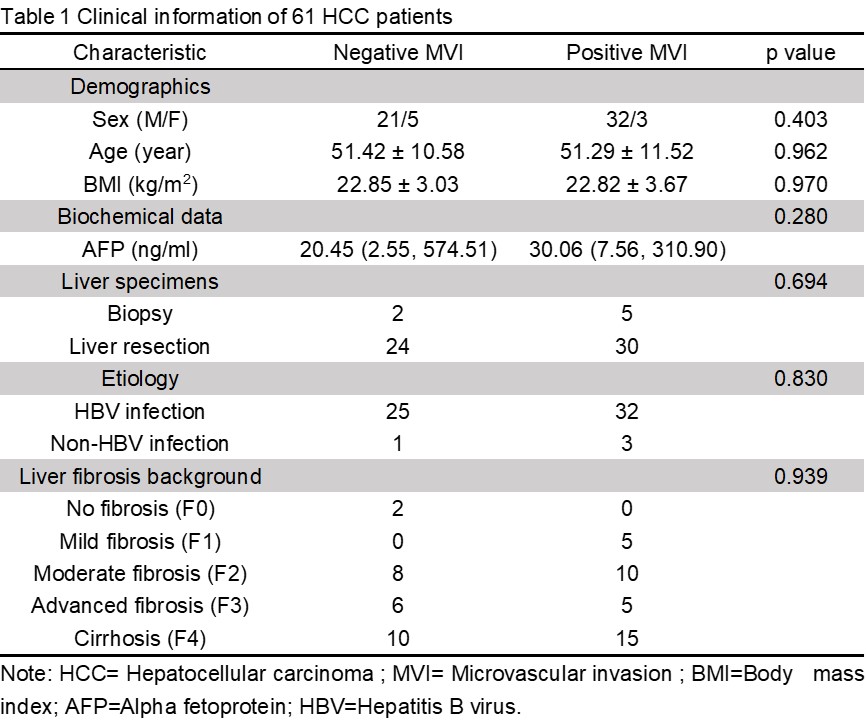
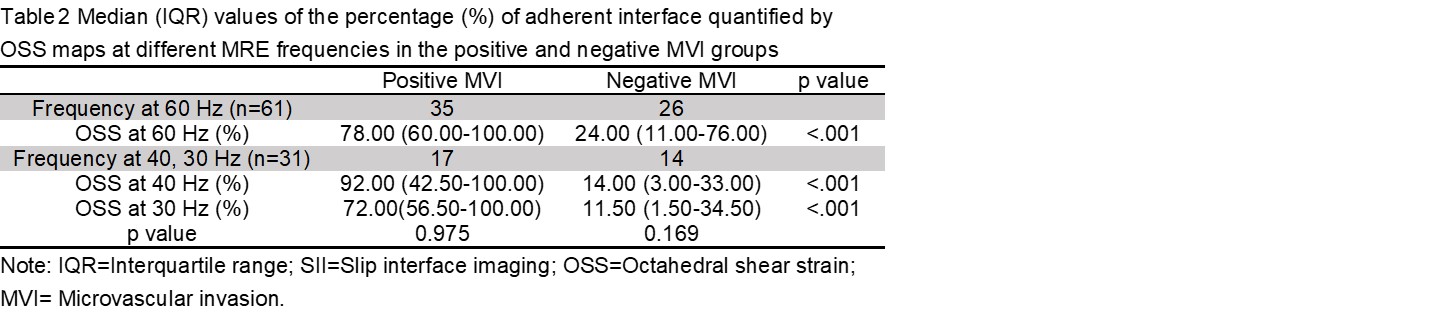
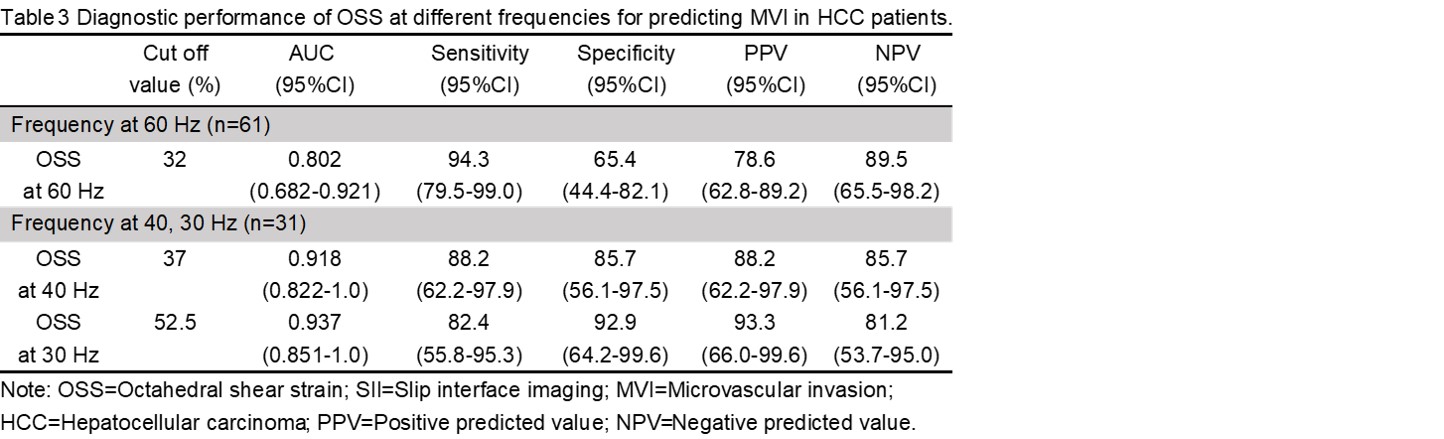
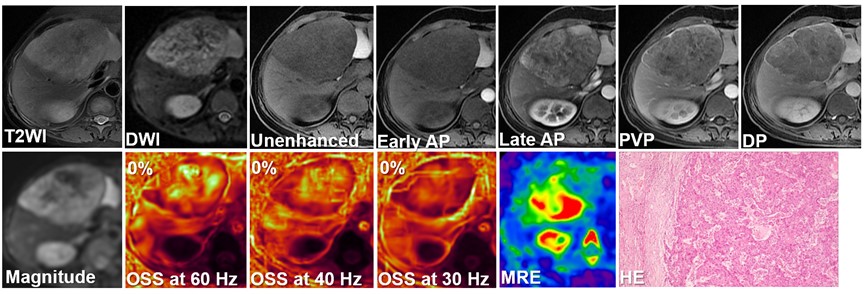
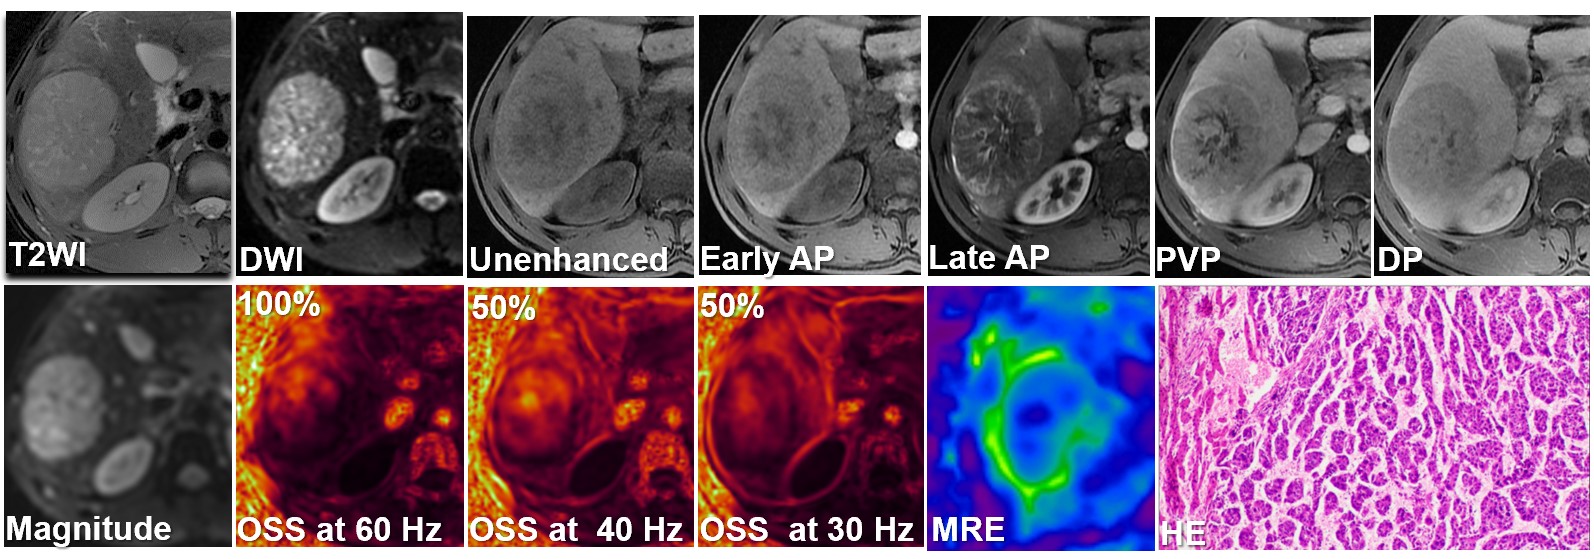
This retrospective study was approved by our institutional review board, with a waiver of the informed consent requirement. We included all consecutive patients of our hospital who had liver MRI examinations between December 2016 and October 2019. Patients were included if they (a) underwent 3D MRE examination and (b) underwent histopathology proven HCC within one month of MRE scanning. A total of 78 patients were initially eligible for the study. The exclusion criteria were as follows: (a) failed or inadequate MRE scan (n=14) and (b) tumor was too small (≤ 2cm) (n=3). Ultimately, 61 patients with 60 Hz MRE examination (positive MVI, n=35; negative MVI, n=26), including 31 patients who also underwent 40 and 30 Hz MRE examinations (positive MVI, n=17; negative MVI, n=14) were enrolled. Patient basic characteristics were retrospectively collected from the PACS system. 3D MRE scan was performed with a spin echo echo-planar imaging (SE-EPI) sequence (with 32 slices and three orthogonal motion-encoding directions covering the center of the liver), using a 3T clinical scanner (Discovery MR750, GE Healthcare, Milwaukee, WI) with an 8-element torso-phased array coil. The 3D MRE raw data were processed and maps of octahedral shear strain (OSS) were calculated as described in previous publications 13-14. The degree of tumor-liver parenchyma adhesion in the OSS map was recorded as the percentage (%) of adherent interface taking up the entire tumor boundary. All images were analyzed with a consensus from a physicist who developed SII and an experienced abdominal radiologist with a visual inspection. MVI was defined at histopathology as a tumor within a vascular space lined by the endothelium visible only using microscopy. All specimens were analyzed by a pathologist with 10 years of experience in liver pathology. Differences between positive MVI and negative MVI groups were analyzed using a Kruskal-Wallis test, chi-square test or independent-sample T-test when appropriate. Receiver operating characteristic (ROC) curve analyses were performed to assess the diagnostic performance of OSS at different frequencies. A p-value less than 0.05 was considered statistically significant.Results
The clinical infromation about the enrolled patients is summarized in Table 1. There were no differences between the MVI groups for these basic characteristics. The data for the adherent interface percentage at the different MRE frequencies for the positive and negative MVI groups are shown in Table 2. The percentage of adherent interface in the positive MVI group at the three frequencies were significantly higher than in the negative MVI groups (60 Hz, 78% vs. 24%; 40 Hz, 92% vs. 14%; 30 Hz, 72% vs. 11.5%; all p<0.001). There was no statistical difference in the adherent interface percentage among the three frequencies groups, neither in the positive or negative MVI groups (all p>0.05). Representative cases are shown in Figures 1 and 2. According to Table 3, the diagnostic performance of OSS for predicting MVI was excellent at 60 Hz (cutoff: 32%; AUC: 0.802; Sensitivity: 94.3%; Specificity: 65.4%), 40 Hz (cutoff: 37%; AUC: 0.918; Sensitivity: 88.2%; Specificity: 85.7%) and 30 Hz (cutoff: 52.5%; AUC: 0.937; Sensitivity: 82.4%; Specificity: 92.9%). As the frequency decreased, the specificity of OSS increased and the sensitivity decreased.Discussion
The results indicate that MRE-based shear strain mapping is a promising biomarker for predicting MVI before surgery. We speculate that the tumors that exhibit characteristics of high adherence at their margins are more likely to have tumor cells infiltrating liver tissue beyond the gross tumor boundaries. The differences in diagnostic performance of shear strain mapping with frequency may be due to the effects of wave attenuation at higher frequencies, providing less observable shear strain.In this study, shear strain mapping at 30 Hz provide the best diagnostic performance. Some discordant cases were observed and this should be evaluated in further research.Conclusions
MRE-based shear strain mapping is a promising technique for non-invasively predicting the presence of microvascular invasion in patients with HCC, which should be further validated in a prospective study with a large sample.Acknowledgements
This study is supported by National Natural Science Foundation of China grant 91959118 (JW), Science and Technology Program of Guangzhou, China 201704020016 (JW) and Clinical Research Foundation of the 3rd Affiliated Hospital of Sun Yat-Sen University YHJH201901 (JW).References
1.Du M, Chen L, Zhao J, et al. Microvascular invasion (MVI) is a poorer prognostic predictor for small hepatocellular carcinoma. BMC Cancer. 2014;14:38.
2.Feng LH, Dong H, Lau WY, et al. Novel microvascular invasion-based prognostic nomograms to predict survival outcomes in patients after R0 resection for hepatocellular carcinoma. J Cancer Res Clin Oncol. 2017;143:293-303.
3.Lim KC, Chow PK, Allen JC, et al. Microvascular invasion is a better predictor of tumor recurrence and overall survival following surgical resection for hepatocellular carcinoma compared to the Milan criteria. Ann Surg. 2011;254:108-113.
4.Sumie S, Kuromatsu R, Okuda K, et al. Microvascular invasion in patients with hepatocellular carcinoma and its predictable clinicopathological factors. Ann Surg Oncol.2008;15:1375-1382.
5.Garteiser P, Doblas S, Daire JL, et al. MR elastography of liver tumours: value of viscoelastic properties for tumour characterisation. Eur Radiol. 2012;22:2169-2177.
6.Idilman IS, Li J, Yin M, Venkatesh SK. MR elastography of liver: current status and future perspectives. Abdom Radiol (NY). 2020;45:3444-3462.
7.Morisaka H, Motosugi U, Ichikawa S, et al. Magnetic resonance elastography is as accurate as liver biopsy for liver fibrosis staging. J Magn Reson Imaging. 2018;47:1268-1275.
8.Park CC, Nguyen P, Hernandez C, et al. Magnetic Resonance Elastography vs Transient Elastography in Detection of Fibrosis and Noninvasive Measurement of Steatosis in Patients With Biopsy-Proven Nonalcoholic Fatty Liver Disease. Gastroenterology. 2017;152:598-607.
9.Park SJ, Yoon JH, Lee DH, Lim WH, Lee JM. Tumor Stiffness Measurements on MR Elastography for Single Nodular Hepatocellular Carcinomas Can Predict Tumor Recurrence After Hepatic Resection. J Magn Reson Imaging. 2020. doi: 10.1002/jmri.27359.
10.Pepin KM, Ehman RL, McGee KP. Magnetic resonance elastography (MRE) in cancer: Technique, analysis, and applications. Prog Nucl Magn Reson Spectrosc. 2015;90-91:32-48.
11.Shahryari M, Tzschatzsch H, Guo J, et al. Tomoelastography Distinguishes Noninvasively between Benign and Malignant Liver Lesions. Cancer Res. 2019;79:5704-5710.
12.Wang J, Shan Q, Liu Y, et al. 3D MR Elastography of Hepatocellular Carcinomas as a Potential Biomarker for Predicting Tumor Recurrence. J Magn Reson Imaging. 2019;49:719-730.
13.Yin Z, Glaser KJ, Manduca A, et al. Slip Interface Imaging Predicts Tumor-Brain Adhesion in Vestibular Schwannomas. Radiology. 2015;277:507-517.
14.Yin Z, Hughes JD, Trzasko JD, et al. Slip interface imaging based on MR-elastography preoperatively predicts meningioma-brain adhesion. J Magn Reson Imaging. 2017;46:1007-1016.
Figures