2107
Comparison of MRI and CT for Prediction of Microvascular Invasion in Solitary Hepatocellular Carcinoma: Which Imaging Modality Is Better?1Radiology, Zhongda Hospital, Medical School of Southeast University, Nanjing, China
Synopsis
Given the fundamental role of imaging in predicting MVI, it is important to understand relative ability of different imaging modalities. However, whether CT and MRI have a comparable predictive performance for MVI is unknown. This study aimed to compare the performance of CT and MRI for prediction of MVI in solitary HCC and investigate added value of radiomics analysis for MVI prediction.
Background and Purpose
Both CT and MRI are available for noninvasive prediction of microvascular invasion (MVI) in hepatocellular carcinoma (HCC). Several studies have attempted to develop prediction algorithms based on the radiomics approach or the combination of radiographic features and radiomics at either CT or MRI for MVI prediction. Furthermore, HCC > 2 and ≤ 5 cm was a population in which prognostic value of MVI is especially significant, but the added value of radiomics at CT or MRI for MVI in this population remains unknown. The purpose of this study was to compare the performance of CT and MRI for prediction of MVI in solitary HCC and investigate added value of radiomics analysis for MVI prediction, with an emphasis on HCC > 2 and ≤ 5 cm.Methods
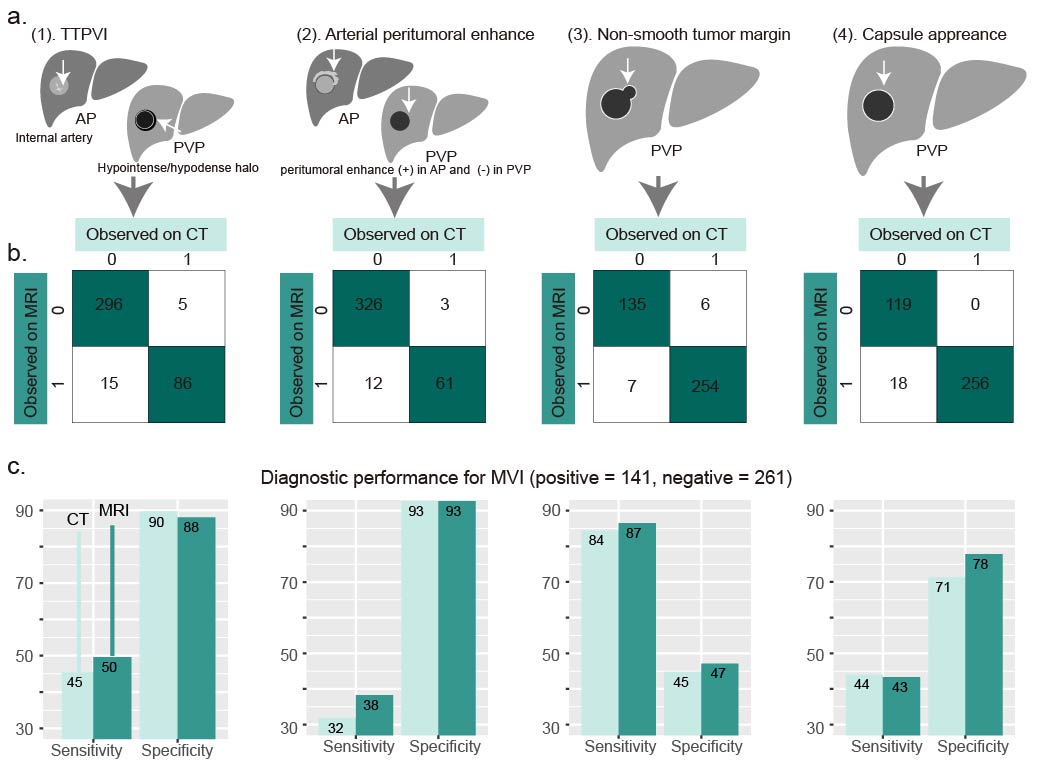
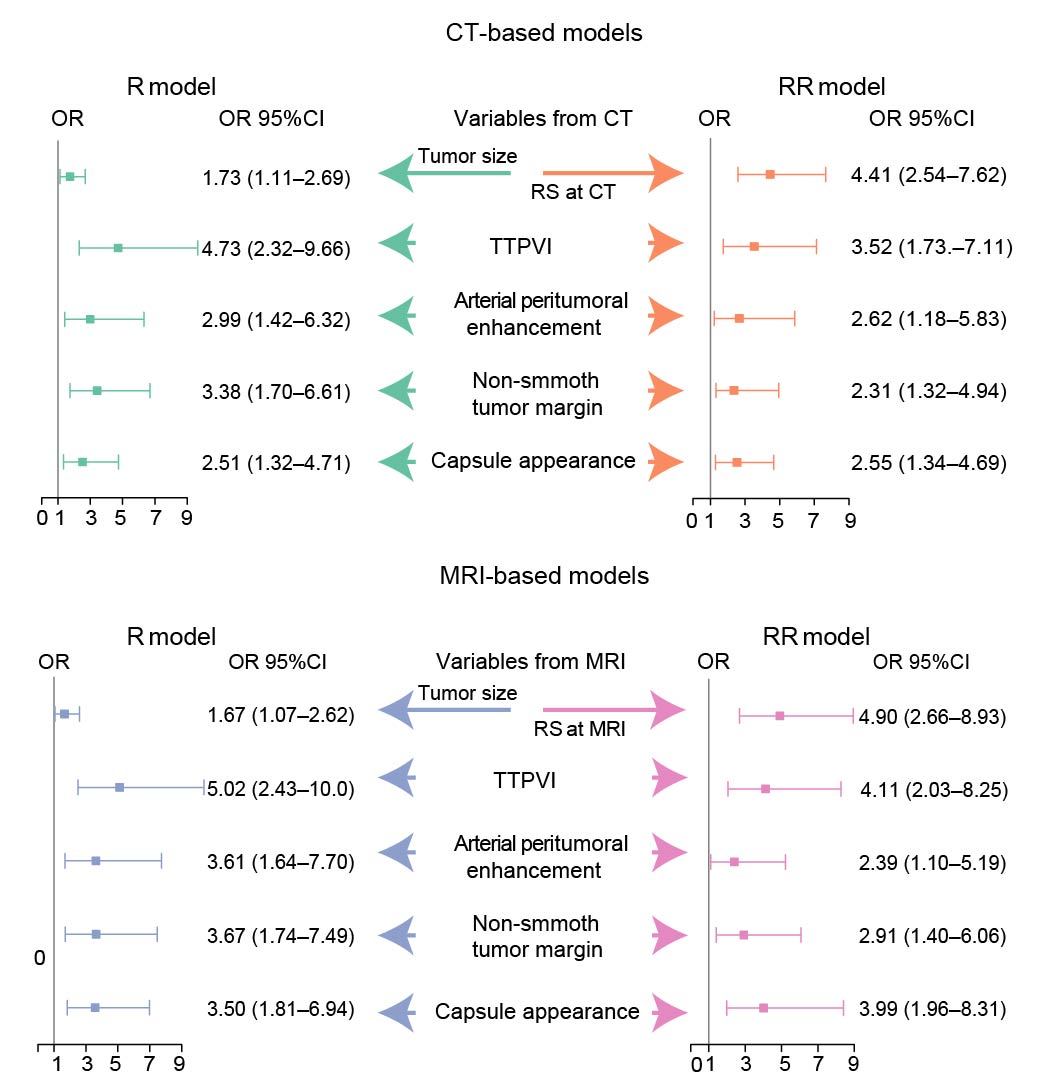
This retrospective study was approved by the institutional review board, and the requirement for informed consent was waived. A total of 402 consecutive HCC patients who underwent hepatectomy were included and randomly divided into training (n = 300) and validation (n = 102) sets. Radiomics features were extracted from the tumor region and peritumoral region of arterial phase (AP) and the portal venous phase (PVP) CT images as well as contrast-enhanced T1-weighted AP and PVP, diffusion-weighted imaging (DWI), and T2-weighted imaging(T2WI) of MR images, by using Pyradiomics Python package. A CT-based, along with an MR-based, radiomics signature (RS) was constructed using the least absolute shrinkage and selection operator regression. Radiographic features, a two-trait predictor of venous invasion (TTPVI), arterial peritumoral enhancement, tumor margins, and capsule appearance, were interpreted at either CT or MRI (Schematic of the features illustrated in Fig. 1a). Univariable and multivariable logistics regression were used to identify independent predictors for MVI. A CT-based, along with an MR-based, radiographic (R) model and radiographic-radiomics (RR) model were developed by multivariable logistics regression. Performance of CT-based models was compared with that of MR-based. To investigate added value of the radiomics signature, performance of the R models was compared with that of the RR models. Performance of the R models and RR models on HCC > 2 and ≤ 5 cm in pathologically identified diameter were also compared. Model performance was quantified by the area under the receiver operating characteristic curve (AUC) and compared by the Delong test.Results
Frequencies of the radiographic features at CT or MRI are recorded (Fig. 1b), with sensitivity and specificity of each feature for MVI shown in Fig. 1c. Model performance is on the independent validation set. MRI-based RS had a comparable performance with that of CT-based (AUC: 0.804 vs 0.801, P = 0.96). Independent variables with their odds ratio identified by logistics regression are displayed in Fig.2. MRI-based models tended to have a marginally higher AUC than that of CT-based (AUC of CT-based vs MRI-based R model, 0.809 vs 0.832, P = 0.09, AUC of CT-based vs MRI-based RR model, 0.835 vs 0.872, P = 0.54). Neither improvement of RR models over R models was significant (AUC of RR model vs R model at CT, 0.835 vs 0.809, P = 0.21; AUC of RR model vs R model at MRI, 0.872 vs 0.832, P = 0.09). For HCC > 2 and ≤ 5 cm (n = 55 in the validation set), the MRI-based RR model had significant improvement over the MRI-based R model (AUC, 0.863 vs 0.764, P = 0.034), whereas the CT-based RR model had no significant improvement over the MRI-based R model (AUC, 0.834 vs 0.754, P = 0.16).Conclusion
CT and MRI may have comparable predictive performance for MVI, whether using radiographic features or radiomics analysis or their combination. Radiomics signatures did not provide significant added value to the radiographic features for MVI prediction in HCC of all sizes. For a group of HCC > 2 and ≤ 5 cm in which prognostic value of MVI was especially important, the radiomics signatures at MRI can provide significant added value for MVI prediction. Thus, it is probably best to take into consideration the strengths of a given institution in terms of availability of equipment, radiologists' experience in radiographic features interpretation, and effectiveness of radiomics when choosing which modality to use for MVI prediction.Acknowledgements
No acknowledgement found.References
1. Xu X, Zhang HL, Liu QP, et al. Radiomic analysis of contrast-enhanced CT predicts microvascular invasion and outcome in hepatocellular carcinoma. J Hepatol 2019;70:1133-1144.
2. Yang L, Gu D, Wei J, et al. A Radiomics Nomogram for Preoperative Prediction of Microvascular Invasion in Hepatocellular Carcinoma. Liver Cancer 2019;8:373-386.
3. Ma X, Wei J, Gu D, et al. Preoperative radiomics nomogram for microvascular invasion prediction in hepatocellular carcinoma using contrast-enhanced CT. Eur Radiol 2019;29:3595-3605.
4. Sun SW, Liu QP, Xu X, Zhu FP, Zhang YD, Liu XS. Direct Comparison of Four Presurgical Stratifying Schemes for Prediction of Microvascular Invasion in Hepatocellular Carcinoma by Gadoxetic Acid-Enhanced MRI. J Magn Reson Imaging 2020;52:433-447.
Figures