2106
Acquisition of High-resolution Time Intensity Curves Using a Deep Learning Reconstruction for Dynamic Contrast Enhanced MRI1MRI Systems Development Department, Canon Medical Systems Corporation, Kanagawa, Japan, 2Department of Advanced MRI Collaboration Research, Tohoku University Graduate School of Medicine, Miyagi, Japan, 3Department of Diagnostic Radiology, Tohoku University Hospital, Miyagi, Japan, 4CT-MR Solution Planning Department, Canon Medical Systems Corporation, Tochigi, Japan, 5Advanced Technology Research Department, Research and Development Center, Canon Medical Systems Corporation, Kanagawa, Japan, 6Department of Radiological Technology, Tohoku University Hospital, Miyagi, Japan, 7MRI Sales Department, Canon Medical Systems Corporation, Miyagi, Japan, 8Department of Diagnostic Radiology, Tohoku University Graduate School of Medicine, Miyagi, Japan
Synopsis
The purpose is to provide improved time intensity curves (TICs) of dynamic contrast enhanced MRI. In this work, a method based on convolutional neural network (CNN) was compared with a conventional method based on compressed sensing (CS). While both of the methods used radial sampling for free-breathing acquisitions, reconstruction strategies were different.
The experimental results showed that, in comparison with the images reconstructed with CS, the images reconstructed with CNN exhibited higher temporal resolution in the TICs without losing spatial detail.
Introduction
Acquisitions using stack-of-stars trajectory are often used for dynamic contrast enhanced (DCE) MRI of abdominal region1,2. The trajectory is known as robust against motion artifacts. Others have evaluated the effects on time intensity curves (TICs) using compressed sensing (CS) algorithm with temporal total variation1,3. The CS algorithm uses all available frames for reconstructing each frame. While the strategy is good for achieving high spatial resolution, it has a potential risk of losing temporal resolution.Inspired from recent advances in reconstructions based on conventional neural network (CNN)4, Takeshima et al. proposed a method for acquisitions of dynamic MRI2. The method uses a CNN with multiple inputs that are reconstructed in various temporal resolutions. A previous work implied that the method was suitable for DCE-MRI5.
The aim of this work is to compare the method based on CNN with a conventional method based on CS.
Method
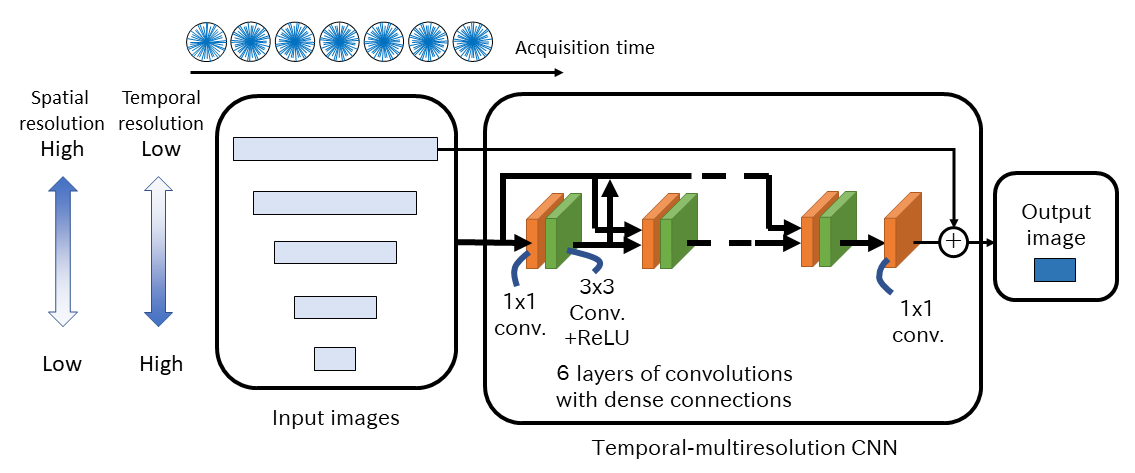
The reconstruction method based on CNN is illustrated in Figure 1. Raw k-space data were acquired with stack-of-stars trajectory, for continuous four minutes under free-breathing. For each frame, images of five different resolutions with 21, 42, 63, 84 and 105 spokes per frame were reconstructed using a gridding algorithm6 and traditional Fourier transform. The five reconstructed images were stacked and used as inputs to a CNN. The output of the CNN was a spatially-fine image with temporal resolution equivalent to having 21 spokes per frame. The network structure of the CNN was based on DenseNet7.The reconstruction method based on CS, used in the comparison, is the algorithm implemented in the open source toolbox BART8 version 0.4.04. The strength of regularization $$$\lambda$$$ was empirically adjusted to $$$0.01$$$.
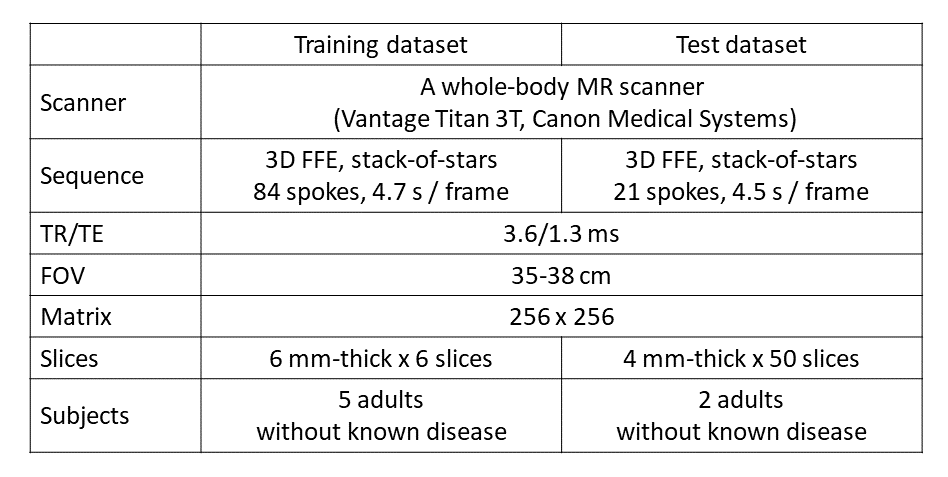
To prepare a training dataset for the CNN, five volunteers were scanned under the IRB-approved protocol. The details of the dataset are shown in Figure 2. ʻGd-DTPAʼ contrast agent was injected in the middle of the acquisitions. The number of slices was set to 6, which was significantly smaller than those used typically in clinical conditions, in order to increase the number of acquiring spokes per time. The input images for the CNN were created by reconstructing the acquired data under-sampled to match the number of acquiring spokes per time with the test dataset mentioned later. The target images are created by reconstructing the acquired data without under-sampling.
To prepare a test dataset for CNN, two other IRB-approved volunteers were scanned with the parameters shown in Figure 2. The contrast agent was injected about 30 seconds after the start of the acquisitions.
The methods based on CNN and CS were used for reconstructing dynamic images with 4.5 seconds per frame (corresponding to 21 spokes per frame). In addition to the reconstructed images with CNN (named recon-CNN) and reconstructed images with CS (recon-CS), subsets of the input images to the CNN with 21 and 105 spokes per frame (input-21 and input-105) were also compared for further investigation.
For evaluation of spatial image quality, signal-to-noise ratios (SNRs) at the liver parenchyma were measured. For evaluation of temporal resolution, time-intensity-curves (TICs) were calculated at the aorta.
Results
The reconstructed images for two volunteers are shown in Fig. 3 and 4. The pixel scaling is fixed for each volunteer to clarify the contrast enhancement. The measured SNRs are also shown for each image.The obtained TICs at the aorta from the reconstructed dynamic images are shown in Fig.5. While the TICs with CNN contains steep upslopes, which represent arrival of the contrast agents, those with CS contains dampened curves.
Discussion
Both the SNRs of images reconstructed with CNN and CS were better than those of the input images. In addition to the increase of the SNRs, according to a visual assessment, images reconstructed with CNN appear to hold more detailed anatomies such as hepatic arteries, portal veins and spinal cords, compared with those reconstructed with CS.The TICs with CNN and CS are similar to the TICs from the input images with 21 spokes (4.5 s / frame) and 105 spokes (22.5 s / frame), respectively. These results imply that the TICs with CS are oversmoothed, and the TICs with CNN are more precise than that with CS in the spans where drastic changes of signal exist. The quantitative validation of these results is remained as a future work.
The advantage of the method based on CNN can be understood as a result of two reasons. The first is because its temporal dependency was limited to 105 spokes, contrary to that the method based on CS depended on all the frames. The second is because the CNN received as a part of its inputs temporally-high-resolution images such as 21 spoke per frame, and the CNN did well in finding suitable mixture of the inputs.
Conclusion
This work showed that the TICs obtained by the method based on CNN exhibited better SNR, spatial detail, and temporal resolution than those obtained by the method based on CS.Acknowledgements
No acknowledgement found.References
- Feng L, Block KT, Grimm R, et al. Golden-Angle Radial Sparse Parallel MRI: Combination of Compressed Sensing, Parallel Imaging, and Golden-Angle Radial Sampling for Fast and Flexible Dynamic Volumetric MRI. Magn Reson Med. 2014;72(3):707-717.
- Takeshima H and Kutsuna H. Fast Acquisition and Low-delay Reconstruction of Stack-of-stars Trajectory Using Temporal Multiresolution Images and a Convolutional Neural Network. Proc. Intl. Soc. Magn. Reson. Med. 2019:467
- Sagawa H, Kataoka M., Kanao S, et al. Impact of the Number of Iterations in Compressed Sensing Reconstruction on Ultrafast Dynamic Contrast-enhanced Breast MR Imaging. Magn Reson Med Sci. 2019;18(3):200-207
- Kidoh M, Shinoda K, Kitajima M, et al. Deep Learning Based Noise Reduction for Brain MR Imaging: Tests on Phantoms and Healthy Volunteers. Magn Reson Med Sci. 2020;19(3):195-206
- Ota H, Kutsuna H, Kassai Y, et al. A Clinical Study of High Temporal-Resolution Stack-of-Stars Dynamic Liver MR Imaging Reconstructed with Temporal-Multiresolution Convolutional Neural Network. Proc. Radiological Society of North America 2020
- Jackson JI, Meyer CH, Nishimura DG, Macovski A. Selection of a convolution function for Fourier inversion using gridding [computerised tomography application]. IEEE Trans Med Imag. 1991;10:473-478
- Huang G, Liu Z, van der Maaten L, Weinberger KQ. Densely Connected Convolutional Networks. IEEE Conference on Pattern Recognition and Computer Vision (CVPR) 2016; 2261-2269.
-
BART Toolbox for Computational Magnetic Resonance Imaging.
https://mrirecon.github.io/bart/
Figures
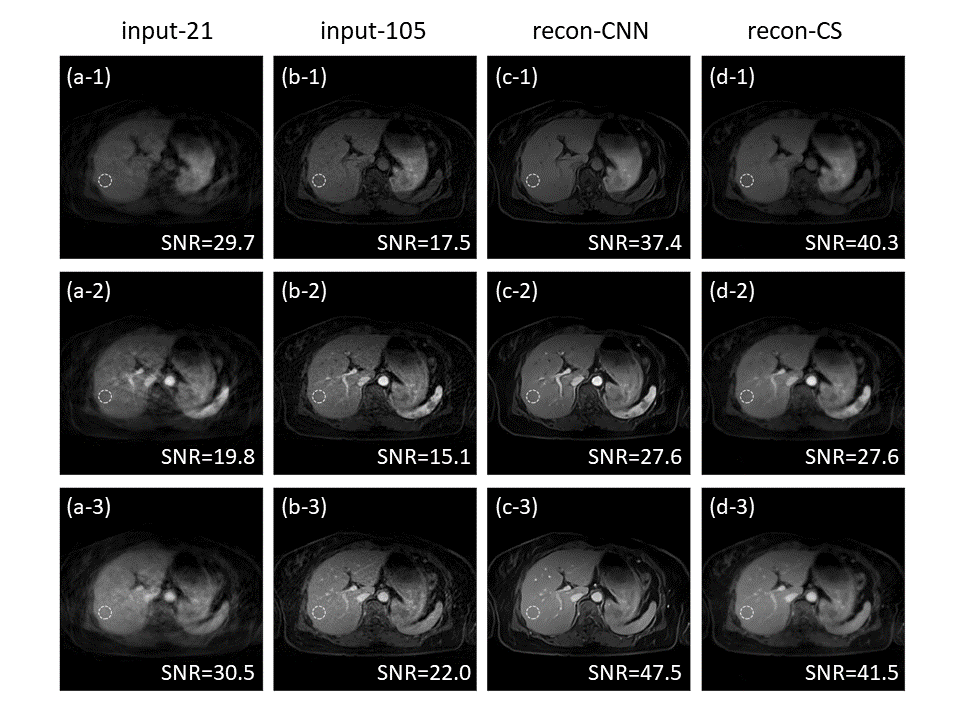
Reconstructed images from the first test volunteer.
(a) A subset of the input images with 21 spoke per frame (input-21.)
(b) A subset of the input images with 105 spoke per frame (input-105.)
(c) Output images from the CNN (recon-CNN.)
(d) Reconstructed images with the CS algorithm (recon-CS.)
Rows of the image matrix represent different temporal frame.
Dashed circles indicate the regions that the SNRs are calculated.
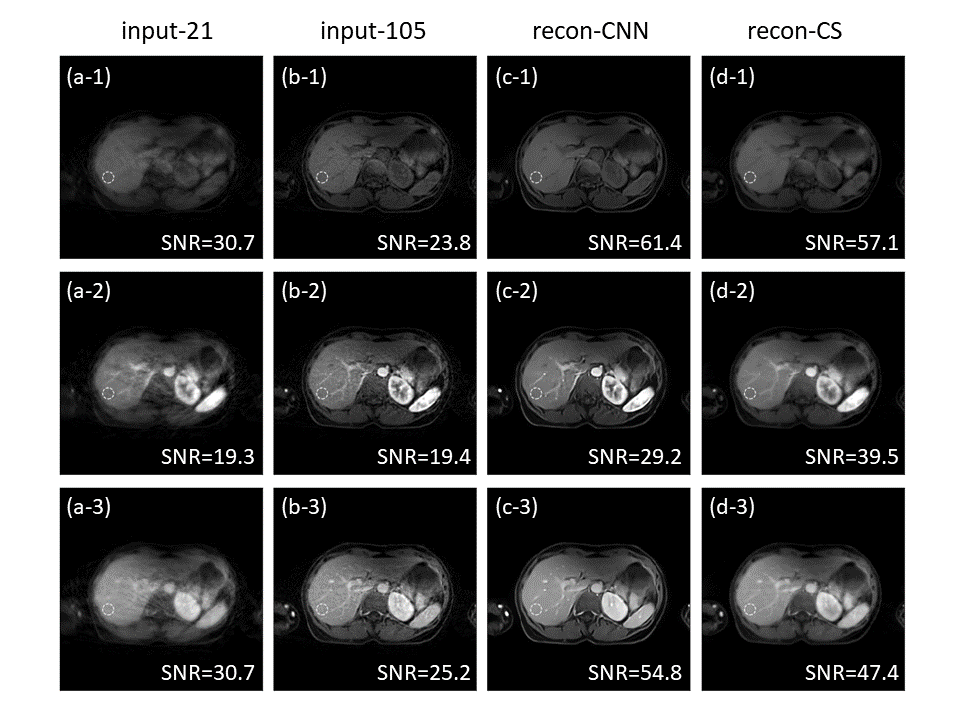
Reconstructed images from the second test volunteer.
(a) A subset of the input images with 21 spoke per frame (input-21.)
(b) A subset of the input images with 105 spoke per frame (input-105.)
(c) Output images from the CNN (recon-CNN.)
(d) Reconstructed images with the CS algorithm (recon-CS.)
Rows of the image matrix represent different temporal frame.
Dashed circles indicate the regions that the SNRs are calculated.
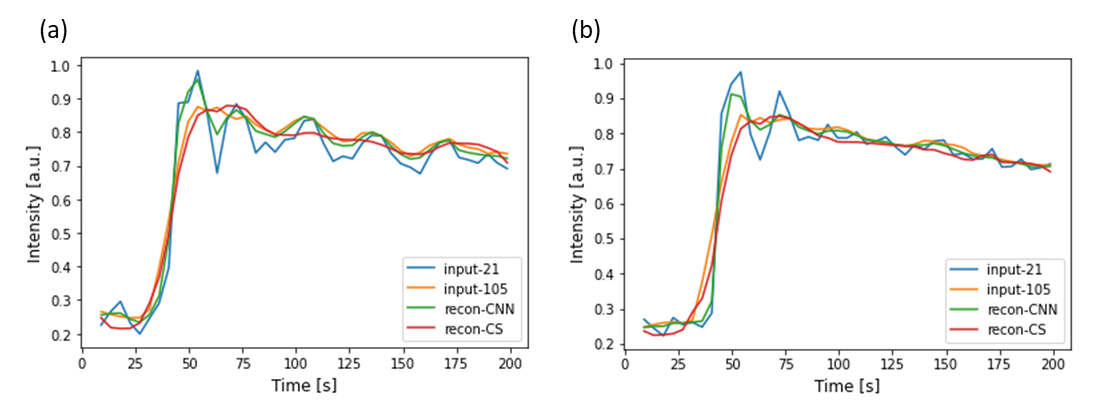
Time intensity curves obtained from the two volunteers.
(a) TIC from the first volunteer.
(b) TIC from the second volunteer.
Blue, Yellow, Green, Red lines represent TICs from input-21, input-105, recon-CNN and recon-CS, respectively.