2105
Hepatocellular Adenoma: Radiology-Pathology Subtype Associations with Hepatobiliary Phase MRI
Alix C Hopp1, Carolyn Mead-Harvey2, and Alvin C Silva1
1Radiology, Mayo Clinic Arizona, Phoenix, AZ, United States, 2Mayo Clinic Arizona, Phoenix, AZ, United States
1Radiology, Mayo Clinic Arizona, Phoenix, AZ, United States, 2Mayo Clinic Arizona, Phoenix, AZ, United States
Synopsis
Hepatocellular adenoma (HCA) is an uncommon benign tumor with risk for tumoral hemorrhage and malignant transformation. At least four HCA subtypes have been described: Inflammatory (I-HCA); hepatocyte nuclear factor 1-α mutated (H-HCA); β-catenin (B-HCA); and unclassified (U-HCA). I-HCA has the highest risk for tumoral hemorrhage, whereas B-HCA is the most likely to undergo malignant transformation. Clinical management differs for HCA subtypes, based on their different level of risk for complications. This study examines the image findings of pathologically proven HCAs from our institution on gadoxetic acid-enhanced MRI, in order to describe association between MRI image findings with HCA subtypes.
Introduction
Hepatocellular adenoma (HCA) is considered a benign tumor; however the risk of tumoral hemorrhage and malignant transformation may require more aggressive clinical management such as surgical resection or ablation. There are at least four subtypes of HCA: inflammatory (I-HCA); hepatocyte nuclear factor 1-α mutated (H-HCA); β-catenin (B-HCA); and unclassified (U-HCA). I-HCA is associated with increased risk of tumoral hemorrhage, whereas B-HCA is associated with increased risk of malignant transformation. This study examines the association between gadoxetic acid-enhanced MRI findings and HCA subtypes to expedite clinical management.Methods
Retrospective analysis was performed on gadoxetic acid-enhanced MRI of patients with pathological diagnosis of HCA with subtyping from the last 10 years at our institution. Per-patient MRI attributes reviewed include tumoral signal intensity of the largest lesion relative to the liver parenchyma on T1, T2 fat saturation, precontrast, dynamic (arterial, venous, equilibrium), and hepatobiliary phases (HBP). In addition, T1 opposed-phase signal dropout, diffusion restriction, and non-tumoral hepatic parenchymal steatosis were also recorded. HBP iso-/hyperintensity pattern was documented either as homogeneous or heterogeneous. Per-lesion sub-analysis of iso-/hyperintense HBP pattern was performed on each B-HCA lesion. Statistical analysis using Fisher exact test was performed to determine association of statistical significance (p<0.05) between MRI image attributes and subtype. Performance of the binary HBP, T2, fat-dropout, and steatosis MRI attribute as a classifier of subtype was assessed.Results
A total of 60 patients are included in the study, including 58 females and 2 males, with an average age of 37 (range 19-57). There were 38 I-HCA (63%), 10 H-HCA (17%), 3 B-HCA (5%), and 9 U-HCA (15%). Among the 60 patients, 82% (49/60) were predominantly HBP hypointense and 18% (11/60) iso-/hyperintense. Subtype analysis (B-HCA/H-HCA/I-HCA/U-HCA) showed (0/100/79/100%) hypointensity and (100/0/21/0%) iso-/hyperintensity. For hyperintense and isointense lesions, 87% and 62% were heterogeneous, respectively. Of the 26 B-HCA lesions, 65% (17/26) were hyperintense and 35% (9/26) isointense; overall 77% had heterogeneous pattern. The predominantly hypointense HBP pattern was not seen with B-HCA, but was seen in 49/57 of patients with other subtypes, with a specificity of 86% (95% CL 74-94%); in fact, it was less likely seen with any subtype with β-catenin activation (sensitivity 57%/specificity 87%).77% (30/39) of I-HCA demonstrated T2 hyperintensity; however, 56% (5/9) of U-HCA also demonstrated T2 hyperintensity. Atoll sign (hyperintense T2 rim) was seen in 28% (11/39) of I-HCA, but also 11% (1/9) of U-HCA. 90% (9/10) of H-HCA demonstrated T1 opposed-phase signal dropout. Hepatic steatosis was seen in 100% (9/9) of U-HCA and 64% (25/39) of I-HCA.
Discussion
Previously, HCA was thought to demonstrate HBP hypointensity, whereas focal nodular hyperplasia (FNH) typically demonstrated HBP iso-/hyperintensity; therefore HBP hypointensity was commonly used as a distinguishing characteristic from FNH 1,2,3. More recent studies have shown that up to 80% of B-HCA 1, 4, 5 and up to 33% of I-HCA 1, 4, 6, 7 may actually demonstrate iso-/hyperintense HBP. One hypothesis is that β-catenin activation results in increased OATP1B3 expression1, 8, the receptor that mediates gadoxetic acid uptake. This was confirmed in our study, in which 100% (3/3) of B-HCA and 21% (8/39) of I-HCA demonstrate HBP iso-/hyperintensity. Although HBP iso-/hyperintensity was not associated with a specific hepatic subtype, the predominantly hypointense HBP pattern was not seen with B-HCA, and the hyperintense/isointense HBP pattern are more likely to be heterogeneous (64% or 7/11). Per-lesion analysis of B-HCA also demonstrated that the iso-/hyperintense pattern tended to be heterogeneous (77% or 22/26).Tumoral T2 hyperintensity and atoll sign were previously described to have a high sensitivity and specificity for I-HCA (T2: 85% and 87-100%, respectively 1, 9, 8, 10; and atoll sign: 85% and 87.5%, respectively 8, 11). In our cohort, T2 hyperintensity had sensitivity 79% (CL 63-90%) and specificity 59% (CL 36-79%); and atoll sign had sensitivity 29% (CL 15-46%) and specificity 95% (CL 77-100%) for I-HCA.
Tumoral T1 opposed-phase signal dropout was previously described to have 87% sensitivity and 100% specificity for H-HCA 8, 11, 12. This is similar to our results, with 90% sensitivity (CL 56-100%) and 92% specificity (CL 81-98%).
Previous studies have described high association of non-tumoral hepatic steatosis with I-HCA 8, 13, which was consistent with our study (66%; 25/38). However, 100% (9/9) of U-HCA also showed diffuse hepatic steatosis, with 72% sensitivity (CL 57-84%) and 92% specificity (CL 64-100%) for either I-HCA or U-HCA. Previous study showed that H-HCA is often seen in a background of various hepatic steatosis 8, however, our study did not show H-HCA with non-tumoral hepatic steatosis (0/10).
Conclusion
In our study, HBP iso-/hyperintensity of a hepatic mass in a non-cirrhotic liver did not exclude HCA; specifically B-HCA and I-HCA subtypes. In fact, the classic hypointense HBP appearance of HCA was less likely seen with β-catenin activation; which more likely exhibited a heterogeneous (not homogeneous) HBP iso-/hyperintensity. Furthermore, our results showed that T2 hyperintensity was a sensitive marker and atoll sign a specific marker for I-HCA; T1 opposed-phase signal dropout was a sensitive and specific finding for H-HCA; and diffuse hepatic steatosis in the context of HCA was seen in cases of I-HCA and U-HCA, but not H-HCA.Acknowledgements
We would like to acknowledge the assistance and support of Dr. Marcela Salomao and Dr. Daniel Kehler.References
- Fujita N, Nishie A, Asayama Y, et al. Hyperintense Liver Masses at Hepatobiliary Phase Gadoxetic Acid–enhanced MRI: Imaging Appearances and Clinical Importance. RadioGraphics 2020;40(1):72-94.
- McInnes MDF, Hibbert RM, Inácio JR, Schieda N. Focal Nodular Hyperplasia and Hepatocellular Adenoma: Accuracy of Gadoxetic Acid–enhanced MR Imaging—A Systematic Review. Radiology 2015;277(2):413-423.
- Grazioli L, Bondioni MP, Haradome H, Motosugi U, Tinti R, Frittoli B, Gambarini S, Donato F, Colagrande S. Hepatocellular adenoma and focal nodular hyperplasia: value of gadoxetic acid-enhanced MR imaging in differential diagnosis. Radiology. 2012 Feb;262(2):520-9.
- Ba-Ssalamah A, Antunes C, Feier D, et al. Morphologic and Molecular Features of Hepatocellular Adenoma with Gadoxetic Acid–enhanced MR Imaging. Radiology 2015;277(1):104-113.
- Sciarra A, Schmidt S, Pellegrinelli A, Maggioni M, Dondossola D, Pasquier J, Cigala C, Tosi D, Halkic N, Bulfamante G, Viale G, Bosari S, Balabaud C, Bioulac-Sage P, Sempoux C. OATPB1/B3 and MRP3 expression in hepatocellular adenoma predicts Gd-EOB-DTPA uptake and correlates with risk of malignancy. Liver Int. 2019 Jan;39(1):158-167.
- Agarwal S, Fuentes-Orrego JM, Arnason T, et al. Inflammatory Hepatocellular Adenomas Can Mimic Focal Nodular Hyperplasia on Gadoxetic Acid–Enhanced MRI. American Journal of Roentgenology 2014;203(4):W408-W414.
- Glockner JF, Lee CU, Mounajjed T. Inflammatory hepatic adenomas: Characterization with hepatobiliary MRI contrast agents. Magnetic Resonance Imaging 2018;47:103-110.
- Zulfiqar M, Sirlin CB, Yoneda N, et al. Hepatocellular adenomas: Understanding the pathomolecular lexicon, MRI features, terminology, and pitfalls to inform a standardized approach. Journal of Magnetic Resonance Imaging 2020;51(6):1630-1640.
- Thomeer MG, E Bröker ME, de Lussanet Q, et al. Genotype-phenotype correlations in hepatocellular adenoma: an update of MRI findings. Diagn Interv Radiol. 2014;20(3):193-199.
- Ronot M, Bahrami S, Calderaro J, Valla DC, Bedossa P, Belghiti J, Vilgrain V, Paradis V. Hepatocellular adenomas: accuracy of magnetic resonance imaging and liver biopsy in subtype classification. Hepatology. 2011 Apr;53(4):1182-91. doi: 10.1002/hep.24147. Erratum in: Hepatology. 2011 Sep 2;54(3):1114. Belghti, Jacques [corrected to Belghiti, Jacques].
- Laumonier H, Bioulac-Sage P, Laurent C, Zucman-Rossi J, Balabaud C, Trillaud H. Hepatocellular adenomas: Magnetic resonance imaging features as a function of molecular pathological classification. Hepatology 2008;48(3):808-818.
- Aalten SMv, Thomeer MGJ, Terkivatan T, et al. Hepatocellular Adenomas: Correlation of MR Imaging Findings with Pathologic Subtype Classification. Radiology 2011;261(1):172-181.
- Paradis V, Champault A, Ronot M, et al. Telangiectatic adenoma: An entity associated with increased body mass index and inflammation. Hepatology 2007; 46: 140– 146.
Figures
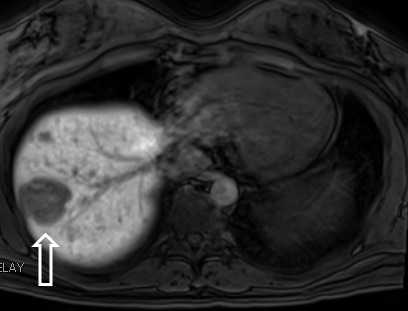
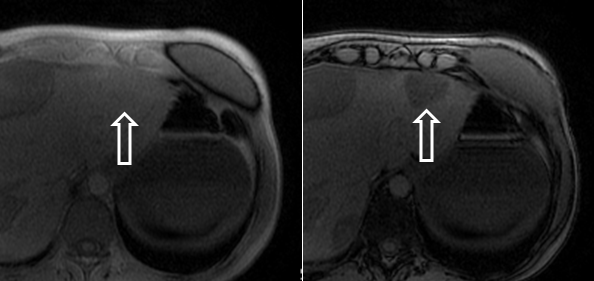
Example of classic predominantly
hypointense HBP of a I-HCA
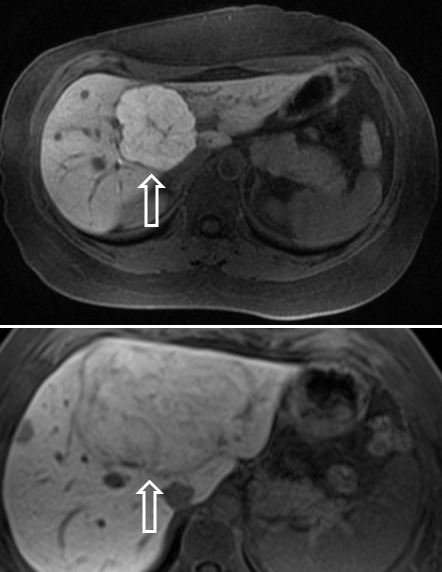
Examples of atypical homogeneously hyperintense HBP of I-HCA and homogeneously isointense HBP of I-HCA
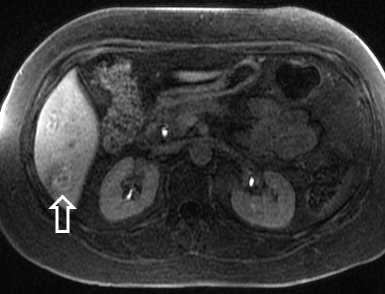
Example
of heterogeneous isointense HBP of a B-HCA
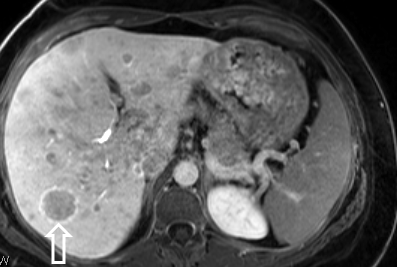
Example
of heterogeneous rim hyperintense HBP of a U-HCA
Example
of T1 opposed-phase signal drop out of H-HCA