2103
Longitudinal Change in Quantitative Magnetic Resonance Imaging Biomarkers in Pediatric Patients with Autoimmune Liver Disease1Imaging Research Center, Cincinnati Children's Hospital Medical Center, Cincinnati, OH, United States, 2Department of Radiology, Cincinnati Children's Hospital Medical Center, Cincinnati, OH, United States, 3Department of Radiology, University of Cincinnati College of Medicine, Cincinnati, OH, United States, 4Department of Pediatrics, University of Cincinnati College of Medicine, Cincinnati, OH, United States, 5Center for Autoimmune Liver Disease, Cincinnati Children's Hospital Medical Center, Cincinnati, OH, United States, 6Division of Gastroenterology, Hepatology, and Nutrition, Cincinnati Children's Hospital Medical Center, Cincinnati, OH, United States
Synopsis
Changes over time in liver and spleen T1 relaxation and MR elastography (MRE) measurements in children with autoimmune liver disease (AILD) have not been extensively studied as markers of disease. Iron (T2*)-corrected T1 (cT1) mapping and MRE were performed in 67 pediatric/young adult patients at baseline, 12, and 24 months. One-way ANOVA (mixed model) tests identified no statically significant changes in liver cT1 and liver and spleen stiffness over time but near-significant trends were identified. Further studies with larger sample sizes are needed to expand upon these preliminary results and define the roles of cT1 and MRE in clinical practice.
Introduction
Autoimmune hepatitis (AIH), primary sclerosing cholangitis (PSC), and autoimmune sclerosing cholangitis (ASC) are three, often overlapping, conditions that are considered autoimmune liver diseases (AILD). AILD is associated with liver-related complications and morbidity in pediatric and young adult populations1. Evidence shows that imaging metrics obtained from quantitative magnetic resonance imaging (MRI) methods, including T1 relaxation measurements and liver stiffness derived from MR elastography (MRE), can accurately diagnose and predict liver fibrosis stage in patients with chronic liver diseases2-5. Spleen stiffness measured from MRE also has been shown to correlate with portal hypertension, a common feature of liver cirrhosis6, 7. Assessing changes in these imaging metrics over time may illustrate their abilities to serve as markers of chronic liver disease progression. The objective of this study was to define longitudinal changes in quantitative MRI measurements, including liver iron (T2*)-corrected T1 (cT1) and MRE-derived liver and spleen stiffness, over a two-year period in pediatric and young adult patients with AILD.Methods
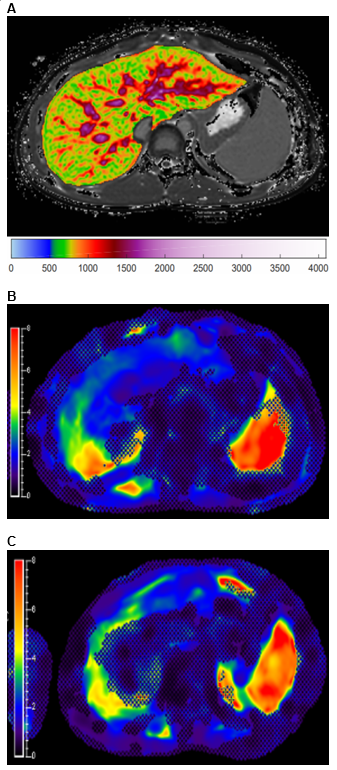
This single-center, observational pilot study was approved by the institutional review board and is Health Insurance Portability and Accountability Act (HIPAA)-compliant. Informed consent and assent, as appropriate, were obtained for all participants. Patients, from ages 0 to 25 years, in an AILD registry were included in this study. Participants underwent a baseline anatomic and quantitative research MRI exam at the time of registry enrollment as well as at 12 and 24 months. Liver MRI was performed on a 1.5T scanner (Ingenia; Philips Healthcare, Best, the Netherlands) and included liver and spleen MRE as well as liver cT1 mapping. cT1 (region-of-interest and whole liver mean) values were obtained using LiverMultiscan (Perspectum, Ltd. [Oxford, United Kingdom]). Representative cT1 and liver and spleen MRE images are presented in Figure 1. Automated liver stiffness values were calculated using MREplus 3.1.0 (Resoundant Inc. [Rochester, Minnesota]), and spleen stiffness values were manually extracted using IntelliSpace Portal (Philips Healthcare [Best, the Netherlands]). Only participants with at least two available examinations were included in this analysis. One-way analysis of variance (ANOVA) (mixed model) tests were performed in GraphPad Prism 8.0.1 (GraphPad Software LLC. [San Diego, California]) to determine if there were significant changes in MRE liver and spleen stiffness as well as cT1 measurements between baseline, year 1, and year 2 MRI exams. P-values less than 0.05 were considered statistically significant.Results
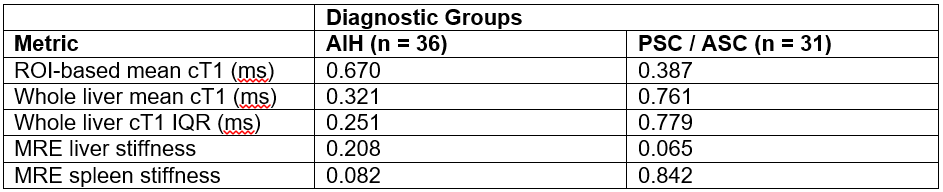
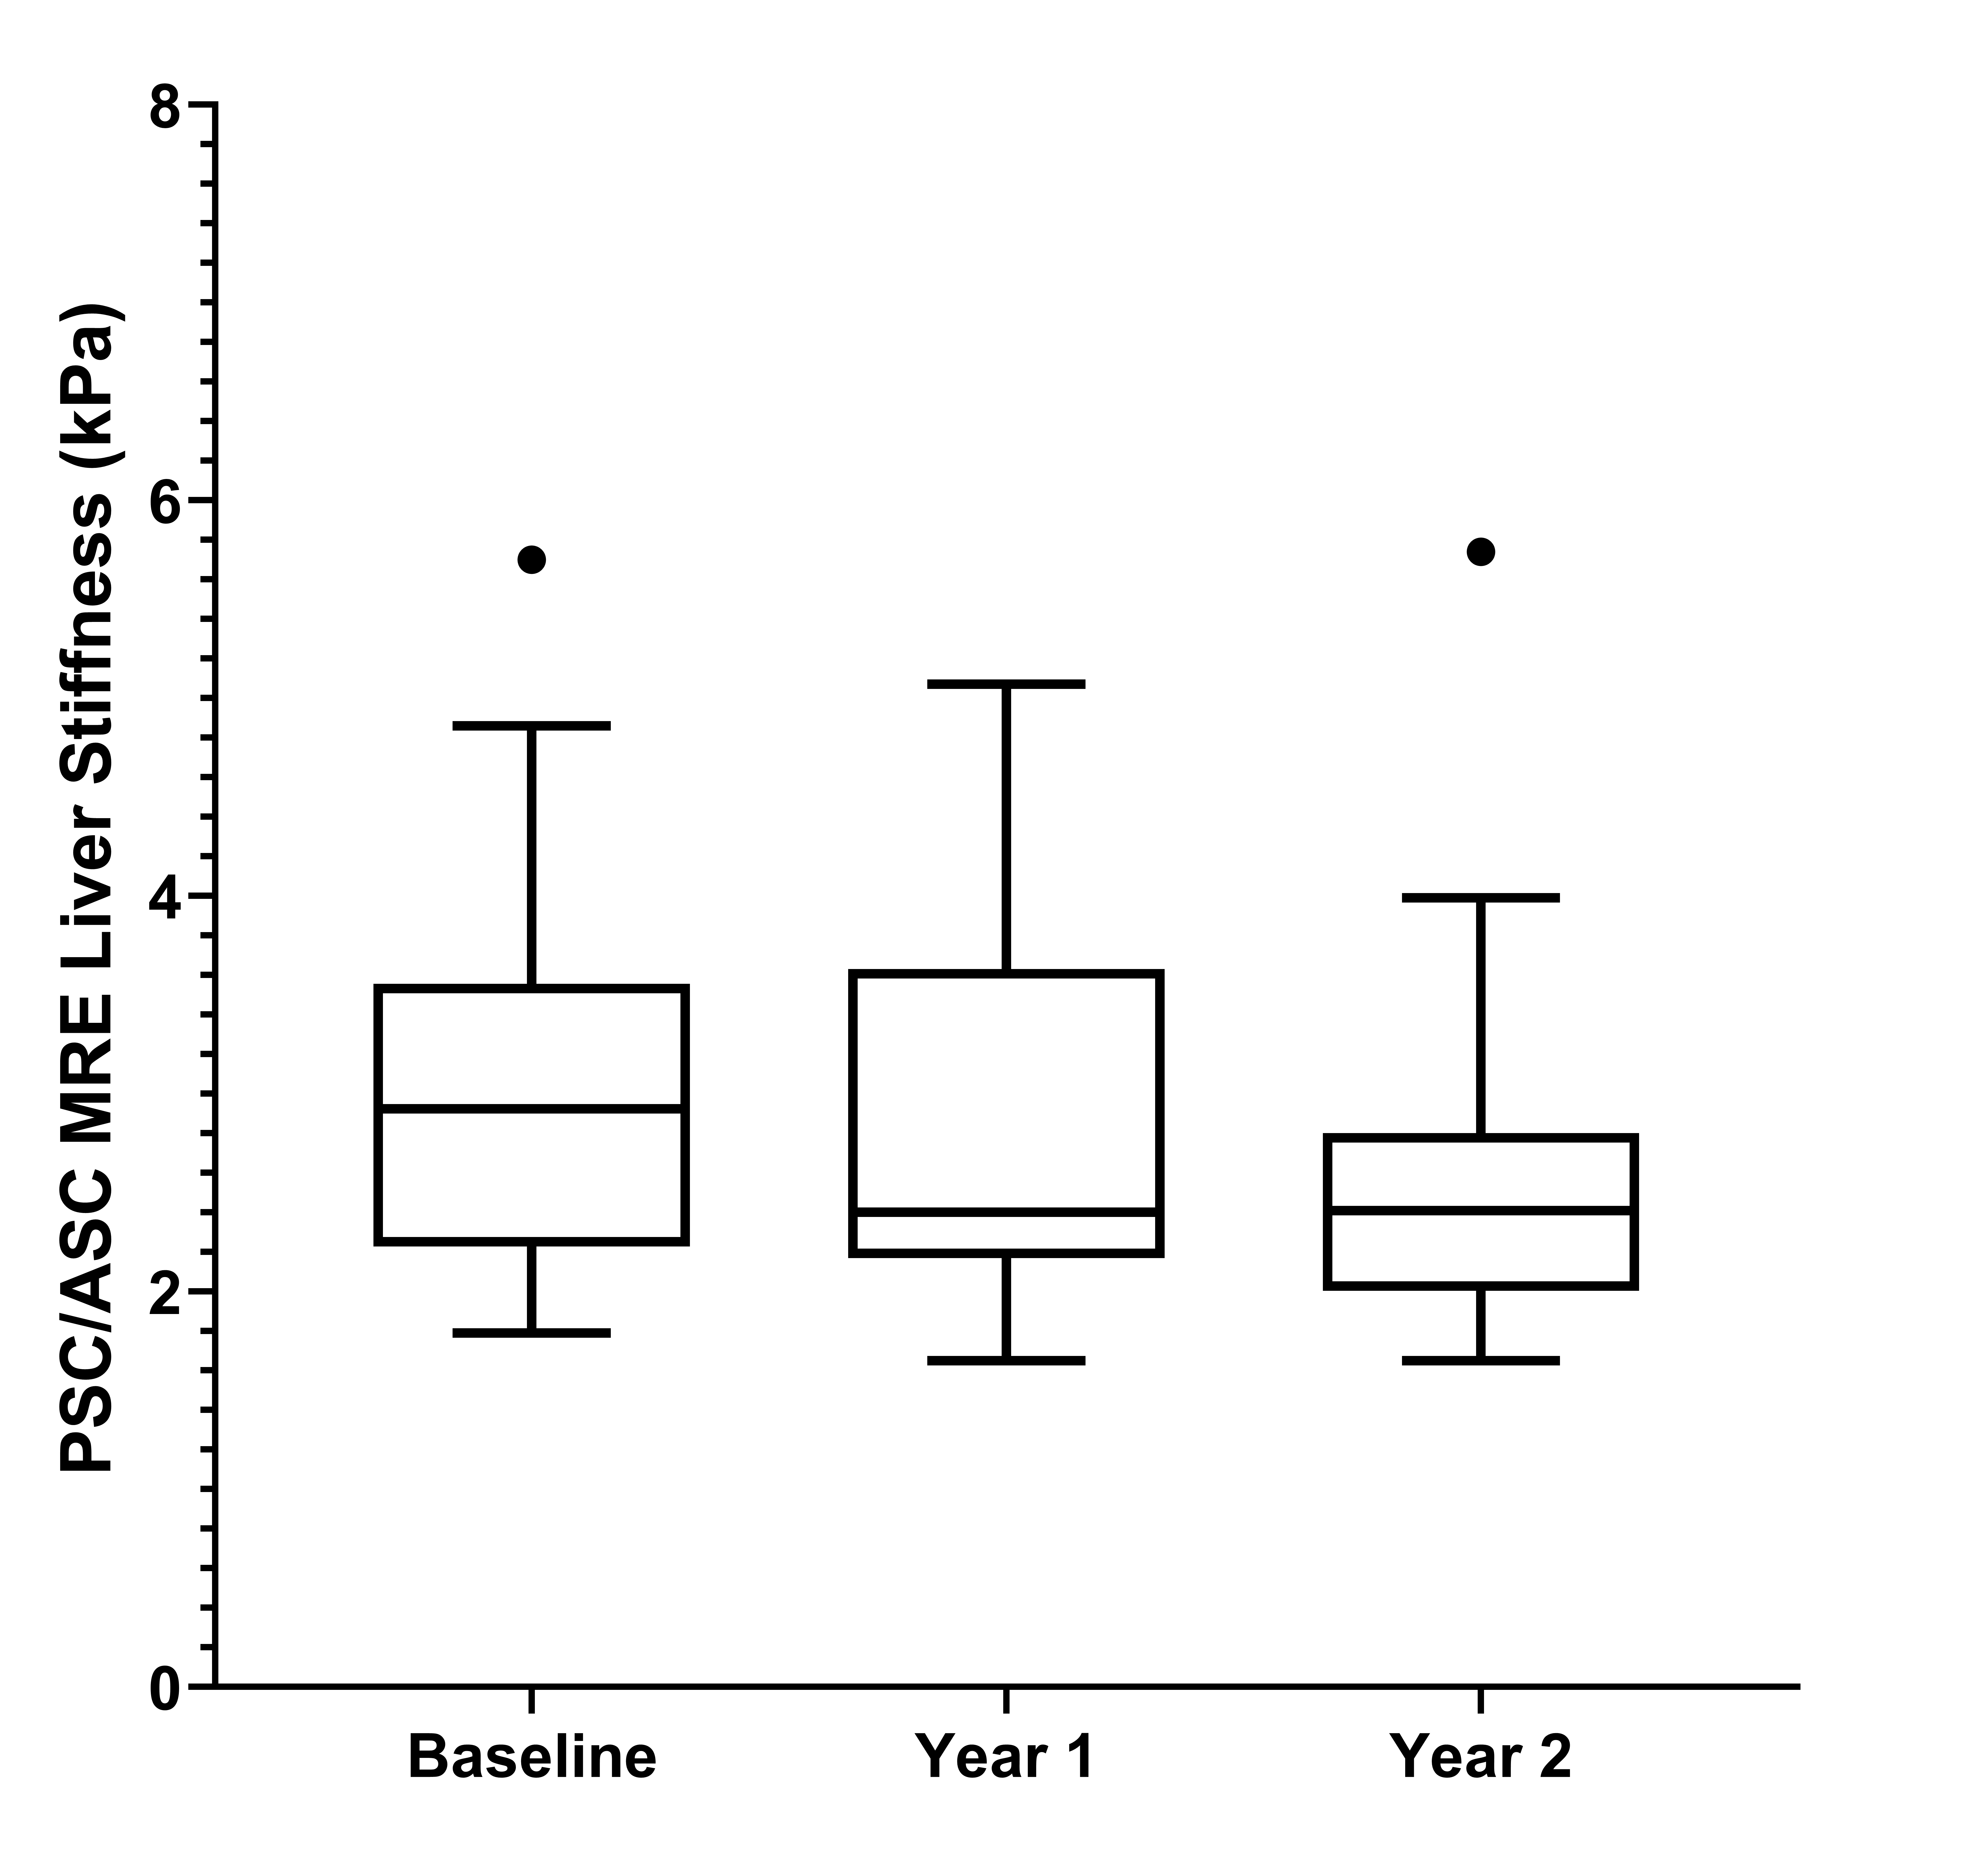
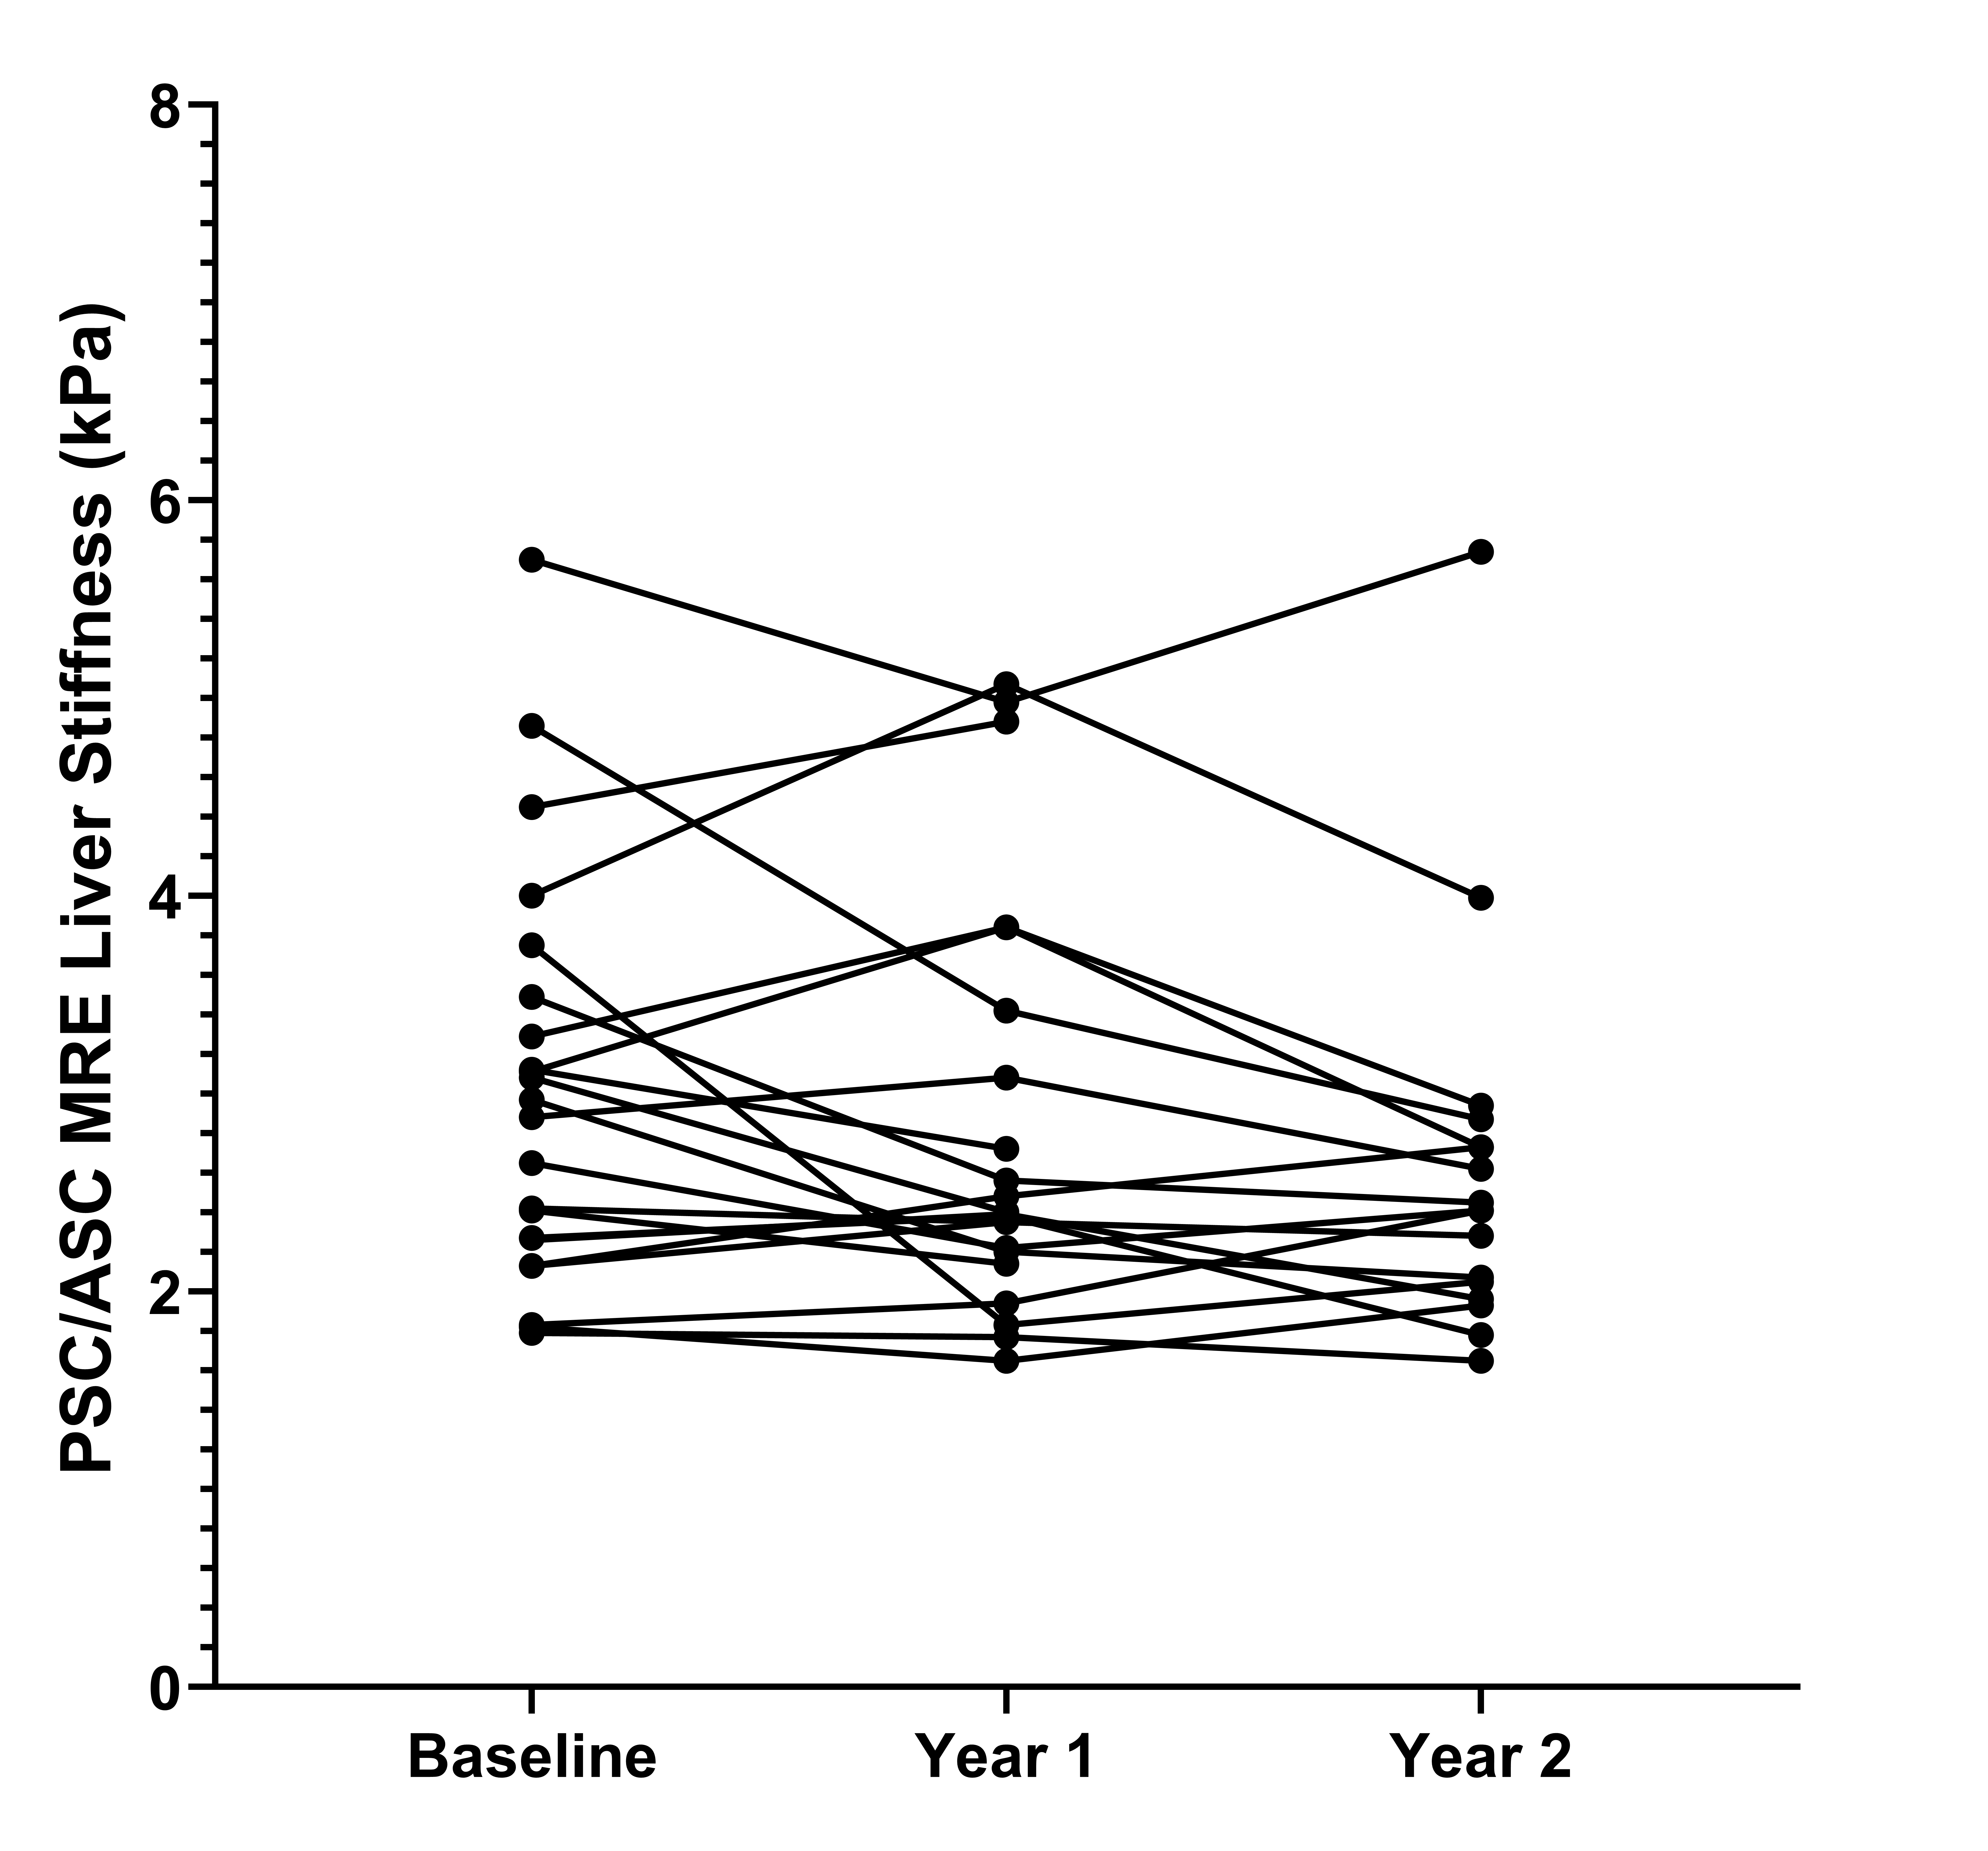
Study participants were grouped into two cohorts due to similarities in outcomes and cholangiographic findings, 1) AIH and 2) PSC / ASC1. There were 36 patients in the AIH cohort and 31 patients in the PSC / ASC cohort. The mean (standard deviation) patient age was 18.3 (4.5) years in the AIH cohort and 17.1 (3.6) years in the PSC / ASC cohort. There were 18 males and 18 females in the AIH cohort and 21 males and 10 females in the PSC / ASC cohort. One-way ANOVA results are presented in Figure 2. A box plot demonstrating change in measurements over time and a dot-line diagram showing individual patient trajectories for the MRE-derived liver stiffness in the PSC / ASC group are presented in Figures 3 and 4. There were no statistically significant changes in MRE or cT1 measurements over time, although near significant trends were observed (p=0.07-0.08).Discussion
Over a two year period in pediatric and young adult patients with AILD, no significant longitudinal changes in liver cT1 measurements or MRE-derived liver and spleen stiffness were observed in our sample population. However, near significant trends were observed in liver stiffness in the PSC / ASC cohort and spleen stiffness in the AIH cohort (p-values: 0.065 and 0.082, respectively). Additionally, unique individual trends were exhibited by the patients in both the AIH and PSC / ASC cohorts for each MRI biomarker. A prior study by Corpechot et al.8 demonstrated that patients with less severe PSC (fibrosis stages 0 and 1) experienced little to no increase in liver stiffness while patients with moderate to severe PSC (fibrosis stages 2 to 4) showed significant increases in liver stiffness over time. While our results do not reach statistical significance, increasing the cohort size, extending the follow-up time, and organizing the analysis by fibrosis stage in the PSC / ASC cohort in future studies may provide clinically meaningful results. Another prior study by Dillman et al.9 showed that MRE-derived spleen stiffness could predict the presence of radiologic portal hypertension (area under the curve 0.96) and thus suggests that change over time in MRE-derived spleen stiffness might predict liver disease progression. Although our study failed to demonstrate this, this may be attributed to a lack of power and suggests the need for further investigation with larger cohort sizes and longer longitudinal follow-up.Conclusion
Our preliminary results from a small pediatric AILD cohort did not demonstrate significant changes in cT1 and MRE-derived liver and spleen stiffness values over a 2 year period, although changes were observed at the individual level. Further investigations, with larger cohorts and additional follow-up time points, are needed to expand on our results and further assess whether these metrics will serve as meaningful markers of liver disease progression and outcomes in the clinical setting, both at the individual patient and population levels.Acknowledgements
Perspectum Ltd. provided in-kind research support in the form of analyses for the measurement of iron-corrected liver T1 (cT1) relaxation times through a formal research agreement.
Partial financial support was received from the Cincinnati Children's Hospital Medical Center's (CCHMC) 1) Center for Autoimmune Liver Disease and 2) Center for Translational Fibrosis Research.
References
1. Deneau M, Jensen MK, Holmen J, et al. Primary sclerosing cholangitis, autoimmune hepatitis, and overlap in Utah children: epidemiology and natural history. Hepatology. 2013;58(4):1392-400.
2. Banerjee R, Pavlides M, Tunnicliffe EM, et al. Multiparametric magnetic resonance for the non-invasive diagnosis of liver disease. J Hepatol. 2014;60(1):69-77.
3. Bookwalter CA, Venkatesh SK, Eaton JE, et al. MR elastography in primary sclerosing cholangitis: correlating liver stiffness with bile duct strictures and parenchymal changes. Abdom Radiol (NY). 2018;43(12):3260-70.
4. Pavlides M, Banerjee R, Sellwood J, et al. Multiparametric magnetic resonance imaging predicts clinical outcomes in patients with chronic liver disease. J Hepatol. 2016;64(2):308-15.
5. Tafur M, Cheung A, Menezes RJ, et al. Risk stratification in primary sclerosing cholangitis: comparison of biliary stricture severity on MRCP versus liver stiffness by MR elastography and vibration-controlled transient elastography. Eur Radiol. 2020;30(7):3735-47.
6. Nedredal GI, Yin M, McKenzie T, et al. Portal hypertension correlates with splenic stiffness as measured with MR elastography. J Magn Reson Imaging. 2011;34(1):79-87.
7. Takuma Y, Nouso K, Morimoto Y, et al. Portal Hypertension in Patients with Liver Cirrhosis: Diagnostic Accuracy of Spleen Stiffness. Radiology. 2016;279(2):609-19.
8. Corpechot C, Gaouar F, El Naggar A, et al. Baseline values and changes in liver stiffness measured by transient elastography are associated with severity of fibrosis and outcomes of patients with primary sclerosing cholangitis. Gastroenterology. 2014;146(4):970-9; quiz e15-6.
9. Dillman JR, Serai SD, Trout AT, et al. Diagnostic performance of quantitative magnetic resonance imaging biomarkers for predicting portal hypertension in children and young adults with autoimmune liver disease. Pediatr Radiol. 2019;49(3):332-41.
Figures