2102
Quantitative 4D flow vessel estimation using conventional (aorta 4D flow) and whole heart 4D flow sequence.1Department of NMR, All India Institute of Medical Sciences, New Delhi, India, 2Department of Cardiology, All India Institute of Medical Sciences, New Delhi, India
Synopsis
Quantification of blood flow parameter is crucial for assessment of dynamic stability across cardiac vascular system. 4D flow provide systemic estimation of such parameter without requirement of contrast in a single acquisition. Technical limitation of 4D flow restrict dynamic estimation to either heart (LV/RV) or across large vessels due to venc differential. Estimation of large vessel (while retaining the cardiac dynamics) can be assessed accurately with flow estimation using flow velocity and pressure gradient. Choice of parameters is crucial in limited temporal frame using valve/vessel optimised sequence.
Introduction
Flow of blood across vessels and heart is dynamic and heterogenous in nature, as flow irregularity is associated with cardiac cycle. 4Dflow is a 3D phase magnitude imaging method to record flow, estimate the quantitative parameters and visualise1. It allows estimation of structural and functional aspect of heart across a single measurement. Its limitation is assessment of vessels (large) only. we assessed a flow metric sequence optimised for aorta estimation (only) and a sequence modified to acquire whole heart, to assess aortic flow quantification parameters (as a pilot model), such that the underlying variation associated to flow quantification parameters are parametric when field of view and venc constraints are orthogonalized to whole heart dynamics. We targeted appropriate methods across aorta, elucidating changes associated with flow estimation across region of interest (aorta/LV/RV/whole heart), that may undermine the prognosis of cardiac disorders.Method
Healthy volunteers (n=4) in age range 25-45 years were recruited and were screened for cardiovascular disease, any medication, and contraindication for cardiac magnetic resonance imaging (CMR). Study was conducted on a 1.5T MR scanner (MAGNETOM Aera, Siemens Healthcare GmbH, Erlangen, Germany), with two conventional 4D flow acquisition approaches using prototype sequence provided by Siemens Healthcare GmbH, Germany. An aorta specific 4D flow imaging sequence with rectangular slab in sagittal oblique orientation using an axial haste reference scan with phase encoding in AP direction, and a whole heart 4D flow in sagittal orientation with inclusion of aortic arch, free breathing and retrospective ECG gating. Number of slices and field of view (FOV) were adjusted for each subject. VENC scout for each individual was adjusted with support from an experienced radiographer. A respiratory motion compensation was established using pencil beam navigator across both sequence which uses an echo planer based 2D RF excitation to restrict interference for acquisition volume. Motion compensation was done using ReCAR method of k-space filling at centre during end-expiration and outer k-space during inspiration using the beam RF navigator.Data processing for 4D flow phase-magnitude data was done using 4D Flow demonstrator software version 2.4 (a prototype provided by Siemens Healthineers, Germany). Data was pre-processed for background phase correction within phase-contrast images for optimisation of velocity field. Phase anti-aliasing and motion tracking were employed for VENC overestimation correction and deformation field generation for further vessel models analysis. To estimate quantification using segmentation, a seed point was placed at centre of aortic root (ascending aorta up to aortic arch) for automated vessel extraction. Four contours each across aortic root, four within ascending aorta (1-1.5 cm from aortic root) and two near aortic arch were created for flow estimation. Time resolved analysis, identical for both aorta and WH flow sequences, was carried out across the contour planes. As flow parameter are expected to be a non-parametric quantity, correlation analysis within two group (aorta/whole heart) across defined planes were computed for quantification. A time integrated averaging approach was used to estimate net value across cardiac cycles.
Result
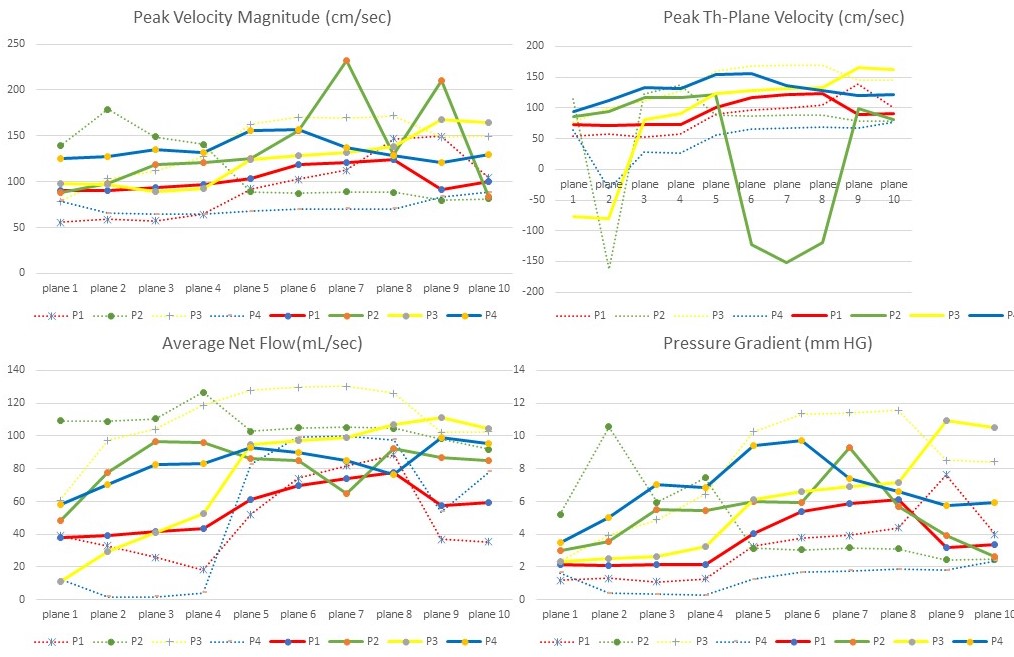
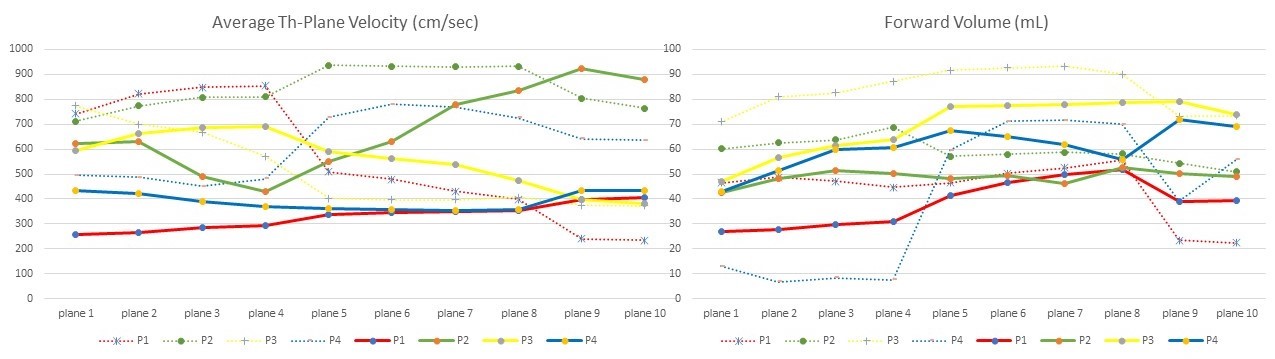
A total of 14 parameters (area, volume, peak velocity, magnitude, pressure gradient etc.) were computed. A threshold of (>0.5) within 2 or more subjects was used for attenuation of confounding parameter. Peak Th-Plane Velocity (cm/sec), Peak Velocity Magnitude (cm/sec), Average Net Flow(mL/sec) and Pressure Gradient (mm HG) parameters revealed variation with positive correlation (>0.5) across aorta and whole heart (WH) sequence for the segmented aorta vessel plane. Subjects 2,4 (P2 and P4 in figures 1 and 2) exhibited variation across all the parameters and lower correlation value in comparison with that in subjects 1,3. Average th-plane and forward volume parameter did not reveal correlation across the aorta and WH sequences.Discussion
Flow (velocity and magnitude) and pressure gradient are significant parameters for valve stenosis, aortic aneurysm, pulmonary hypertension, etc2–5. Estimation of dynamic flow across whole heart (inclusive of aorta) is a complex task due to venc differential across valves and aortic root. Expansion of aortic flow sequence (with respiratory flow compensation using pencil beam navigator) to WH sequence may yield accurate flow parameters with good correlation value. Average through plane and forward volume showed promising trend, though not significant (figure 2) which may be due to inaccurate venc acquisition that varies across subjects. Regurgitation fraction, one of the parameters for backflow and valve assessment across LV/RV remained non-significant across the sequences, suggesting stringent parameter check for valve assessment. Estimation of flow and pressure gradient parameters provided positive result, highlighting use of holistic view of whole heart, if required, without compromising of flow estimation.Conclusion
4D flow sequence utilising whole heart acquisition can be utilised for varied flow quantification parameters such as velocity, magnitude and pressure gradient to assess cardiac vascular disorders. Regurgitation fraction across valve may require a more precise venc and stringent phase/FOV encoding with 4Dflow CMR sequence.Acknowledgements
Author (s) would like to acknowledge the scientific and technical support provided by Dr. Dileep Kumar (Manager, Research and Collaborations) of Siemens Healthcare Private Limited, India.References
1. François, C. J., Markl, M., Schiebler, M. L., Niespodzany, E., Landgraf, B. R., Schlensak, C., & Frydrychowicz, A. (2013). Four-dimensional, flow-sensitive magnetic resonance imaging of blood flow patterns in thoracic aortic dissections. The Journal of Thoracic and Cardiovascular Surgery, 145(5), 1359–1366. https://doi.org/10.1016/j.jtcvs.2012.07.019
2. Hsiao, A., Tariq, U., Alley, M. T., Lustig, M., & Vasanawala, S. S. (2015). Inlet and outlet valve flow and regurgitant volume may be directly and reliably quantified with accelerated, volumetric phase-contrast MRI. Journal of Magnetic Resonance Imaging : JMRI, 41(2), 376–385. https://doi.org/10.1002/jmri.24578
3. Mahadevia, R., Barker, A. J., Schnell, S., Entezari, P., Kansal, P., Fedak, P. W. M., Malaisrie, S. C., McCarthy, P., Collins, J., Carr, J., & Markl, M. (2014). Bicuspid aortic cusp fusion morphology alters aortic three-dimensional outflow patterns, wall shear stress, and expression of aortopathy. Circulation, 129(6), 673–682. https://doi.org/10.1161/CIRCULATIONAHA.113.003026
4. Rademakers, F. E., & Claus, P. (2014). Imaging hemodynamics: the next frontier for CMR. JACC. Cardiovascular Imaging, 7(9), 927–929. https://doi.org/10.1016/j.jcmg.2014.06.011
5. Sträter, A., Huber, A., Rudolph, J., Berndt, M., Rasper, M., Rummeny, E. J., & Nadjiri, J. (2018). 4D-Flow MRI: Technique and Applications. RoFo : Fortschritte Auf Dem Gebiete Der Rontgenstrahlen Und Der Nuklearmedizin, 190(11), 1025–1035. https://doi.org/10.1055/a-0647-2021
Figures