2094
Evaluating Pilot Tone and self-gating for retrospective cardiac binning in highly accelerated, whole heart 4D flow imaging1The Ohio State University, Columbus, OH, United States, 2Siemens Medical Solutions USA, Inc., Columbus, OH, United States, 3Siemens Healthcare GmbH, Erlangen, Germany
Synopsis
In this work, we incorporate Pilot Tone as part of our previously described highly accelerated and fully self-gated 4D flow framework to perform retrospective cardiac binning. We compare cardiac triggers derived from Pilot Tone directly with those derived from self-gating and ECG in and demonstrate agreement in aortic and pulmonary artery flow quantification between 4D flow images reconstructed us ECG-, SG-, and PT-based cardiac binning.
Introduction
Modern innovations in highly accelerated, free-running 4D/5D cardiac acquisitions have predominantly relied on techniques such as self-gating (SG) as alternative means to quantify and compensate for physiological motion without requiring the use of ECG or respiratory navigators.1 While SG has been used widely for such applications, the need to repetitively reacquire identical k-space central points or trajectories inherently limits its generalizability beyond specialized pulse sequences and reduces the acquisition efficiency. Recently, the novel Pilot Tone technology has been proposed,2 which leverages an externally transmitted RF signal to obtain surrogates for respiratory3 and cardiac4 motions and does not require explicit pulse sequence modification. In this work, we compare the precision cardiac trigger estimation derived from PT and SG and evaluate the feasibility of incorporating PT into our previously described highly accelerated, fully self-gated 4D flow framework5 for retrospective cardiac binning.Methods
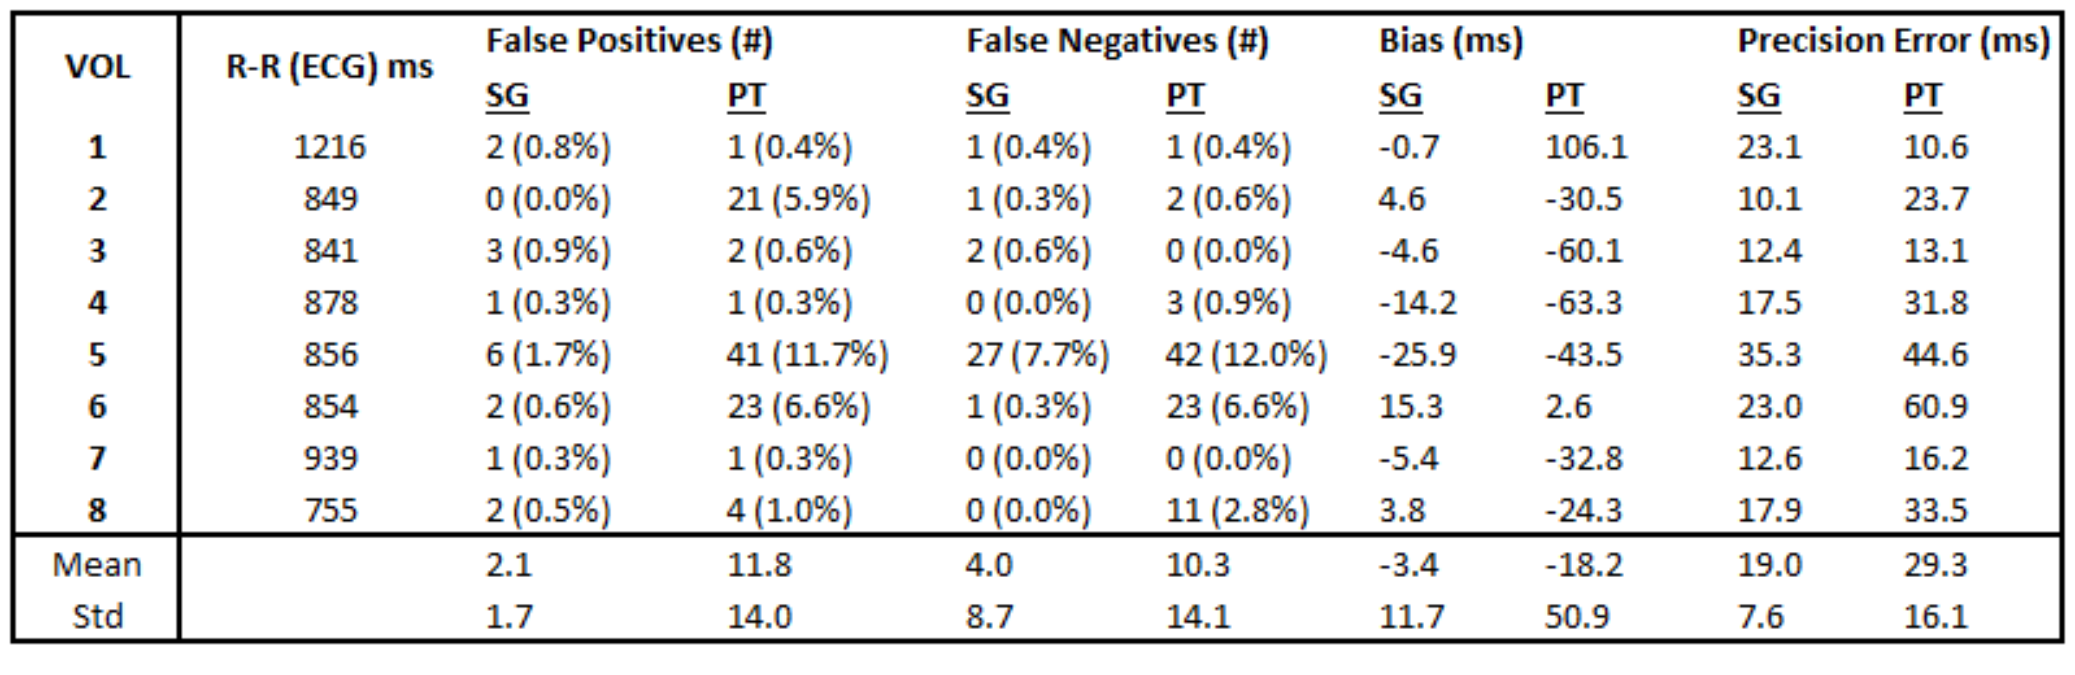
Eight healthy subjects were prospectively recruited for this study in accordance with institutional guidelines. Imaging was carried out on a 1.5T clinical scanner (MAGNETOM Sola, Siemens Healthcare, Erlangen, Germany) equipped with a dedicated Pilot Tone RF transmitter embedded within the 12-channel chest receive array. All subjects were scanned using a prototype self-gated 4D flow sequence5 with sagittal whole-heart coverage. Acquisition parameters for 4D flow were as follows: FOV = 240-288 mm x 240-288 mm x 140-168 mm, spatial resolution = 2.5-3.0 mm isotropic, TR = 4.6-4.7 ms, TE = 2.6-2.7 ms, flip angle = 7⁰, and Venc = 150 cm/s. Scans were acquired for approximately 570 s. Throughout the 4D flow scan, synchronous raw ECG, SG, and PT signals were obtained. As reference, breath-held phase-contrast (2D-PC) images were subsequently acquired transecting the ascending aorta (Aao) and main pulmonary artery (MPA) using routine clinical parameters and retrospective ECG gating.To obtain cardiac triggers, the interleaved SG readout lines (~42 ms) and PT signals (~4.7 ms) were processed using a prototype algorithm developed in Matlab (Mathworks, Natick, WA). First, SG and PT signals were extracted from the raw data and band-pass filtered (0.5 Hz to 3 Hz). Filtered data underwent principal component analysis followed by independent component analysis; cardiac surrogate signals were automatically chosen from among these components using spectral analysis. Peak-detection via computation of interpolated zero-crossings yielded cardiac triggers for subsequent binning. Cardiac triggers derived from SG and PT were additionally compared with respect to ECG through the following metrics: false positive rate, false negative rate, bias, and precision error. Briefly, false positives represent erroneous SG/PT triggers without corresponding ECG trigger, false negatives represent triggers capture by ECG but not SG/PT, bias is the systemic temporal shift between SG/PT and ECG triggers, and precision error is the standard deviation of the pairwise difference between corresponding SG/PT and ECG triggers. Respiratory motion surrogates were derived from the raw SG signals using a combination of temporal low pass filtering (0.5 Hz) followed by PCA and used to derive respiratory weights incorporated into image reconstruction.6 Weights were fixed at 50% respiratory efficiency and centered at the end-expiratory phase.
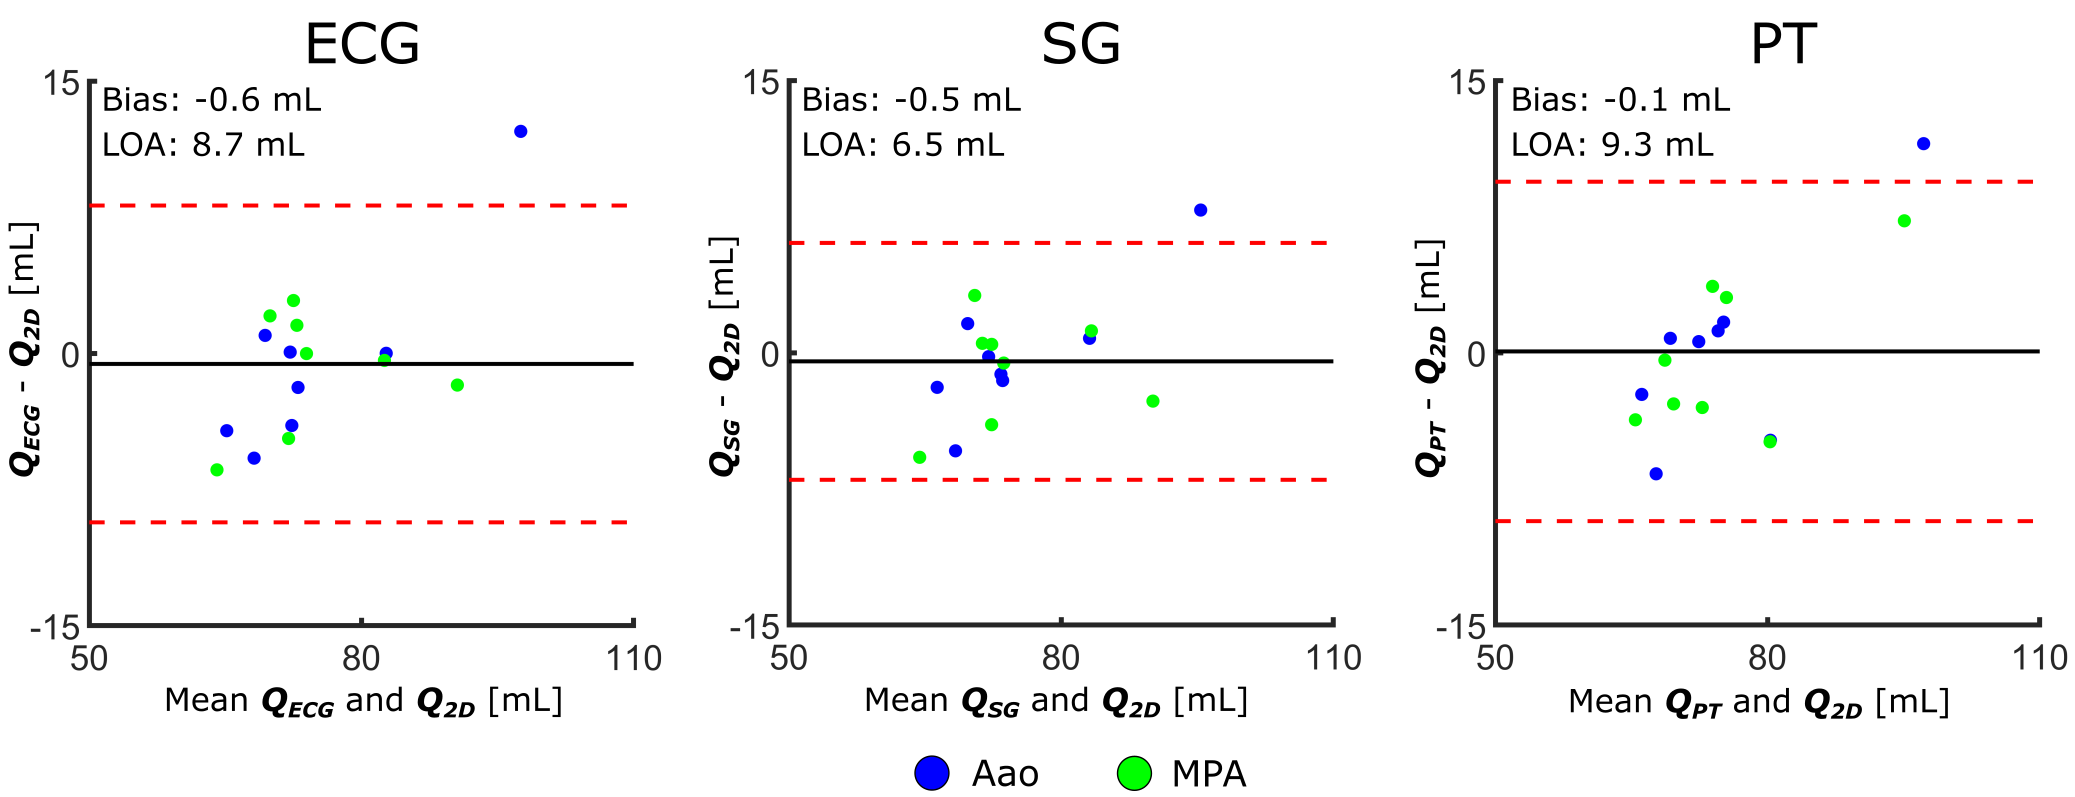
Before reconstruction, all undersampled 4D flow scans were cropped to a 5-minute segments and binned using ECG, SG, and PT into 20 cardiac phases. The binned and weighted k-space were reconstructed at R = 22.0 – 23.1 using ReVEAL4D,7 which, in addition to enforcing wavelet sparsity, explicitly models the magnitude and phase relationships across encodings. To assess the impact of cardiac binning on flow quantification, net volumetric flow was computed across the Aao and MPA for 2D-PC and ECG-, SG-, and PT-derived 4D flow reconstructions and evaluated using Bland-Altman analysis.
Results
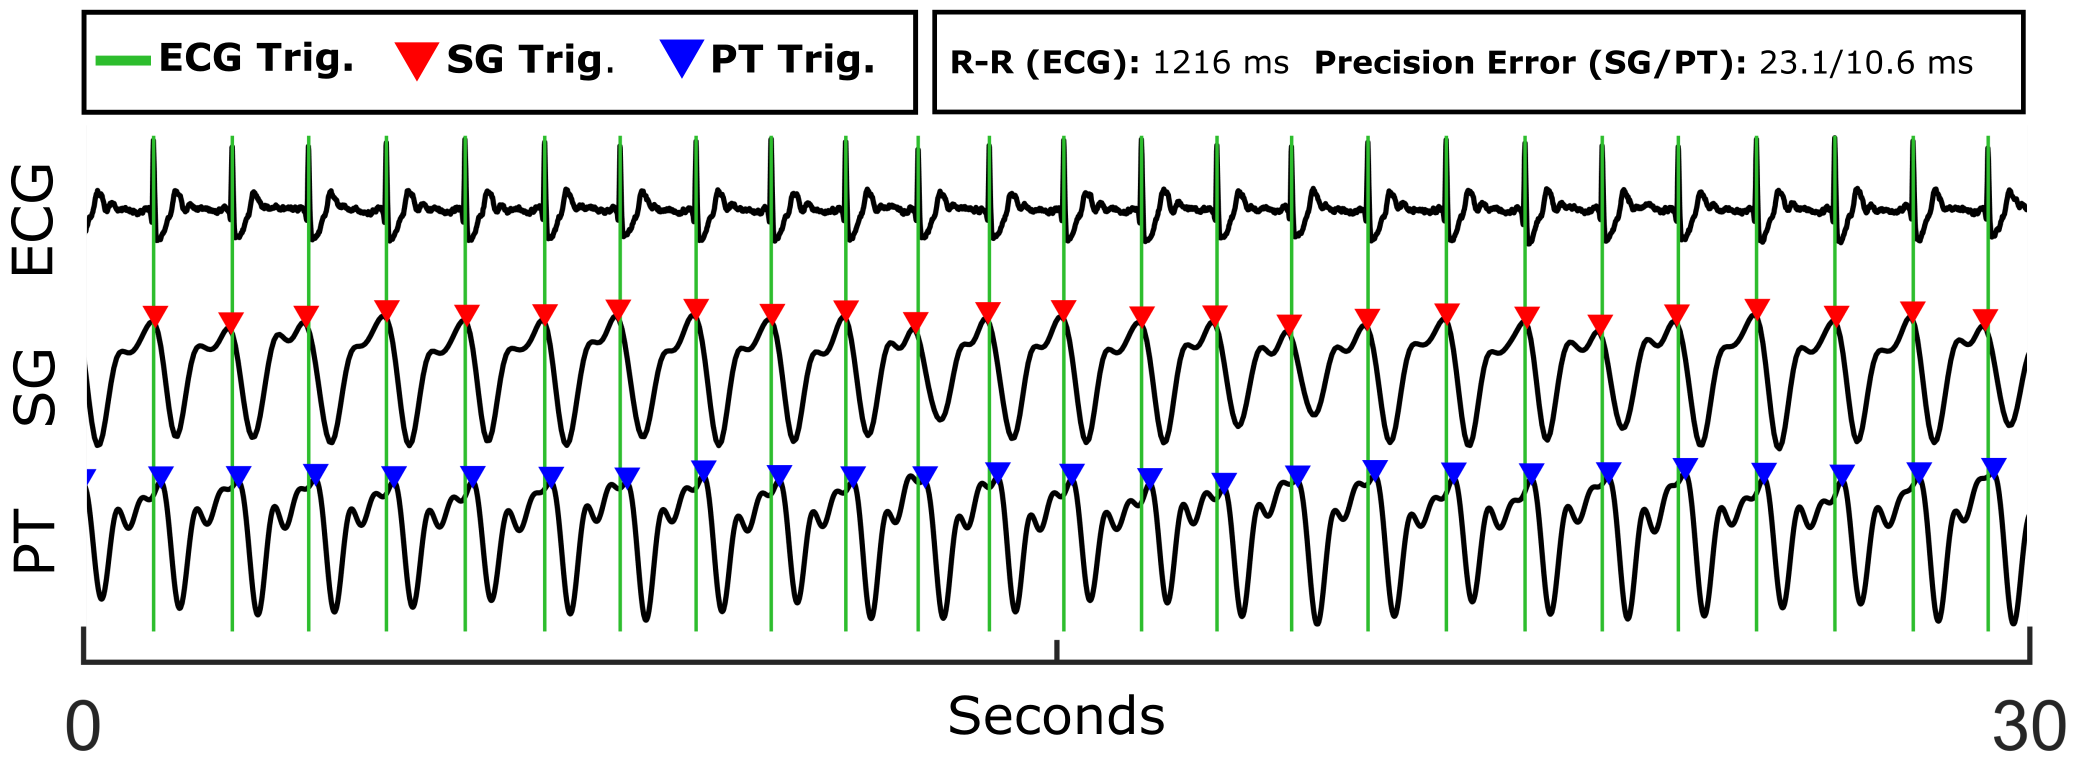
Across all subjects, cardiac triggers derived from PT yield a moderately greater false positive rate with respect to ECG than SG, with PT and SG on average accounting for 11.8 and 2.1 false positive triggers, respectively. Similarly, PT-derived triggers exhibit increased false negatives compared with SG, with a mean of 10.3 and 4.0 false negatives, respectively. Triggers from both PT and SG show small negative biases with respect to ECG, with means of -18.2 ms for PT and -3.4 ms for SG. Trigger precision error was found to be slightly higher for PT, but still acceptable, at 29.3 ms for PT compared with 19.0 ms for SG. Further analysis is presented in Table 1. Signals and cardiac triggers for ECG, SG, and PT are shown in Figure 1 for one representative subject. Figure 2 depicts Bland-Altman plots comparing the aggregate Aao and MPA net volumetric flow quantified from reconstructed 4D flow images binned using ECG (QECG), self-gating (QSG), and Pilot Tone (QPT) with flow derived from the 2D-PC reference (Q2D). Overall, flow quantification derived from SG and PT yields good agreement with the 2D-PC reference as well as similar agreement as ECG, suggesting comparable and accurate binning of the 4D flow data from both methods.Conclusions
This early data suggests that PT-derived cardiac triggers may provide sufficiently precise estimation of the cardiac cycle and allow for comparable quantification when paired with highly accelerated 4D flow as compared with ECG and SG.Acknowledgements
This work was supported by NIH R01HL135489.References
[1] Feng et al. XD‐GRASP: Golden‐angle radial MRI with reconstruction of extra motion‐state dimensions using compressed sensing. Magn Reson Med. 2016;75: 775-788.
[2] Speier et al. PT-Nav: A Novel Respiratory Navigation Method for Continuous Acquisition Based on Modulation of a Pilot Tone in the MR-Receiver. In Proc. ESMRMB. 2015;129:97-98.
[3] Solomon et al. Free-breathing radial imaging using a pilot-tone radiofrequency transmitter for detection of respiratory motion. Magn Reson Med. 2020;00:1-14. https://doi.org/10.1002/mrm.28616.
[4] Bacher et al. Model-Based Lag Free Processing of Pilot Tone Navigator Data Enables Prospective Cardiac Triggering. In Proceedings of the 26th Annual Meeting of ISMRM:2018:4913.
[5] Pruitt et al. Full self-gated whole-heart 4D flow imaging from a 5-minute scan. Magn Reson Med. 2020;85:1222-1236.
[6] Cheng et al. Free-breathing pediatric imaging with nonrigid motion correction and parallel imaging. In Proceedings of the 21st Annual Meeting of the ISMRM. 2013; p312.
[7] Rich et al. A Bayesian approach for 4D flow imaging of aortic valve in a single breath‐hold. Magn Reson Med. 2019; 81: 811– 824.
Figures