2093
Evaluating ICOSA6 4D-Flow in a Compliant Aortic Dissection Model with Large Velocity Range and Complex Flow Patterns.1Radiology, Stanford University, Stanford, CA, United States, 2Computer Science, Technical University of Munich, Munich, Germany, 3Radiology, Veterans Affairs Health Care System, Palo Alto, CA, United States, 4Bioengineering, Stanford University, Palo Alto, CA, United States, 5Pediatrics, Stanford University, Stanford, CA, United States, 6Bioengineering, Stanford University, Stanford, CA, United States, 7Cardiovascular Institute, Stanford University, Stanford, CA, United States
Synopsis
Goal: To assess flow quantitation with multi-directional (ICOSA6) high-moment 4D-flow in a compliant type-B aortic dissection model that provides complex flow and a large velocity range. An in vitro flow setup was designed to acquire prolonged 4D-flow imaging in a flow- and pressure-controlled environment. ICOSA6 4D-flow data was acquired with a highly-sampled stack-of-stars scheme, reconstructed with varying under-sampling factors (R=5-65), and compared to a four-point Cartesian-sampled 4D-flow sequence. Results showed average net flow difference within the ±5% margin for ICOSA6 data under-sampled with up to R=40. Peak velocity, however, differed greatly for all ICOSA6 data when compared to four-point Cartesian.
Introduction
The treatment of patients with type-B aortic dissection (TBAD) is largely based on morphologic imaging findings.1 However, flow parameters in the true and false lumen (TL, FL) may confer added sensitivity of individual risk. 4D-flow MRI2 can be used to estimate several flow parameters in TBAD cases.3–5 Typical TBAD flow, however, presents substantial flow pattern complexity including a large velocity range. Therefore, careful consideration should be made regarding 4D-flow acquisition parameters and the trade-offs that balance flow measurement accuracy and precision against exam time. The objective of this work was to use accelerated high spatial resolution ICOSA6 high-moment stack-of-stars 4D-flow in a TBAD model to determine the maximum acceleration factor that minimized errors in net flow and peak velocity within ±5%.Methods
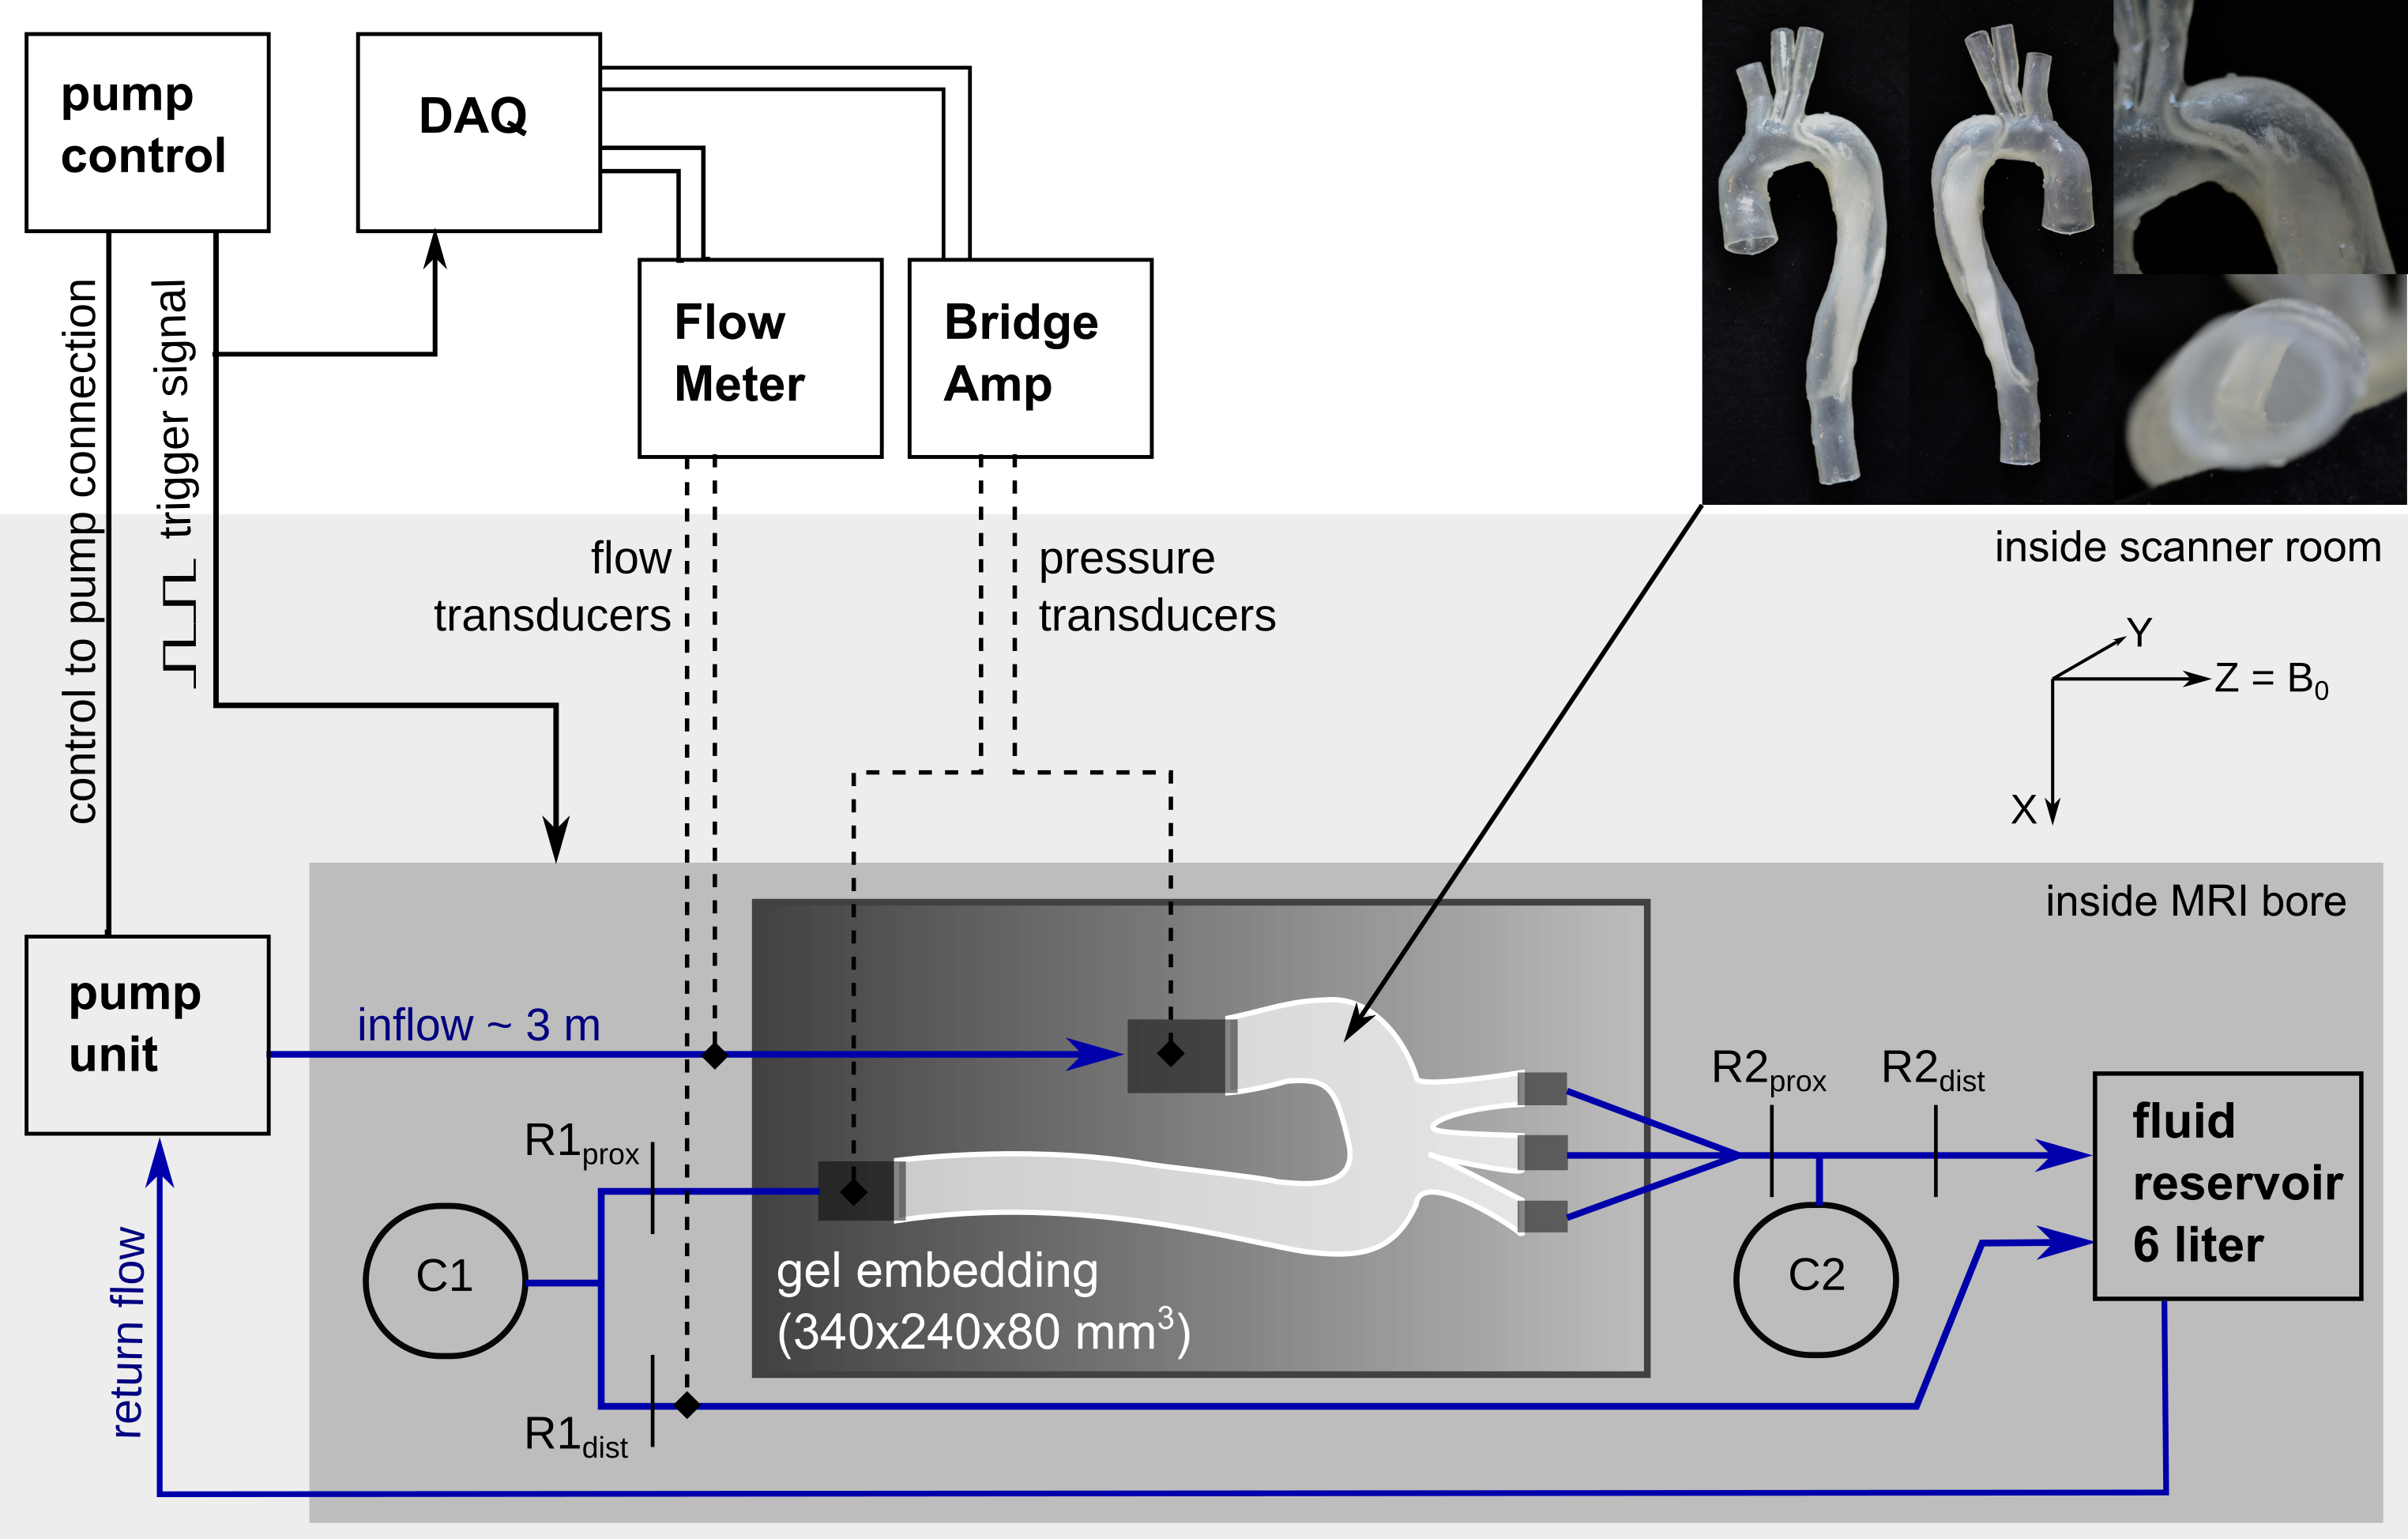
A patient-specific TBAD model with two aortic wall tears (entry and exit) was constructed and 3D-printed using a photopolymer material with wall elasticity similar to the human aortic wall.6 The model was embedded into a bio-mimicking pulsatile flow loop (Fig. 1) with HR = 60 bpm, stroke volume = 74.1 ml, and systolic/diastolic pressure = 124/68 mmHg.4D-flow data was acquired (3T Skyra, Siemens) using a multi-directional (ICOSA6) high-moment encoding scheme7 with a stack-of-stars k-space trajectory (FOV=360x360x90mm3; voxel size=1.5 mm3; TE/TR=3.3/6.2ms; 92,000 radial spokes per flow encode (corresponding to R=5 acceleration); VENC=±80cm/s; and retrospective binning with 20 frames/cycle). ICOSA6 datasets were reconstructed with parallel imaging and compressed sensing (using JSENSE coil maps8) as well as total variation regularizations in space and time, which were increased with under-sampling to keep similar image quality and apparent aliasing. Images were reconstructed to ±160 cm/s using a weighted non-convex velocity solver9. ICOSA6 data corresponded to the following scan times (in minutes): 67min (using 100% of radial spokes, R=5), 33min (50%, R=10), 17min (25%, R=20), 8min (12%, R=40), and 5min (7.5%, R=65). The latter two were each reconstructed with two different space-time regularization weighting pairs, leading to a total of seven ICOSA6 datasets. Regularization weighting pairs (λspace/λtime) were: 1E-3/1E-3, 2E-3/2E-3, 2.5E-3/5E-3, 5E-3/1E-2, 7.5E-3/1.25E-2 (referred to as Reg1, Reg2, Reg3, Reg4, and Reg5).
For reference, a four-point 4D-flow sequence with Cartesian k-space trajectory was acquired (FOV=340x236x84mm3; voxel size=1.5 mm3; TE/TR=2.7/5.6ms; k-lines/segment=2; parallel imaging (GRAPPA) with R=2; VENC=120 cm/s; retrospective binning with 20 frames/cycle). All data was corrected for Maxwell terms, gradient non-linearity9, and eddy-current phase offsets via 3rd order polynomial.
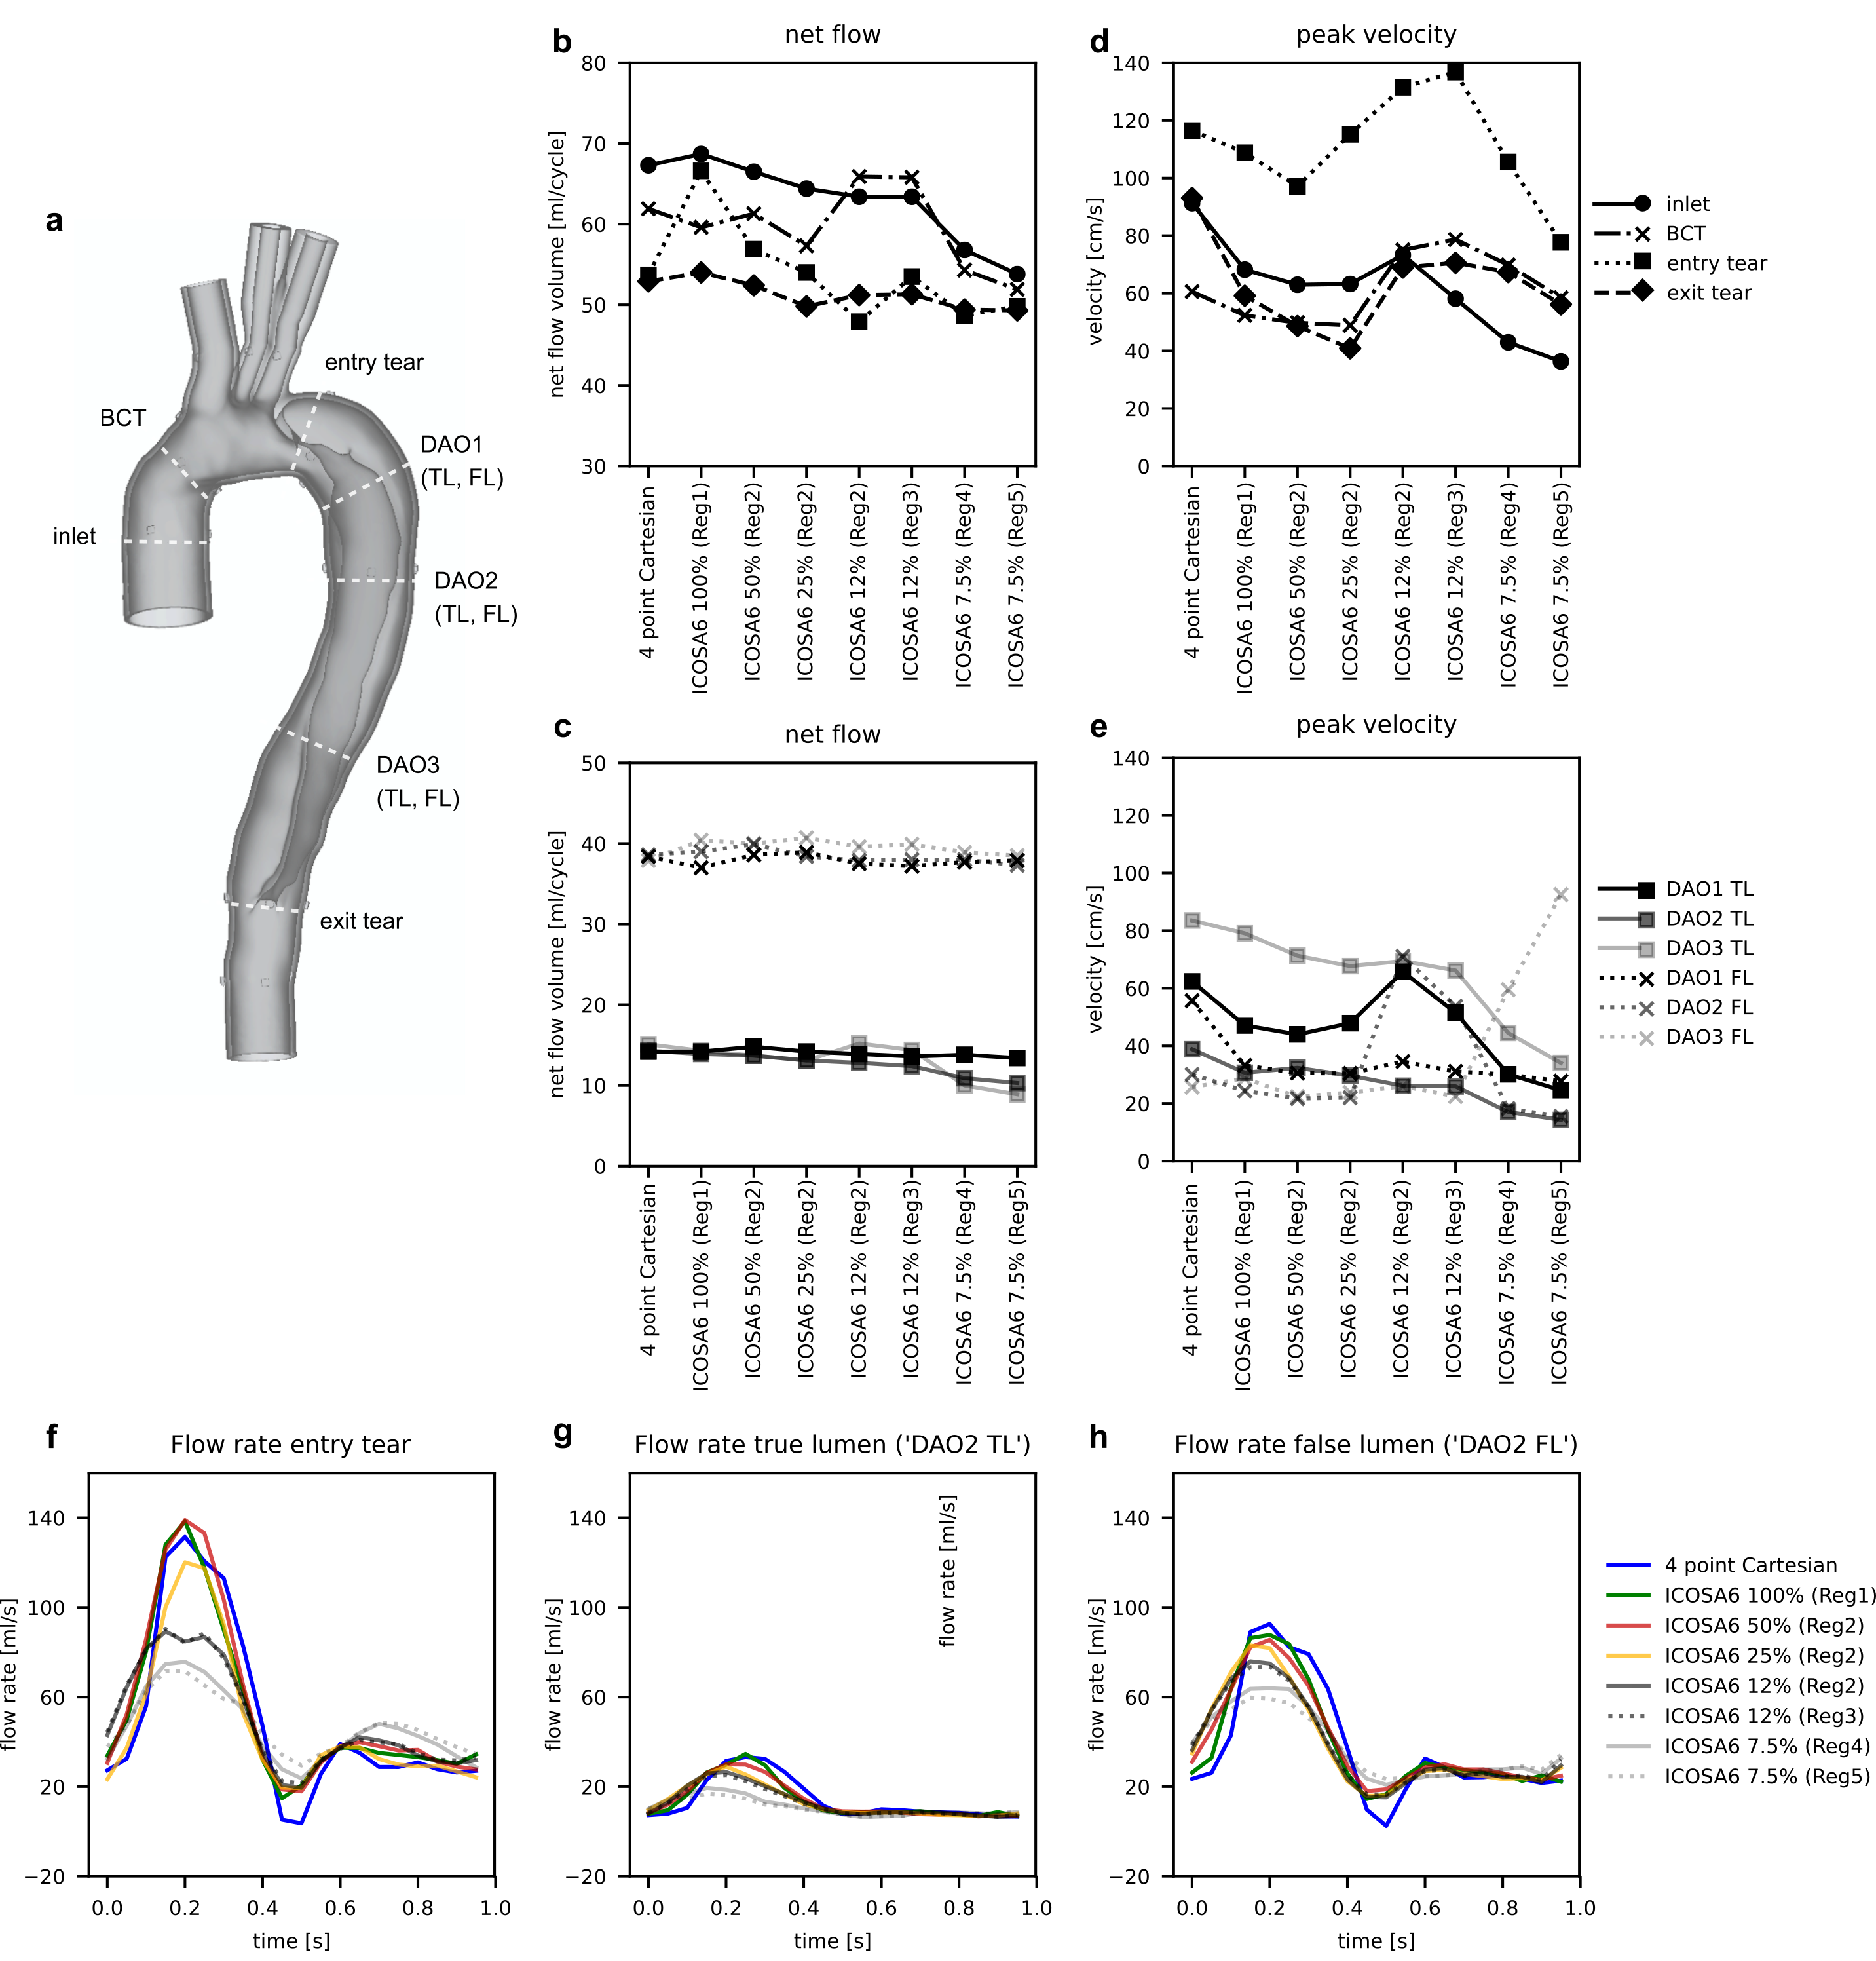
Cross-sectional lumen contours at selected landmarks (Fig. 3a) were generated on the four-point Cartesian magnitude image using a deformable registration approach10. Qualitative pathline tracing visualizations as well as net flow, peak velocity, and flow rate waveforms at cross-sections were compared between datasets. All analysis was done using MevisLab (v3.4a)11.
Results
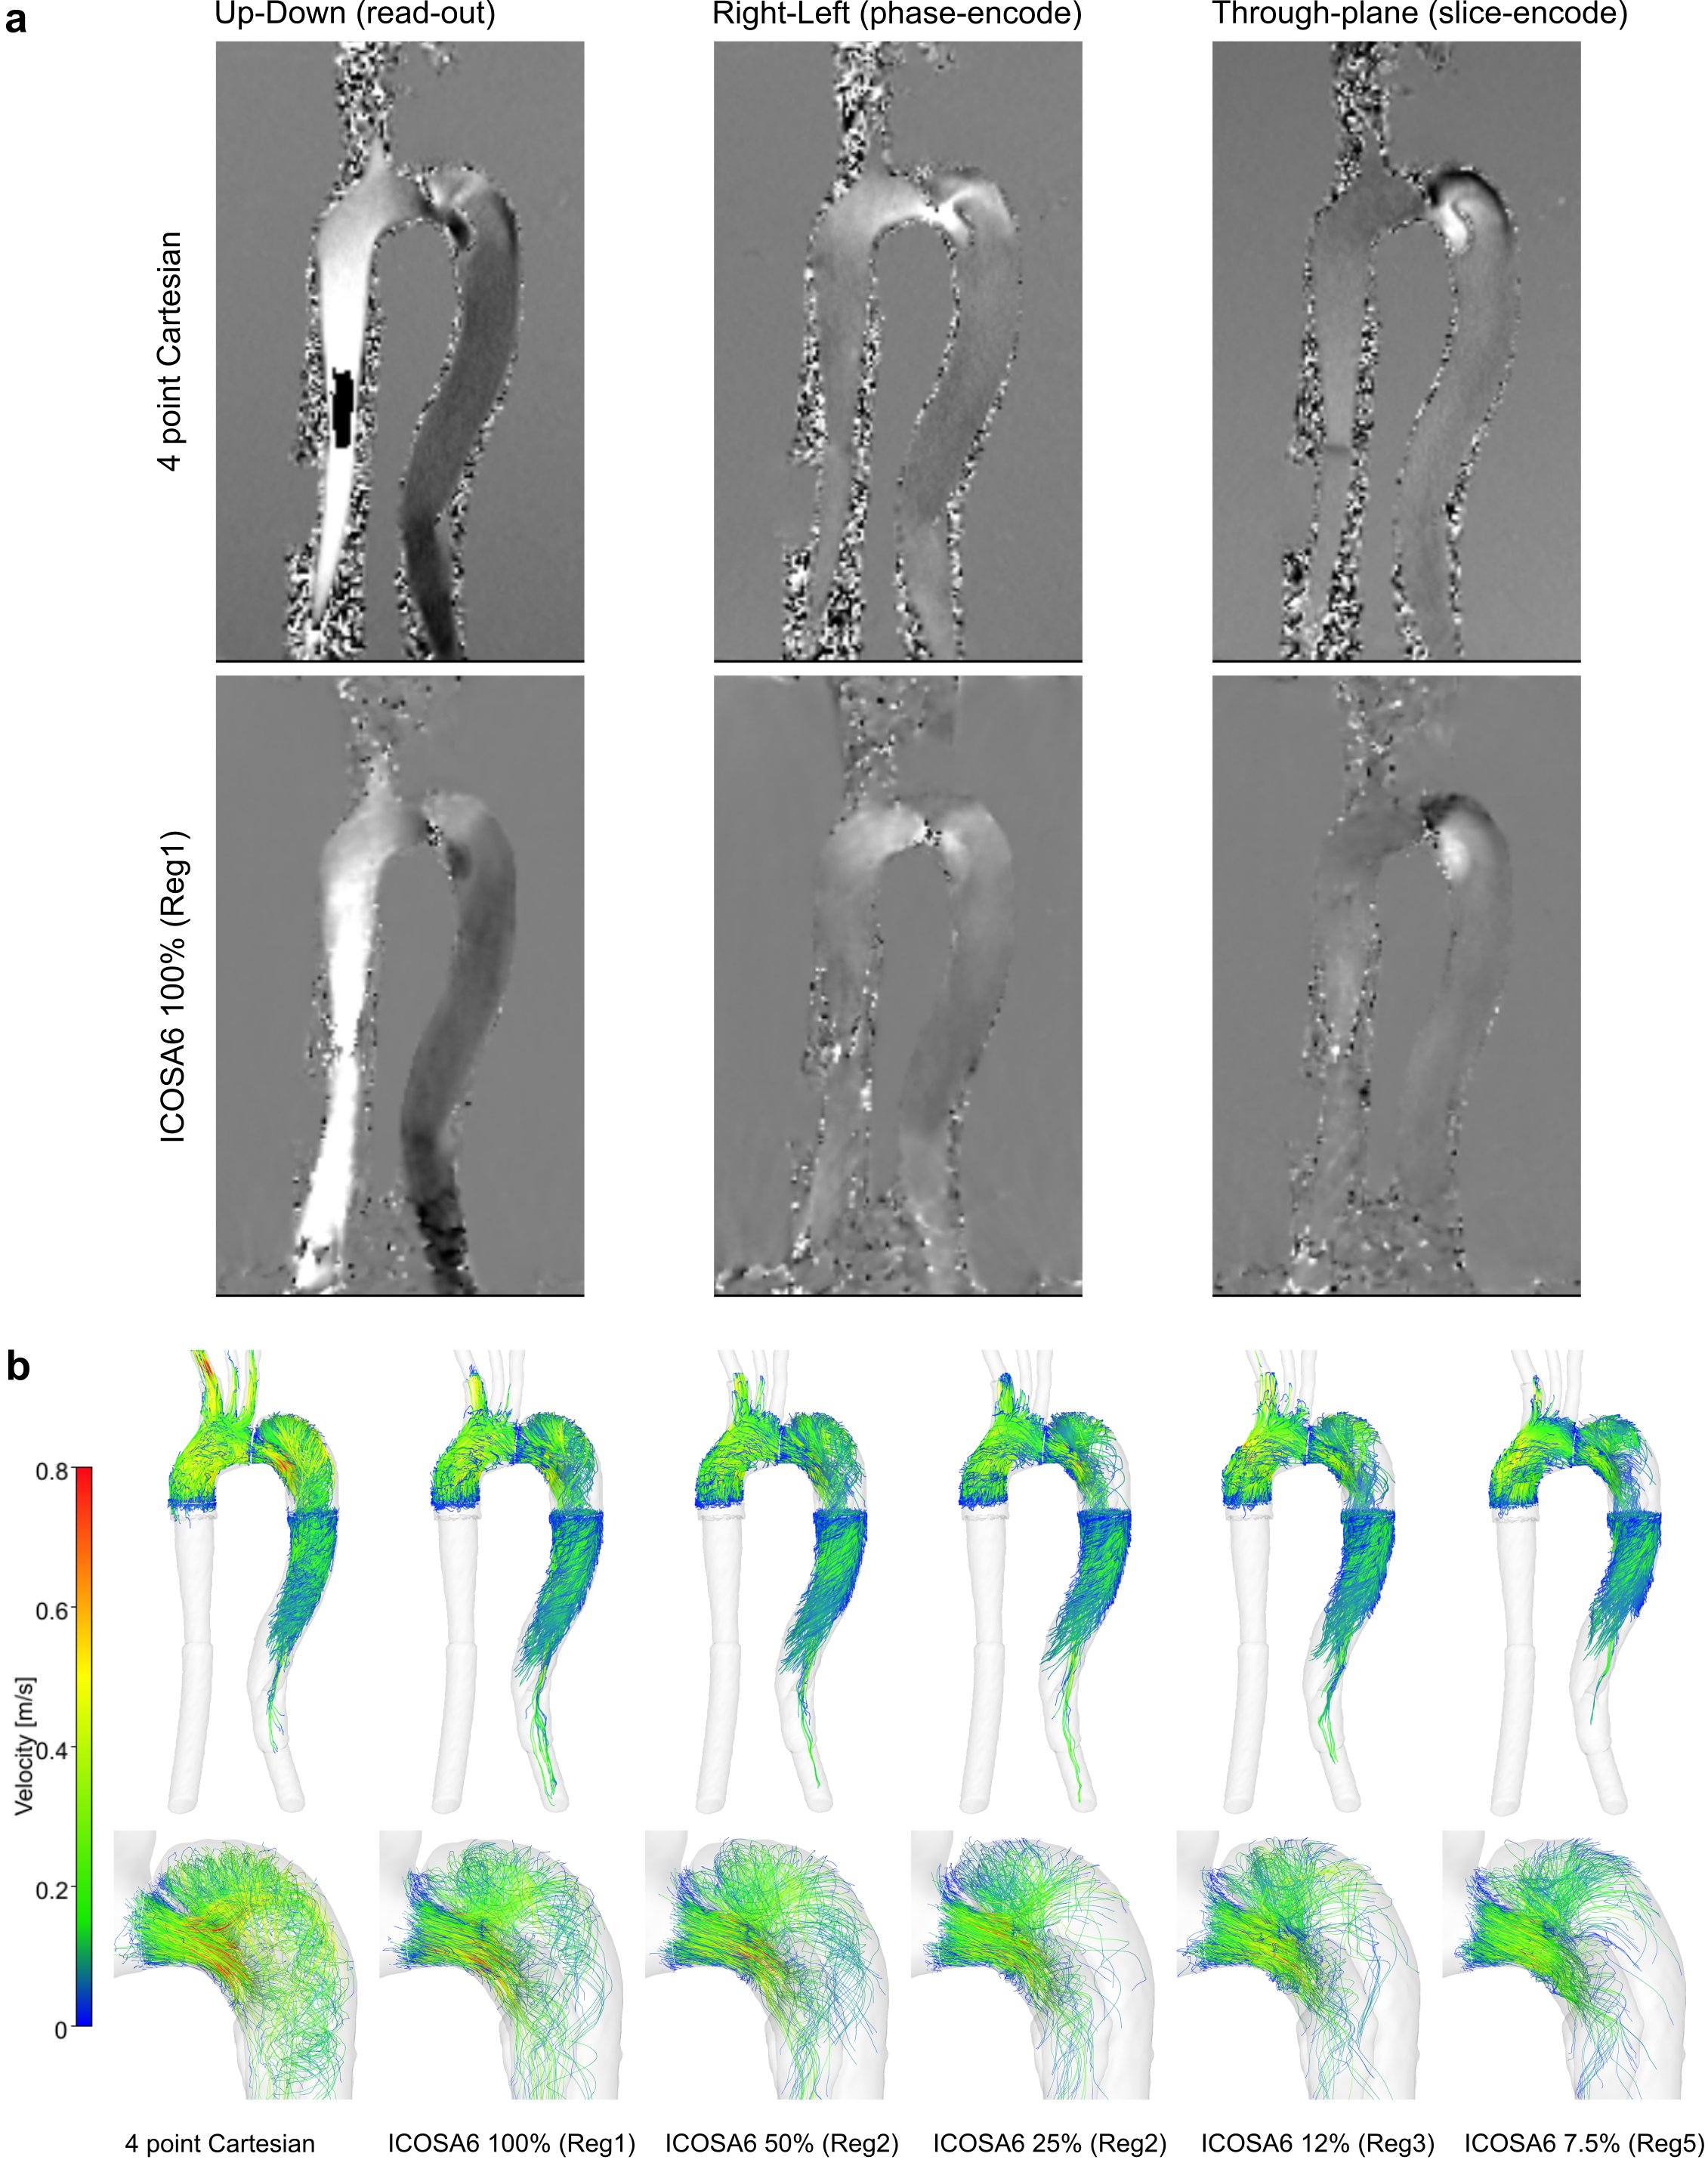
ICOSA6 high-moment encoding was reconstructed with very limited residual phase wrapping, but velocity data displayed some smoothing effects (over the entire FOV) and visible radial sampling artifacts (at FOV boundaries) when compared to four-point Cartesian data (Fig. 2). Overall, flow patterns in the TBAD model recapitulated in vivo patterns. Pathline tracing revealed helical flow patterns for all ICOSA6 data, but pathline travelling-range at end-diastole was decreased for ICOSA6 12% and 5% data.Fig. 3 displays flow volume and peak velocity errors for different under-sampling factors. When compared to four-point Cartesian for a range of slice locations, ICOSA6 net flow (reported as mean±SD %) differed by 2.0±8.1, 0.3±4.5, -3.0±5.6, -2.5±5.3, -2.4±5.3, -10.5±10.7, -12.8±12.8 for 100% (Reg1), 50% (Reg2), 25% (Reg2), 12% (Reg2), 12% (Reg3), 7.5% (Reg4), and 7.5% (Reg5) of radial spokes used. Likewise, peak flow velocities (i.e. maximum velocity through cross-section at peak-systole, reported as mean±SD %) differed by -18.1±14.6, -26.0±11.9, -25.3±15.4, 4.7±47.9, -6.3±35.9, -18.3±54.4, -15.8±93.5. Flow rate waveforms evaluated at three landmarks (Fig. 3f, 3g, 3h) showed an overall decrease in peak flow rates with increasing under-sampling. ICOSA6 100% (Reg1) and 50% (Reg2) were within the ±5% margin when compared to peak flow rates of four-point Cartesian data, and values were dampened by up to 49.1% for ICOSA6 7.5%.
Discussion
This work demonstrates the successful deployment of a 3D-printed patient-specific TBAD model with complex flow pattern in an in vitro setup to evaluate the effect of ICOSA6 under-sampling and how flow quantitation compares to four-point Cartesian data. Under-sampling down to 12% (R=40) of the acquired radial spokes measured average net flow volumes within the ±5% margin when compared to four-point Cartesian data. However, net flow standard deviations among all evaluated cross-sections showed larger disagreements in complex flow zones (e.g. ‘entry tear’). This emphasizes the importance of performing acceleration analyses using ‘patient-specific’ flow phantoms that include large velocity ranges and complex flow patterns, rather than simple tube phantoms. We note that sampling requirements - and thus scan time - were much higher compared to standard 4D-flow exams because of the high spatial resolution (1.5mm3), and the ICOSA6 velocity encoding, which requires seven velocity encodes instead of four. The 4D-flow Cartesian references scan was very long (42min) and accelerated schemes also need to be evaluated and compared. Likewise, regularization schemes for ICOSA6 and parameter tuning both require further investigation.Conculsion
Multi-directional high-moment 4D-flow compares well to Cartesian 4D-flow if performed with adequate sampling. Highly under-sampled (<12% of spokes, R>40) ICOSA6 4D-flow underestimates net flow and results in inaccurate peak velocity measurements.Acknowledgements
JZ received a scholarship from German Academic Exchange Service. DBE receives funding through NIH R01 HL131823.References
1. Nienaber CA, Clough RE, Sakalihasan N, et al. Aortic dissection. Nat Rev Dis Prim 2016;2.
2. Markl M, Chan FP, Alley MT, et al. Time-resolved three-dimensional phase-contrast MRI. J Magn Reson Imaging 2003;17:499-506.
3. Dillon-Murphy D, Noorani A, Nordsletten D, Figueroa CA. Multi-modality image-based computational analysis of haemodynamics in aortic dissection. Biomech Model Mechanobiol 2016;15:857-876.
4. de Beaufort HW, Shah DJ, Patel AP, et al. Four-dimensional flow cardiovascular magnetic resonance in aortic dissection: Assessment in an ex vivo model and preliminary clinical experience. J Thorac Cardiovasc Surg 2019;157:467-476.
5. Liu D, Fan Z, Li Y, et al. Quantitative Study of Abdominal Blood Flow Patterns in Patients with Aortic Dissection by 4-Dimensional Flow MRI. Sci Rep 2018;8:9111.
6. Zimmermann J, Loecher M, Baeumler K, et al. In Vitro 4D-Flow and Pressure Mapping in the True and False Lumen of a Type-B Aortic Dissection Model. In: SCMR 24th Scientific Sessions. Virtual; 2021.
7. Zwart NR, Pipe JG. Multidirectional high-moment encoding in phase contrast MRI. Magn Reson Med 2013;69:1553-1563.
8. Ying L, Sheng J. Joint image reconstruction and sensitivity estimation in SENSE (JSENSE). Magn Reson Med 2007;57:1196-1202.
9. Loecher M, Ennis DB. Velocity reconstruction with nonconvex optimization for low-velocity-encoding phase-contrast MRI. Magn Reson Med 2018;80:42-52.
10. Markl M, Bammer R, Alley MT, et al. Generalized reconstruction of phase contrast MRI: Analysis and correction of the effect of gradient field distortions. Magn Reson Med 2003;50:791-801.
11. Tautz L, Hennemuth A, Peitgen HO. Motion analysis with quadrature filter based registration of tagged MRI sequences. STACOM Lect Notes Comp Sci 2012;7085:78-87.
12. Ritter F, Boskamp T, Homeyer A, et al. Medical image analysis. IEEE Pulse 2011;2:60-70.
Figures