2092
Impact of gadolinium contrast on image quality and quantitative flow assessment using conventional and compressed sensing 4D flow prototypes1Department of Radiology and Radiological Science, Medical University of South Carolina, Charleston, SC, United States, 2Radiology, University Medical Center Mainz, Mainz, Germany, 3DZHK, Partner-Site Rhine-Main, Mainz, Germany, 4Siemens Medical Solutions USA, Inc., Chicago, IL, United States, 5Department of Cardiothoracic Surgery, University Medical Center Mainz, Mainz, Germany, 6Department of Cardiothoracic Surgery, Medical University of South Carolina, Charleston, SC, United States
Synopsis
This study investigates the effect of the presence of gadolinium contrast on image quality and quantitative flow assessment using conventional and highly accelerated compressed sensing (CS) 4D flow prototypes. In our cohort of 18 healthy volunteers who underwent pre- and post-contrast 4D flow measurements using both techniques, strong to very strong agreement in quantitative flow measurements were found between pre- and post-contrast studies and between conventional and CS 4D flow measurements. SNR was significantly increased after contrast injection in both prototype measurements. Our results suggest that 4D flow acquisition provides accurate flow assessment regardless of the presence of contrast agent.
Introduction
4D flow MRI has been shown to provide improved clinical value over standard 2D flow techniques by its ability to visualize and quantify flow at any location and position in the acquired 3D volume. While early 4D flow techniques suffer from excessively long acquisition time (10-15 min), novel highly accelerated compressed sensing (CS)-based approaches are substantially faster (< 6 min). Such CS techniques use random undersampling of the k-space and recover image quality through iterative reconstruction. Since the acquisition time of these techniques is on the level of several minutes, the timing of the acquisition during a patient exam is important to ensure scan efficiency. Therefore, 4D flow scans may be acquired after gadolinium-based contrast agent (GBCA) administration, for example during the waiting period before late gadolinium enhancement (LGE) acquisition. It is known that the presence of GBCA may increase signal-to-noise ratio (SNR) (1) and wash-out effects may negatively affect image quality (2), however, the net effect of GBCA on quantitative flow assessment and image quality is unknown. Therefore, the aim of this study was to compare SNR and quantitative flow parameters between native and post-contrast 4D flow acquisitions using conventional and highly accelerated CS prototype pulse sequences.Methods
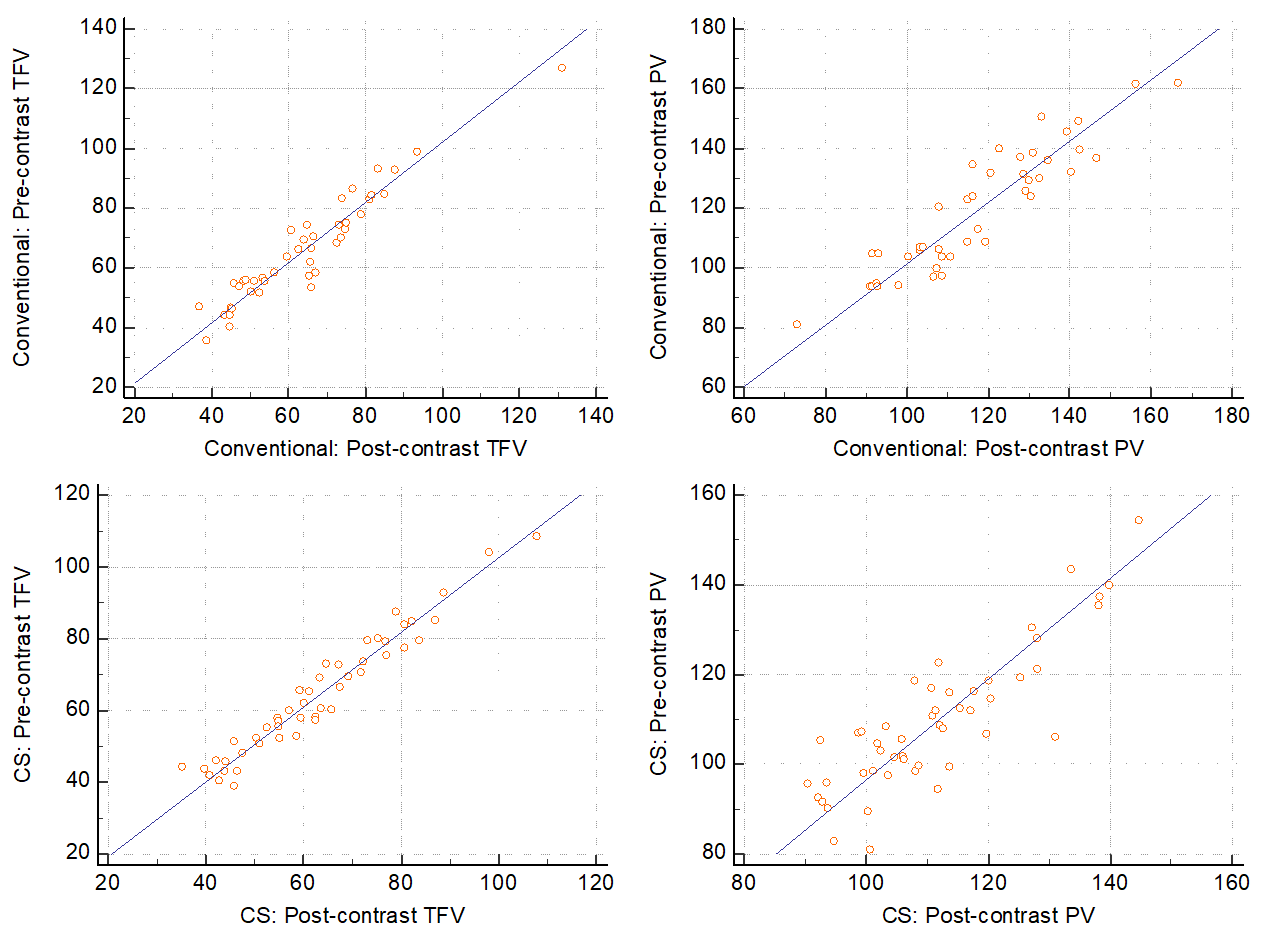
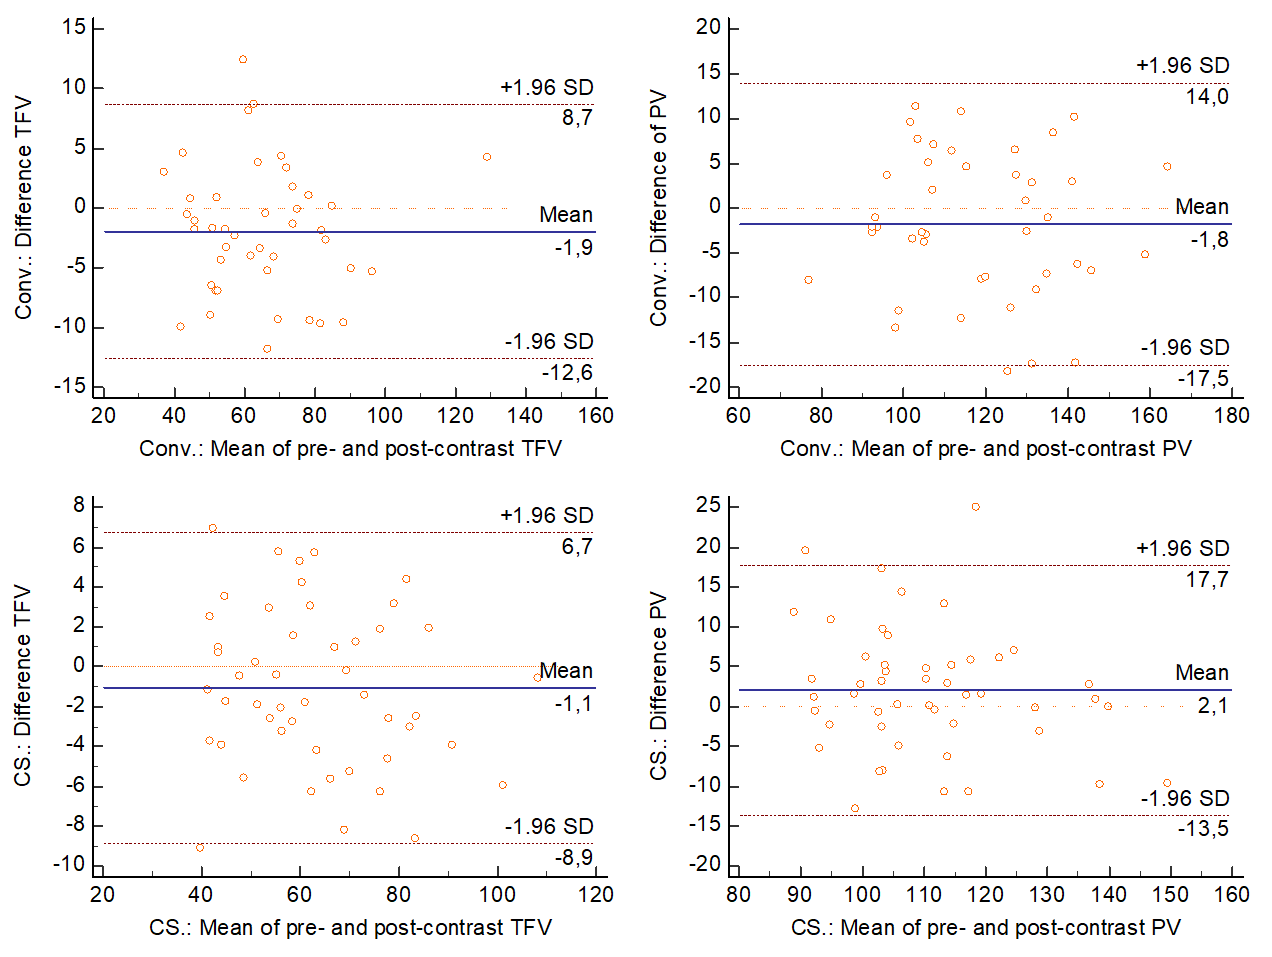
Healthy volunteers (n=18; 8 males; 28.0±7.1 years) underwent research MRI on a 3T system (MAGNETOM Prisma, Siemens) in this IRB-approved study. Conventional 4D flow acquisition with factor 3 GRAPPA acceleration (TR/TE 38.64/2.28 ms; FOV 380 mm; matrix 160×80; flip angle pre- and post-contrast 8° and 15°) and CS 4D flow with factor 7.7 acceleration (TR/TE 40.48/2.36 ms; FOV 360 mm; matrix 160×102; flip angle pre- and post-contrast 7° and 15°) were performed pre-contrast in a random order, then repeated post-contrast (0.1 ml/kg gadobutrol, Bayer) in a random order; i.e. a total of 4 acquisitions were performed per subject. Flow measurements (total forward volume, TFV; peak velocity, PV) were performed with a dedicated 4D flow software (cvi42, Circle) at the proximal ascending aorta, aortic arch, and descending aorta. SNR was measured in a region of interest in the ascending aorta in two end-diastolic magnitude images as described before (3). Differences in pre- and post-contrast flow measurements and SNR were compared using Wilcoxon rank sum test. Pearson’s correlation was used to evaluate the correlation between measurements and reported as Pearson’s r. Agreement between the pre- and post-contrast scans was analyzed using two-way mixed effects, absolute agreement intraclass correlations (ICC), and Bland-Altman plots by reporting the mean of differences and the 1.96SD limits of agreement. ICC was interpreted as follows: 0.0-0.3, lack of agreement; 0.31-0.5, weak; 0.51-0.7, moderate; 0.71-0.9, strong; and 0.91-1.00, very strong agreement.Results
All 4D flow acquisitions were successfully performed in every subject. Overall, there was a high correlation and a strong to very strong agreement in TFV (69.9±20.1 vs 63.7±20.3ml; r=0.84; ICC=0.89) and PV (120.0±19.7 vs 117.3±19.8cm/s; r=0.88, ICC=0.93) between pre- and post-contrast acquisitions using the conventional 4D flow approach. Similar agreement in TFV (64.2±17.2 vs 63.5±16.8ml; r=0.94; ICC=0.97) and PV (109.8±15.9 vs 113.2±15.6cm/s; r=0.83, ICC=0.90) was observed between pre- and post-contrast scans using the CS approach (see Figures 1 and 2). Overall, post-contrast SNR was significantly higher in both conventional and CS measurements compared to pre-contrast (pre- vs post-contrast SNR: Conventional 23.7±7.5 vs 34.0±10.1, respectively; p=0.002; and CS 43.1 [20.0; 68.2] vs 56.0 [35.3; 137.4], respectively, p=0.041).Discussion
In this study we demonstrated that conventional and highly accelerated 4D flow techniques reliably assess basic flow parameters regardless of the presence of GBCA. As expected, post-contrast acquisitions provided improved SNR, however, without effect on the precision of flow parameter measurements. The frequent use of GBCA in cardiovascular MR applications require efficient acquisition protocol planning. GBCA administration is often needed for myocardial characterization using the LGE technique. The need to wait a minimum of 10 minutes after GBCA administration provides room for the acquisition of images that typically do not require contrast, e.g. short axis cine images. However, as seen with cine images, measurements obtained pre- and post-contrast may show differences in quantitative parameters and normal reference ranges established in a pre-contrast environment are not necessarily applicable for post-contrast assessment. 4D flow acquisitions, similarly to short axis cine, may be acquired during the wait period prior to LGE in order to maximize the utilization of scanner time and minimize downtime. As demonstrated here, contrary to cine imaging, the measurement accuracy of 4D flow acquisitions is not influenced by the presence of GBCA, therefore 4D flow imaging can be obtained at any phase of the MR protocol to ensure scan efficiency.Conclusion
Both conventional and CS-accelerated 4D flow techniques provide accurate flow assessment regardless of the presence of contrast agent, therefore 4D flow acquisitions can be performed either before or after GBCA administration. However, post-contrast acquisition improves SNR.Acknowledgements
N/AReferences
1. Hess AT, Bissell MM, Ntusi NAB, Lewis AJM, Tunnicliffe EM, Greiser A, et al. Aortic 4D flow: Quantification of signal-to-noise ratio as a function of field strength and contrast enhancement for 1.5T, 3T, and 7T. Magn Reson Med [Internet]. Wiley-Blackwell; 2014 Jun 16;73(5):1864–71. Available from: https://doi.org/10.1002/mrm.25317
2. Dyverfeldt P, Bissell M, Barker AJ, Bolger AF, Carlhäll C-J, Ebbers T, et al. 4D flow cardiovascular magnetic resonance consensus statement. 2015;
3. Reeder SB, Wintersperger BJ, Dietrich O, Lanz T, Greiser A, Reiser MF, et al. Practical approaches to the evaluation of signal-to-noise ratio performance with parallel imaging: Application with cardiac imaging and a 32-channel cardiac coil. Magn Reson Med [Internet]. Wiley-Blackwell; 2005 Aug 8;54(3):748–54. Available from: https://doi.org/10.1002/mrm.20636
Figures