2091
A Pulse Wave Velocity Calculation Tool for 4D flow MRI – Data Requirements and Application in Marfan Patients1Department of Radiology & Nuclear Medicine, Amsterdam University Medical Centers, location AMC, Amsterdam, Netherlands, 2Department of Cardiology, Amsterdam University Medical Centers, location AMC, Amsterdam, Netherlands
Synopsis
Aortic pulse wave velocity (PWV), which can be an indicator of certain cardiovascular disease via aortic stiffness estimation, requires high temporal resolution for accurate measurements. Using compressed sensing based 4D flow MRI of the aorta, we propose a tool for assessment of PWV. The impact of data requirements (and thereby scan time) were investigated via retrospective undersampling in a cohort of healthy volunteers. The findings were then applied to Marfan subjects to determine if the minimal data requirements effectively detect differences between patients and healthy controls.
Background
Aortic pulse wave velocity (PWV), the pulse pressure wave speed, has been extensively studied using 4D flow MRI as a non-invasive means to determine a surrogate of stiffness in certain cardiovascular diseases. The volumetric nature of 4D flow MRI allows for reproducible global assessment of PWV1.As the aorta stiffens with age or as a result of atherosclerosis, PWV values increase. In patients with Marfan syndrome, the aorta is similarly stiff as a result of inherited connective tissue degeneration2.
4D flow MRI aortic PWV can be challenging, requiring both high temporal resolution3 and time-resolved contours at each measurement location to accurately evaluate flow. Furthermore, k-space data requirements to determine PWV have not been fully assessed in the context of 4D flow MRI; less data would result in a faster scan.
The purpose of this study was threefold: 1) to develop a fast and reproducible software tool for measurement of aortic PWV from accelerated 4D flow MRI4, 2) to systematically determine necessary data sampling requirements for reproducible PWV assessment, and 3) to implement these findings in a cohort of Marfan syndrome patients.
Methods
Data acquisition and reconstruction:Fifteen healthy volunteers (n=15, 8 female, aged 27±3y) underwent aortic pseudo-spirally undersampled 4D flow MRI at 3T (Ingenia, Philips Healthcare, Best, Netherlands) followed by data reconstruction using compressed sensing algorithms4. Datasets were retrospectively reconstructed to 60 cardiac frames (~17 ms temporal resolution per frame, depending on heart rate), and the initial undersampling factors (R) and scan durations were 14.0±0.1 and 5.1±1.8 minutes, respectively. Reconstructions were performed offline using ReconFrame (Gyrotools, Zurich, Switzerland) and the Berkeley Advanced Reconstruction Toolbox5.
PWV tool:
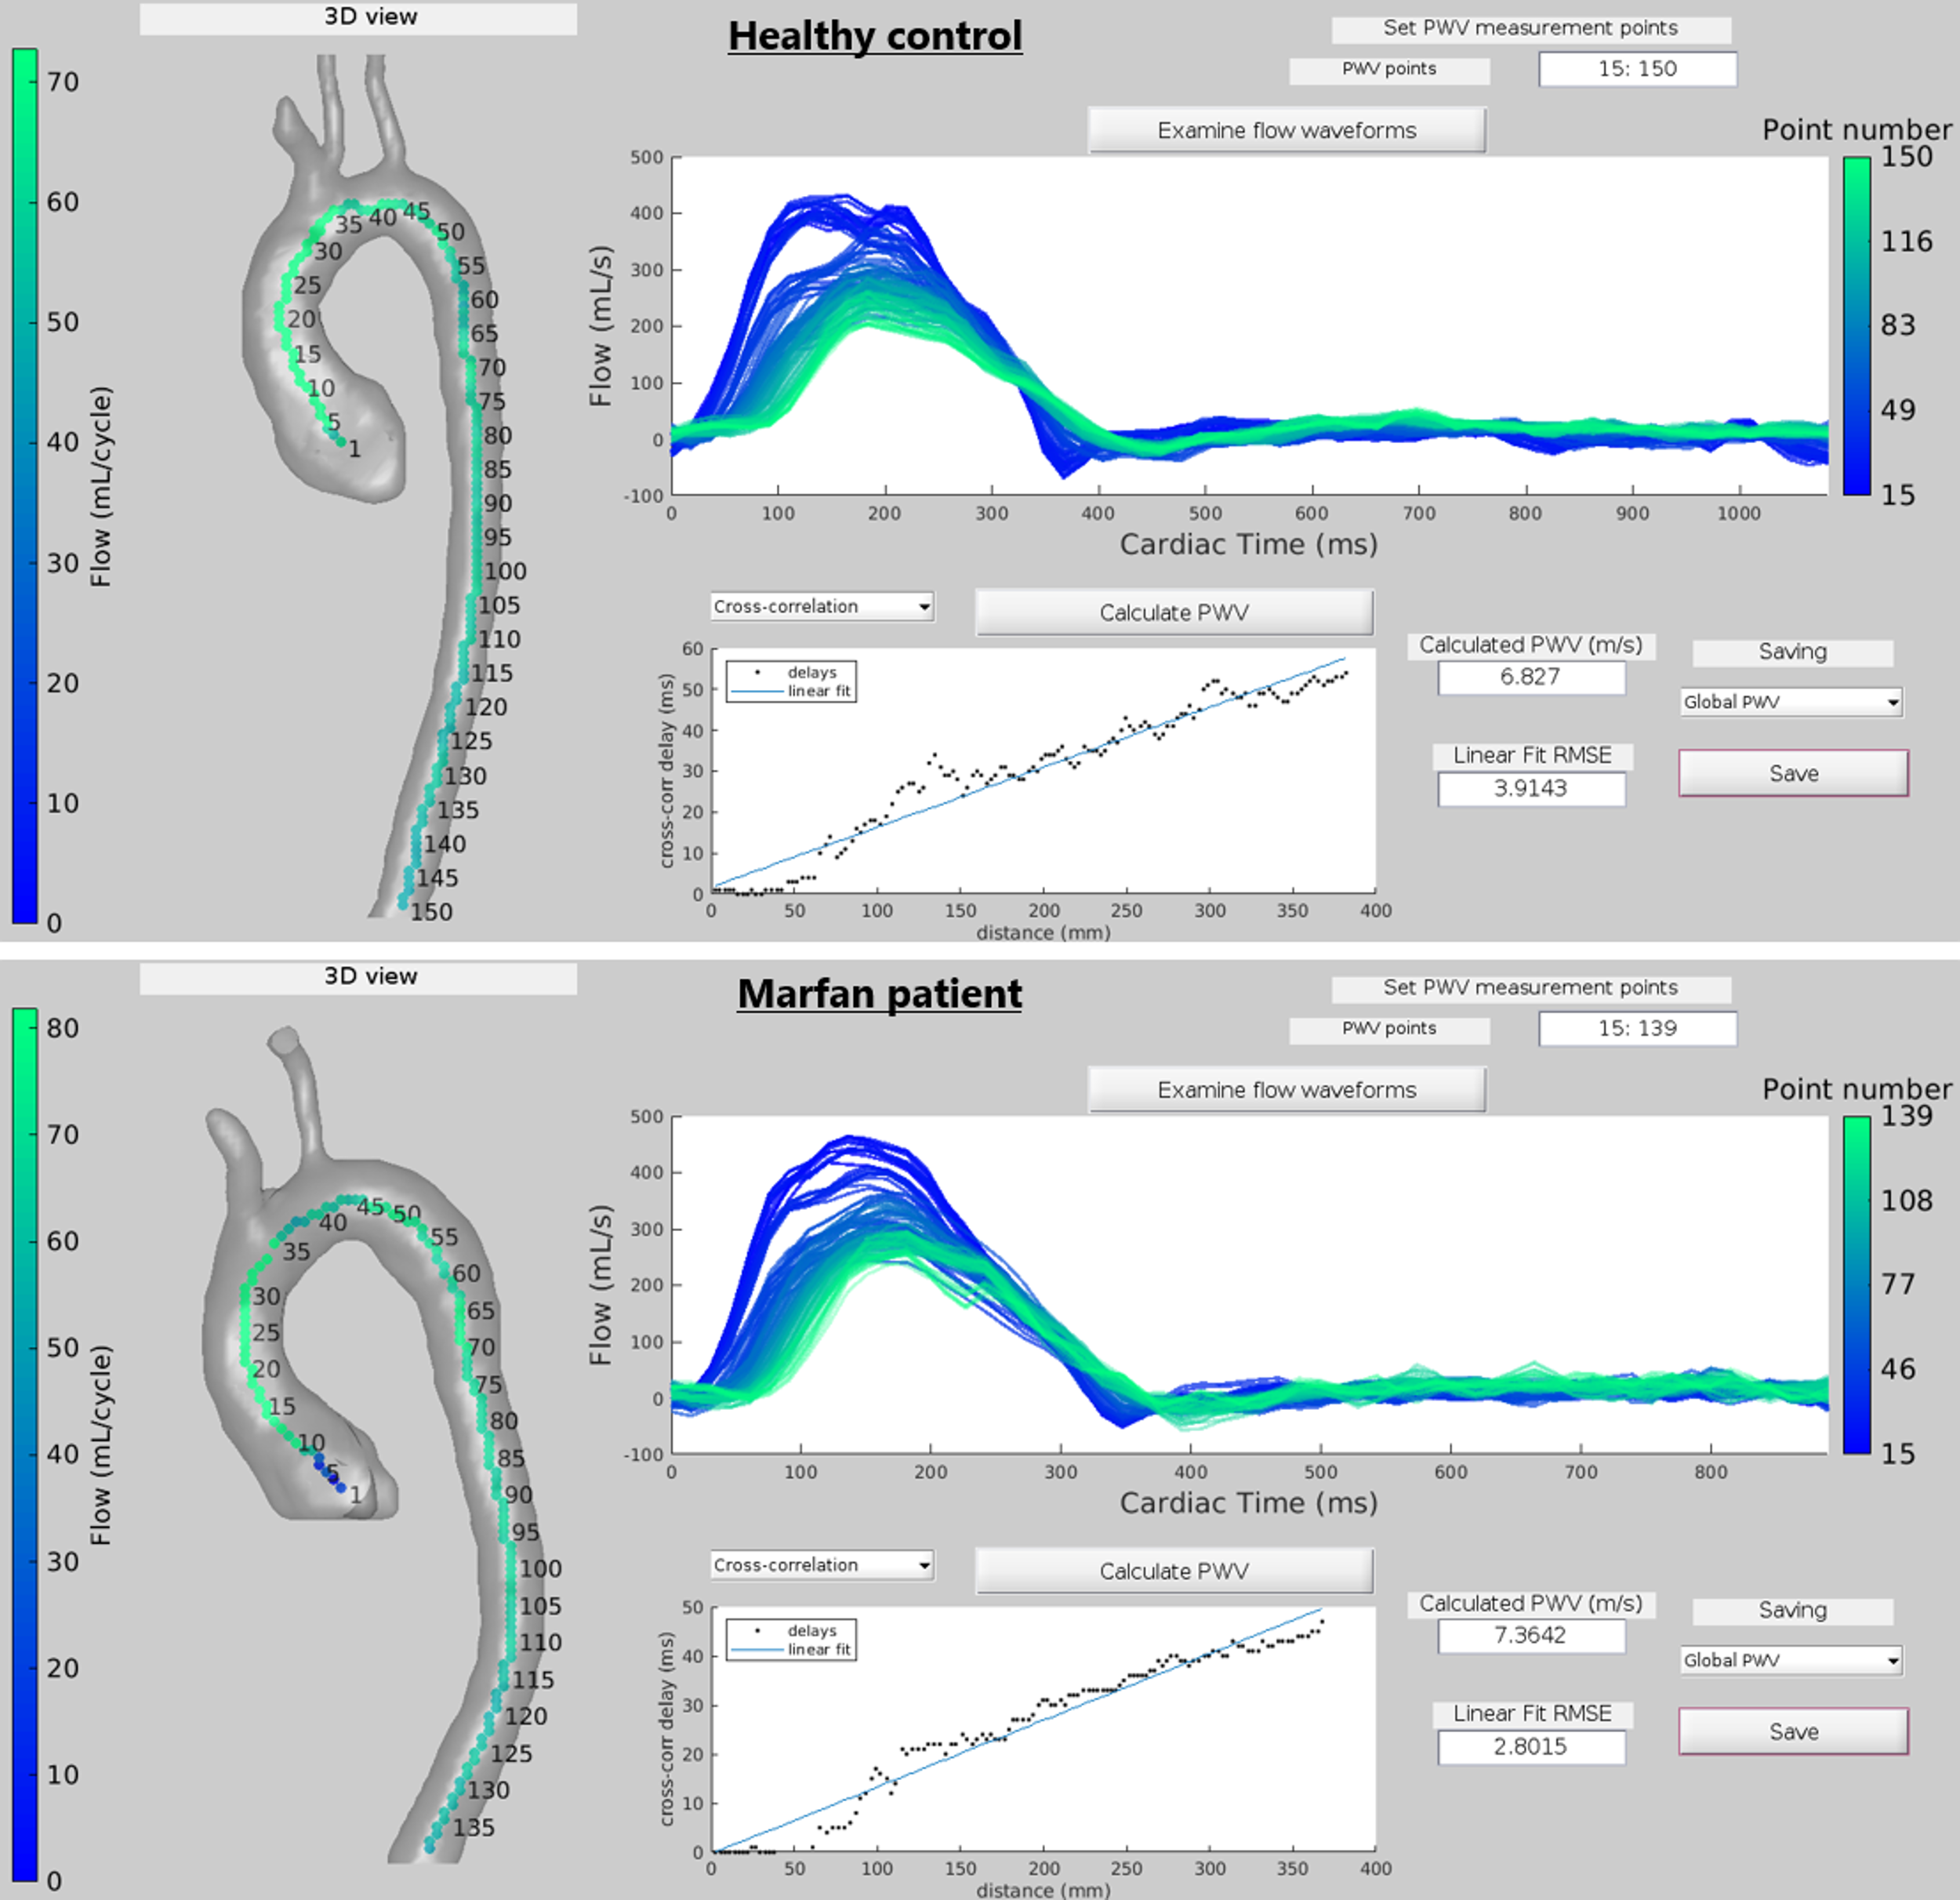
A semi-automatic, fast software tool was developed in MATLAB (R2019a, Mathworks, MA, USA) (Figure 1), which performed magnitude and velocity loading, pre-defined manual aortic segmentation loading, velocity corrections, and aorta centerline extraction. Time-resolved aortic segmentations (Figure 2) were generated by applying displacements to the original segmentation. These were derived from non-rigid registration of 4D flow angiographic volumes at each time frame to the time-maximum intensity projection6. Coupled with the centerline, this time-resolved segmentation provided automated measurements of flow at each orthogonal cross-section placed along the centerline. Flow waveforms were then used to calculate global and DAo PWV using two established methods: cross-correlation (XCorr)7 and wavelet cross-spectrum analysis (TTW)8.
Systematic data requirement investigation:
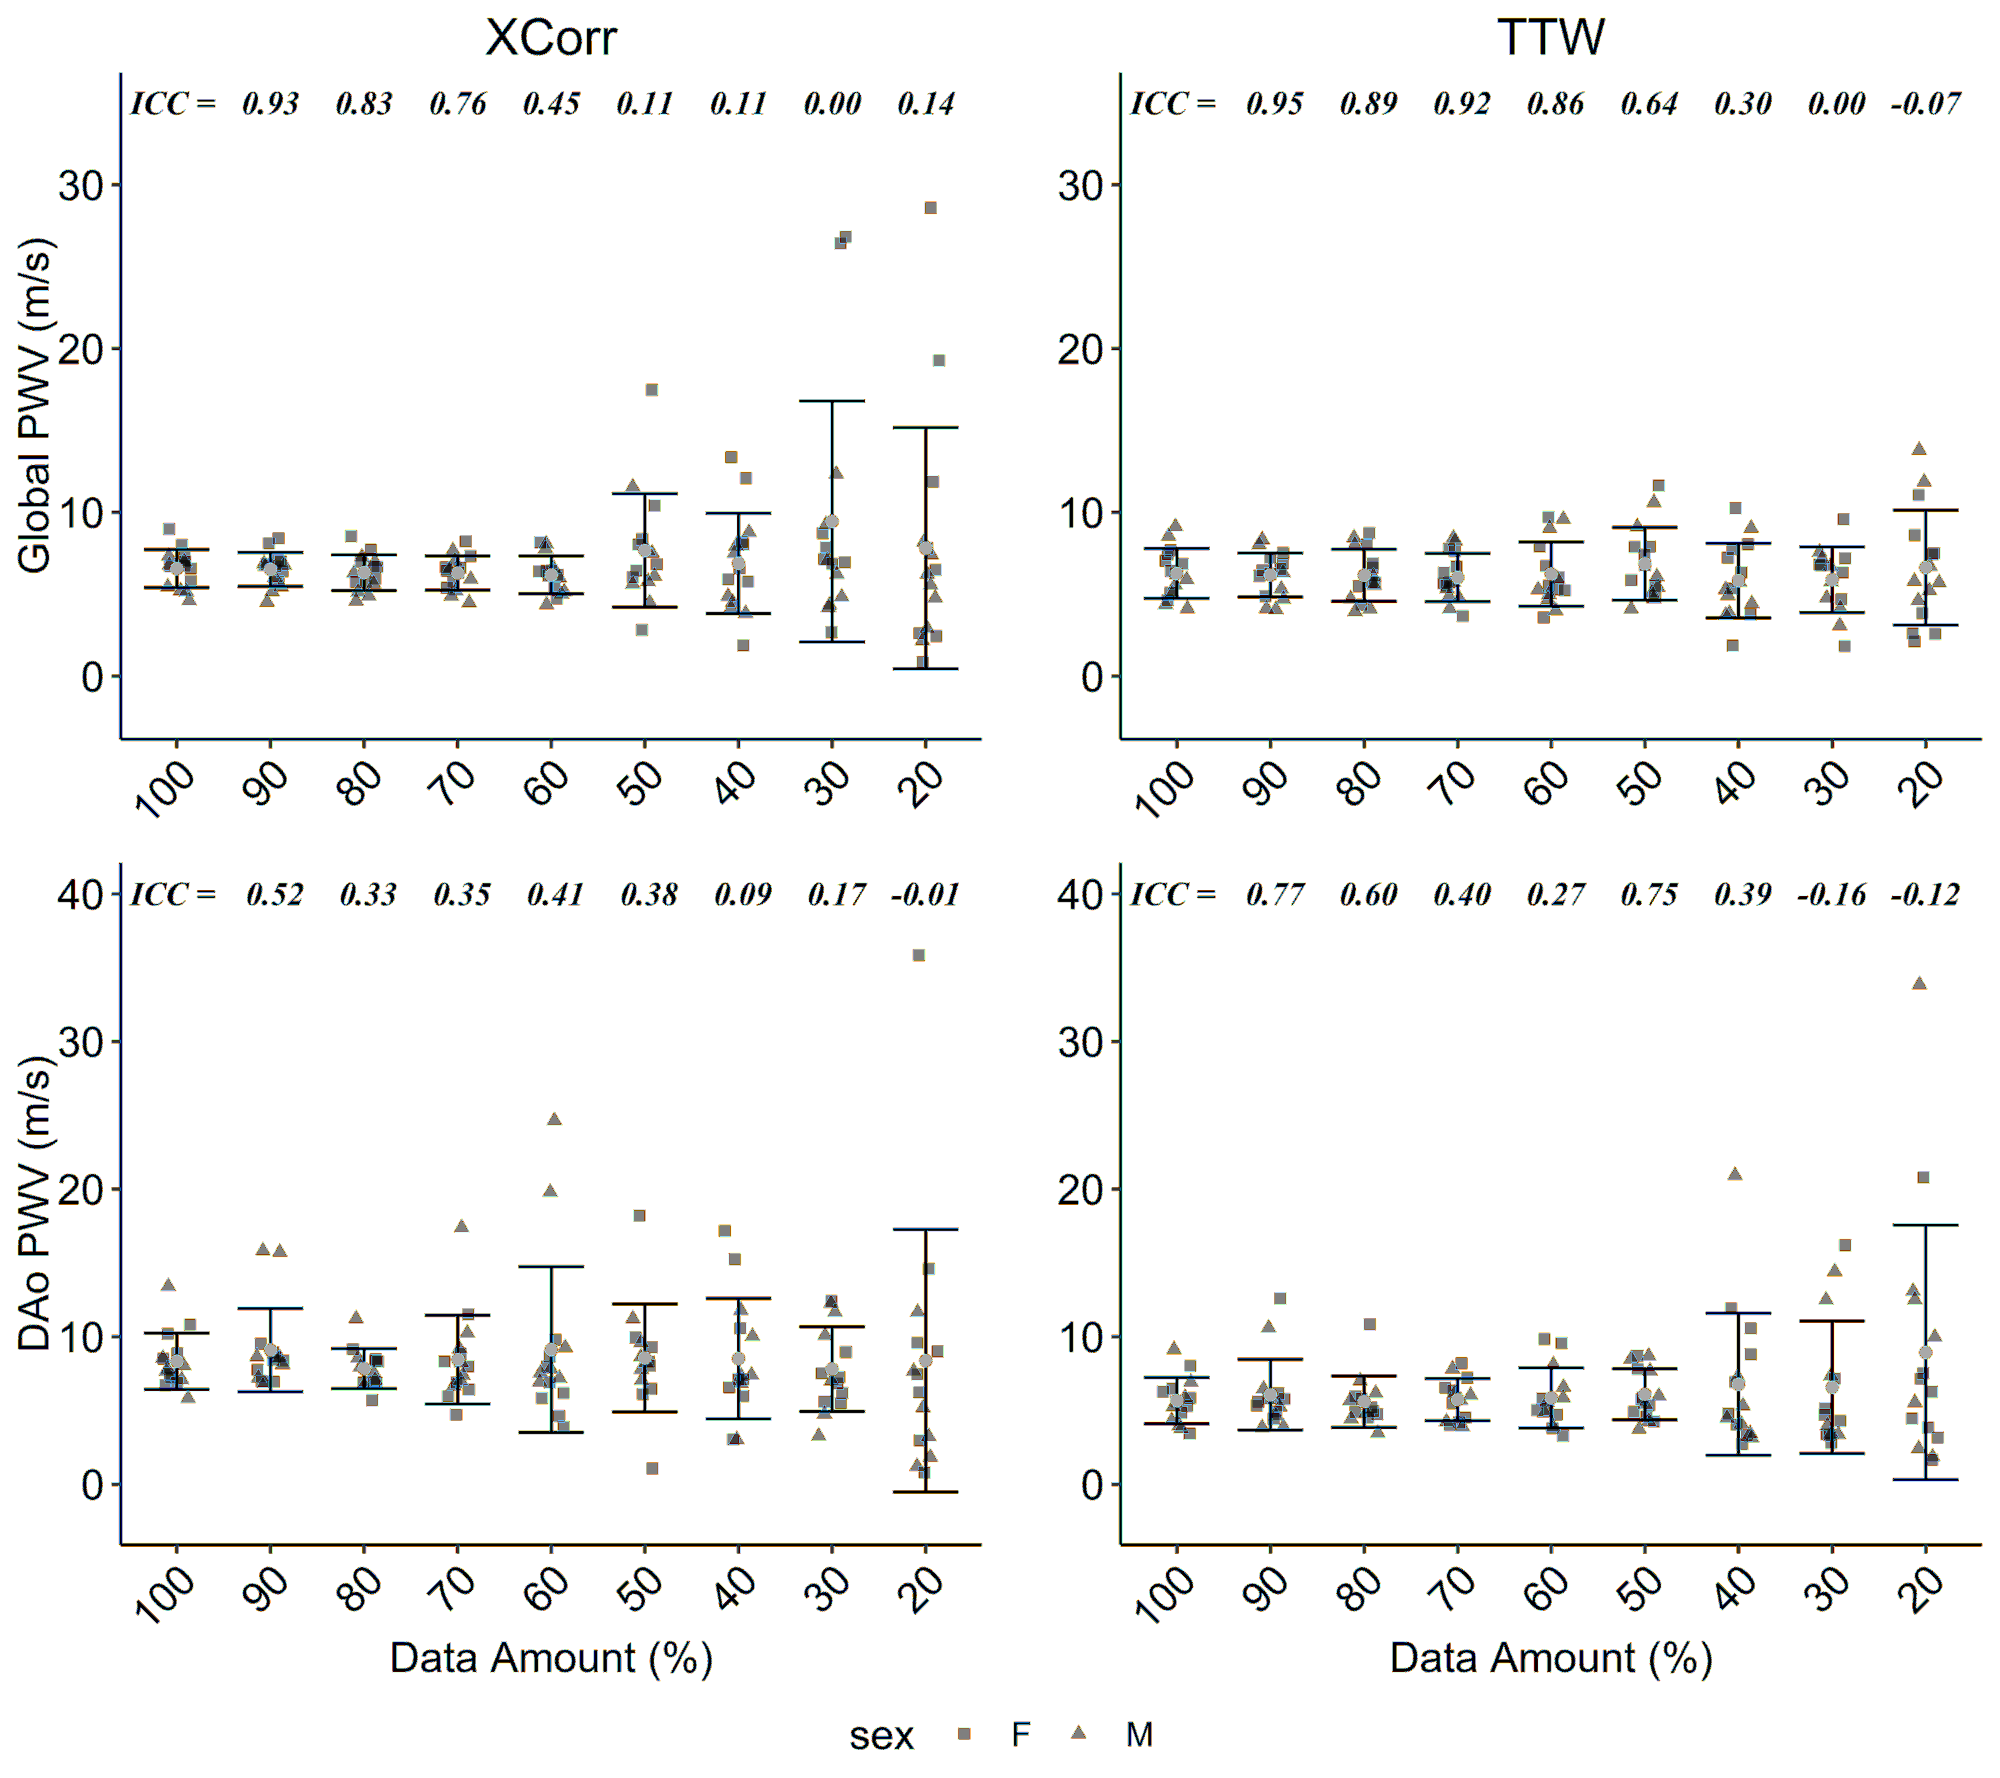
To test data requirements for reproducible aortic PWV measurement, healthy volunteer scans were retrospectively undersampled at 8 decile percentages of the original sampling: 90%, 80% 70%, 60%, 50%, 40%, 30%, and 20%; this corresponds to reducing the scan time accordingly. Data were then reconstructed to 60 cardiac frames as above and used in batch processing to automatically extract PWV values. Reliability of global and DAo PWV was assessed by measuring the one-way intraclass correlation coefficient (ICC) for values of each subsampled dataset versus PWV values from the original sampling size. Moderate reliability (ICC>0.5) was considered adequate and used as a cut-off for comparison against Marfan data below.
Application to Marfan patients:
Whole-aortic 4D flow scans using the same acquisition (Ingenia Elition X, Philips) and reconstruction parameters as above were obtained in 57 Marfan syndrome patients (n=57, 27 female, aged 37±9y) as part of an ongoing cardiac imaging study, PWV was calculated across all Marfan patients. PWV values (for both original sampling size and with the determined cut-off threshold) for XCorr and TTW were compared against healthy volunteer values using student’s t-test (p<0.05 considered significant).
Results
Example calculation of aortic global PWV in one healthy control and one Marfan syndrome patient using the open-source MATLAB tool are shown in Figure 1.Data requirement results are shown in Figure 3. For global PWV, moderate ICC (>0.5) was observed for both XCorr and TTW methods for data amounts ≥70% (of the original amount) and this was chosen for subsequent comparison with Marfan data. In DAo PWV, ICC was considerably lower and variable for both calculation methods and most data amounts.
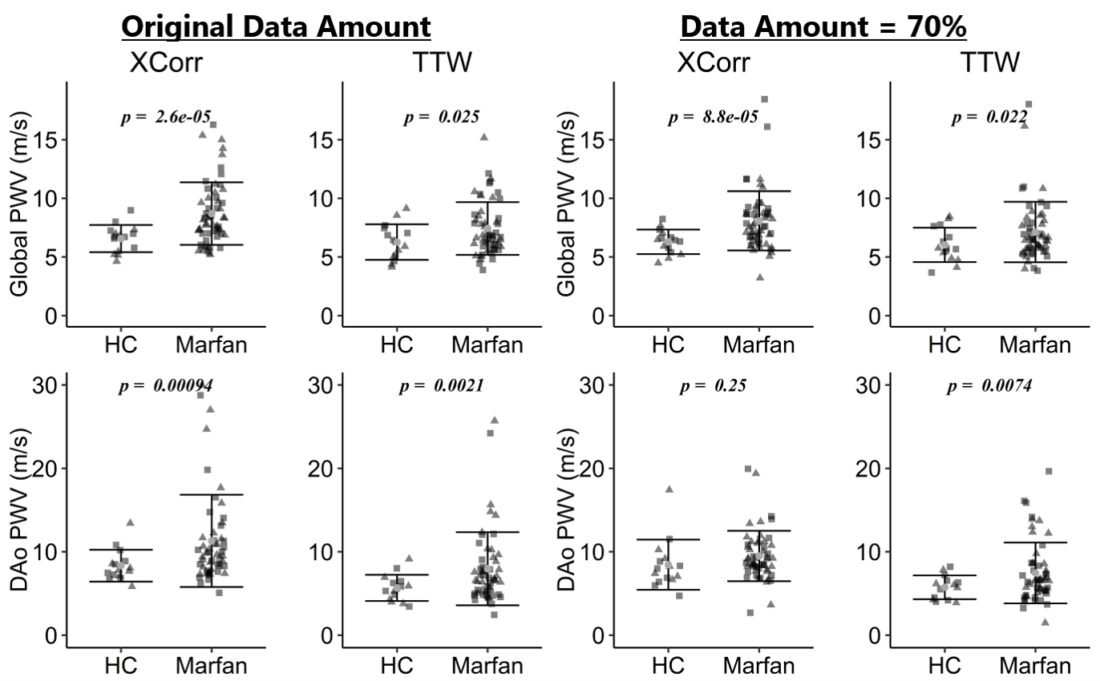
Figure 4 shows healthy controls and Marfan syndrome patients comparisons. Using original data amounts, Marfan patients had significantly higher global aorta and DAo PWV for both TTW and XCorr, as in previous work2. Global PWV maintained significant differences when data was reduced to 70% of the original scan length.
Discussion
Here we present an advanced post-processing tool for aortic PWV analysis in healthy controls and patients with Marfan syndrome. Using this processing pipeline is fast (2-4 minutes per case) and repeatable – the only user interaction following initial aortic segmentation is determination of which centerline points are needed for PWV calculation.These results suggest that global aortic PWV values can be reliably measured using XCorr or TTW at high undersampling factors (or by reducing 4D flow scan times to ~3.5 minutes), while consistent DAo measurements are more difficult to attain.
Future work will aim to replace time-consuming manual aorta segmentations with automatic time-resolved segmentation (using e.g. deep learning9).
Conclusion
This work demonstrates the development of an open-source tool for calculation of both global aortic and DAo PWV. Significant differences in PWV between healthy controls and Marfan syndrome patients can be observed at high undersampling, potentially reducing the required 4D flow acquisition time for such measurements.Acknowledgements
No acknowledgement found.References
1. Houriez-Gombaud-Saintonge, S. et al. Comparison of different methods for the estimation of aortic pulse wave velocity from 4D flow cardiovascular magnetic resonance. J. Cardiovasc. Magn. Reson. 21, 75 (2019).
2. Guala, A. et al. Decreased rotational flow and circumferential wall shear stress as early markers of descending aorta dilation in Marfan syndrome: A 4D flow CMR study. J. Cardiovasc. Magn. Reson. 21, 63 (2019).
3. Jarvis, K., Vali, A., Prabhakaran, S., Collins, J. D. & Markl, M. 4D Flow MRI-Based Aortic Pulse Wave Velocity Systematic Analysis of the Impact of Temporal Resolution on Estimation in Patients with Aortic Atherosclerosis and Age-matched Controls.pdf. in International Society of Magnetic Resonance in Medicine (2018).
4. Gottwald, L. M. et al. Pseudo‐spiral sampling and compressed sensing reconstruction provides flexibility of temporal resolution in accelerated aortic 4D flow MRI: A comparison with k‐t principal component analysis. NMR Biomed. 33, (2020).
5. Uecker, M. & Tamir, J. mrirecon/bart: version 0.5.00. (2019) doi:10.5281/ZENODO.3376744.
6. Bustamante, M., Gupta, V., Carlhall, C. J. & Ebbers, T. Improving visualization of 4D flow cardiovascular magnetic resonance with four-dimensional angiographic data: generation of a 4D phase-contrast magnetic resonance CardioAngiography (4D PC-MRCA). J Cardiovasc Magn Reson 19, 47 (2017).
7. Fielden, S. W. et al. A new method for the determination of aortic pulse wave velocity using cross-correlation on 2D PCMR velocity data. J. Magn. Reson. Imaging 27, 1382–1387 (2008).
8. Bargiotas, I. et al. Estimation of aortic pulse wave transit time in cardiovascular magnetic resonance using complex wavelet cross-spectrum analysis. J. Cardiovasc. Magn. Reson. 17, 65 (2015).
9. Berhane, H. et al. Fully automated 3D aortic segmentation of 4D flow MRI for hemodynamic analysis using deep learning. Magn. Reson. Med. 84, 2204–2218 (2020).
Figures