2087
Whole-heart 4D flow MRI: comparison between pseudo-spiral undersampling with compressed sensing reconstruction and EPI readout1Radiology and Nuclear Medicine, Amsterdam UMC, Amsterdam, Netherlands, 2Radiology and Nuclear Medicine, Amsterdam UMC, location AMC, Amsterdam, Netherlands, 3Radiology, Leiden UMC, Leiden, Netherlands, 4Biomedical Engineering and Physics, Amsterdam UMC, location AMC, Amsterdam, Netherlands
Synopsis
We compare pseudo-spiral undersampled whole-heart 4D flow MRI with CS reconstruction with a clinically used EPI readout in a cohort of healthy subjects and patients with valve regurgitation. Our results indicate that pseudo-spiral CS 4D flow MRI is at least as reliable as EPI-based 4D flow MRI in terms of inter-valve consistency of blood flow measurements and agreement with 2D MRI-based regurgitant volume measurement. Doubling the undersampling factor of the CS acquisition results in <10% deviation of the measurements compared to the original acquisition, suggesting that CS scan times may be shortened to expedite clinical implementation.
Introduction
4D flow MRI facilitates detailed evaluation of cardiac hemodynamics in various types of heart disease. Whole-heart coverage within clinically feasible scan times (<10 min) requires acceleration. EPI readout is a widely used acceleration technique, but is susceptible to image distortion artifacts at high acceleration factors due to phase accumulation effects, and velocity misregistration in high-velocity regions due to flow displacement effects. A recently introduced pseudo-spiral Cartesian sampling strategy with random undersampling in time and compressed sensing reconstruction (1-3), here referred to as CS, is not sensitive to these artefacts and may allow for even shorter scan times. In this study, we compare CS and EPI whole-heart 4D flow MRI acquisitions obtained in healthy subjects and patients with valve regurgitation, based on blood flow measurements over the heart valves. Additionally, we investigate the effect of increasing the CS undersampling factor. We hypothesize that CS-based blood flow measurements are as consistent between valves as EPI-based measurements, and CS may be accelerated even further.Methods
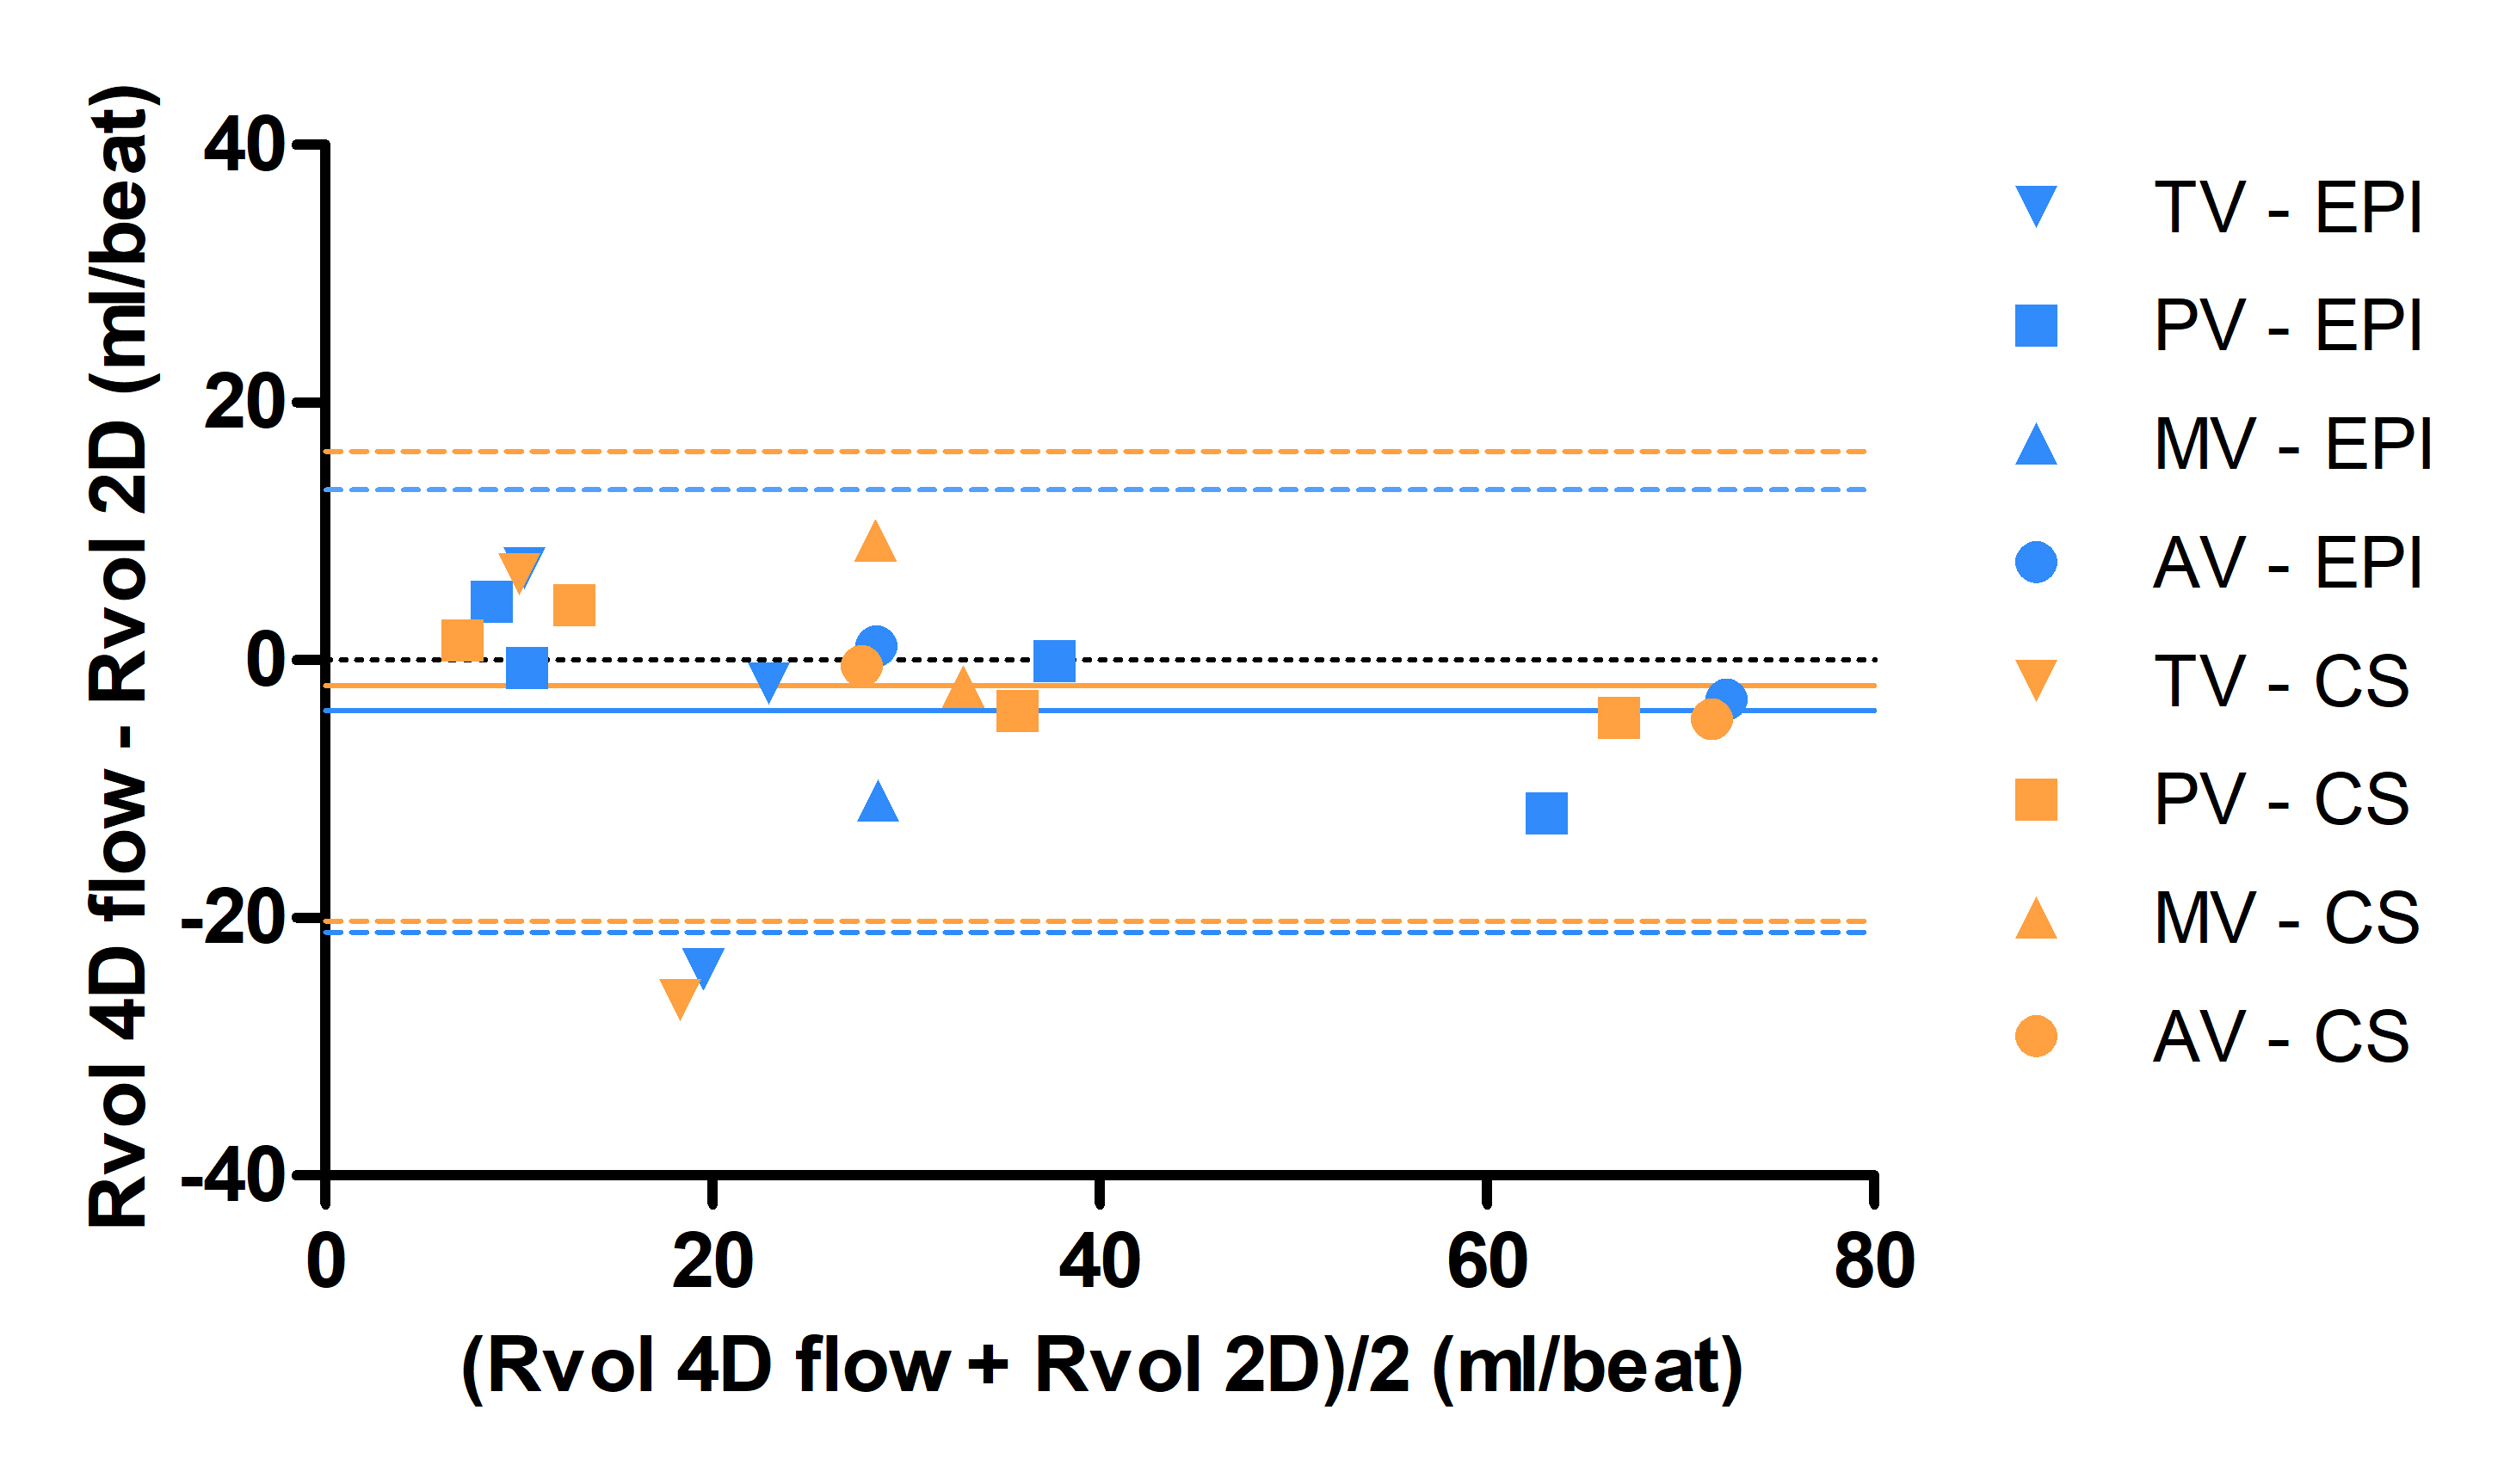
12 healthy volunteers (aged 25±3y, 7 female) and 7 patients with valve regurgitation (aged 42±17y, 2 female) underwent cardiac MRI at 3T including whole-heart CS and EPI 4D flow MRI. 4D flow data were acquired during free-breathing. Data were binned into 30 cardiac phases using retrospective ECG-gating. Acquired and reconstructed spatial resolutions were 3.0x3.0x3.0 mm3 and 2.8x2.8x3.0mm3 and three-directional VENC was set to 150 cm/s (volunteers) and 200-300 cm/s (patients). Scan times ranged from 7 to 10 minutes, depending on FH-dimension of the (transversal oblique) FOV and the subject’s heart rate during the EPI scan. EPI was obtained with an EPI factor of 5 and a SENSE factor of 2. The CS undersampling factor ranged from 5.5 to 8.2 to keep the scan times for both scans the same. CS 4D flow scans were reconstructed offline with ReconFrame (Gyrotools, Zurich, Switzerland) and using the Berkeley Advanced Reconstruction Toolbox (BART) (4). A sparsifying total variation transform in time was used with regularization parameters of r = 0.001 and 20 iteration steps.Semi-automated retrospective tracking of all four heart valves was performed using 2D cine bSSFP by dedicated software (CAAS MR Solutions v5.1 – 4D flow, Pie Medical Imaging) with through-plane valve motion correction and automatic aliasing and phase offset correction (5,6). Regurgitant volumes (Rvol) measured by EPI and CS 4D flow were compared to regurgitant volumes measured by 2D techniques (2D flow for the pulmonary (PV) and aortic valve (AV), and short-axis planimetry-based stroke volume – 2D flow-based forward flow for the tricuspid (TV) and mitral valve (MV)).
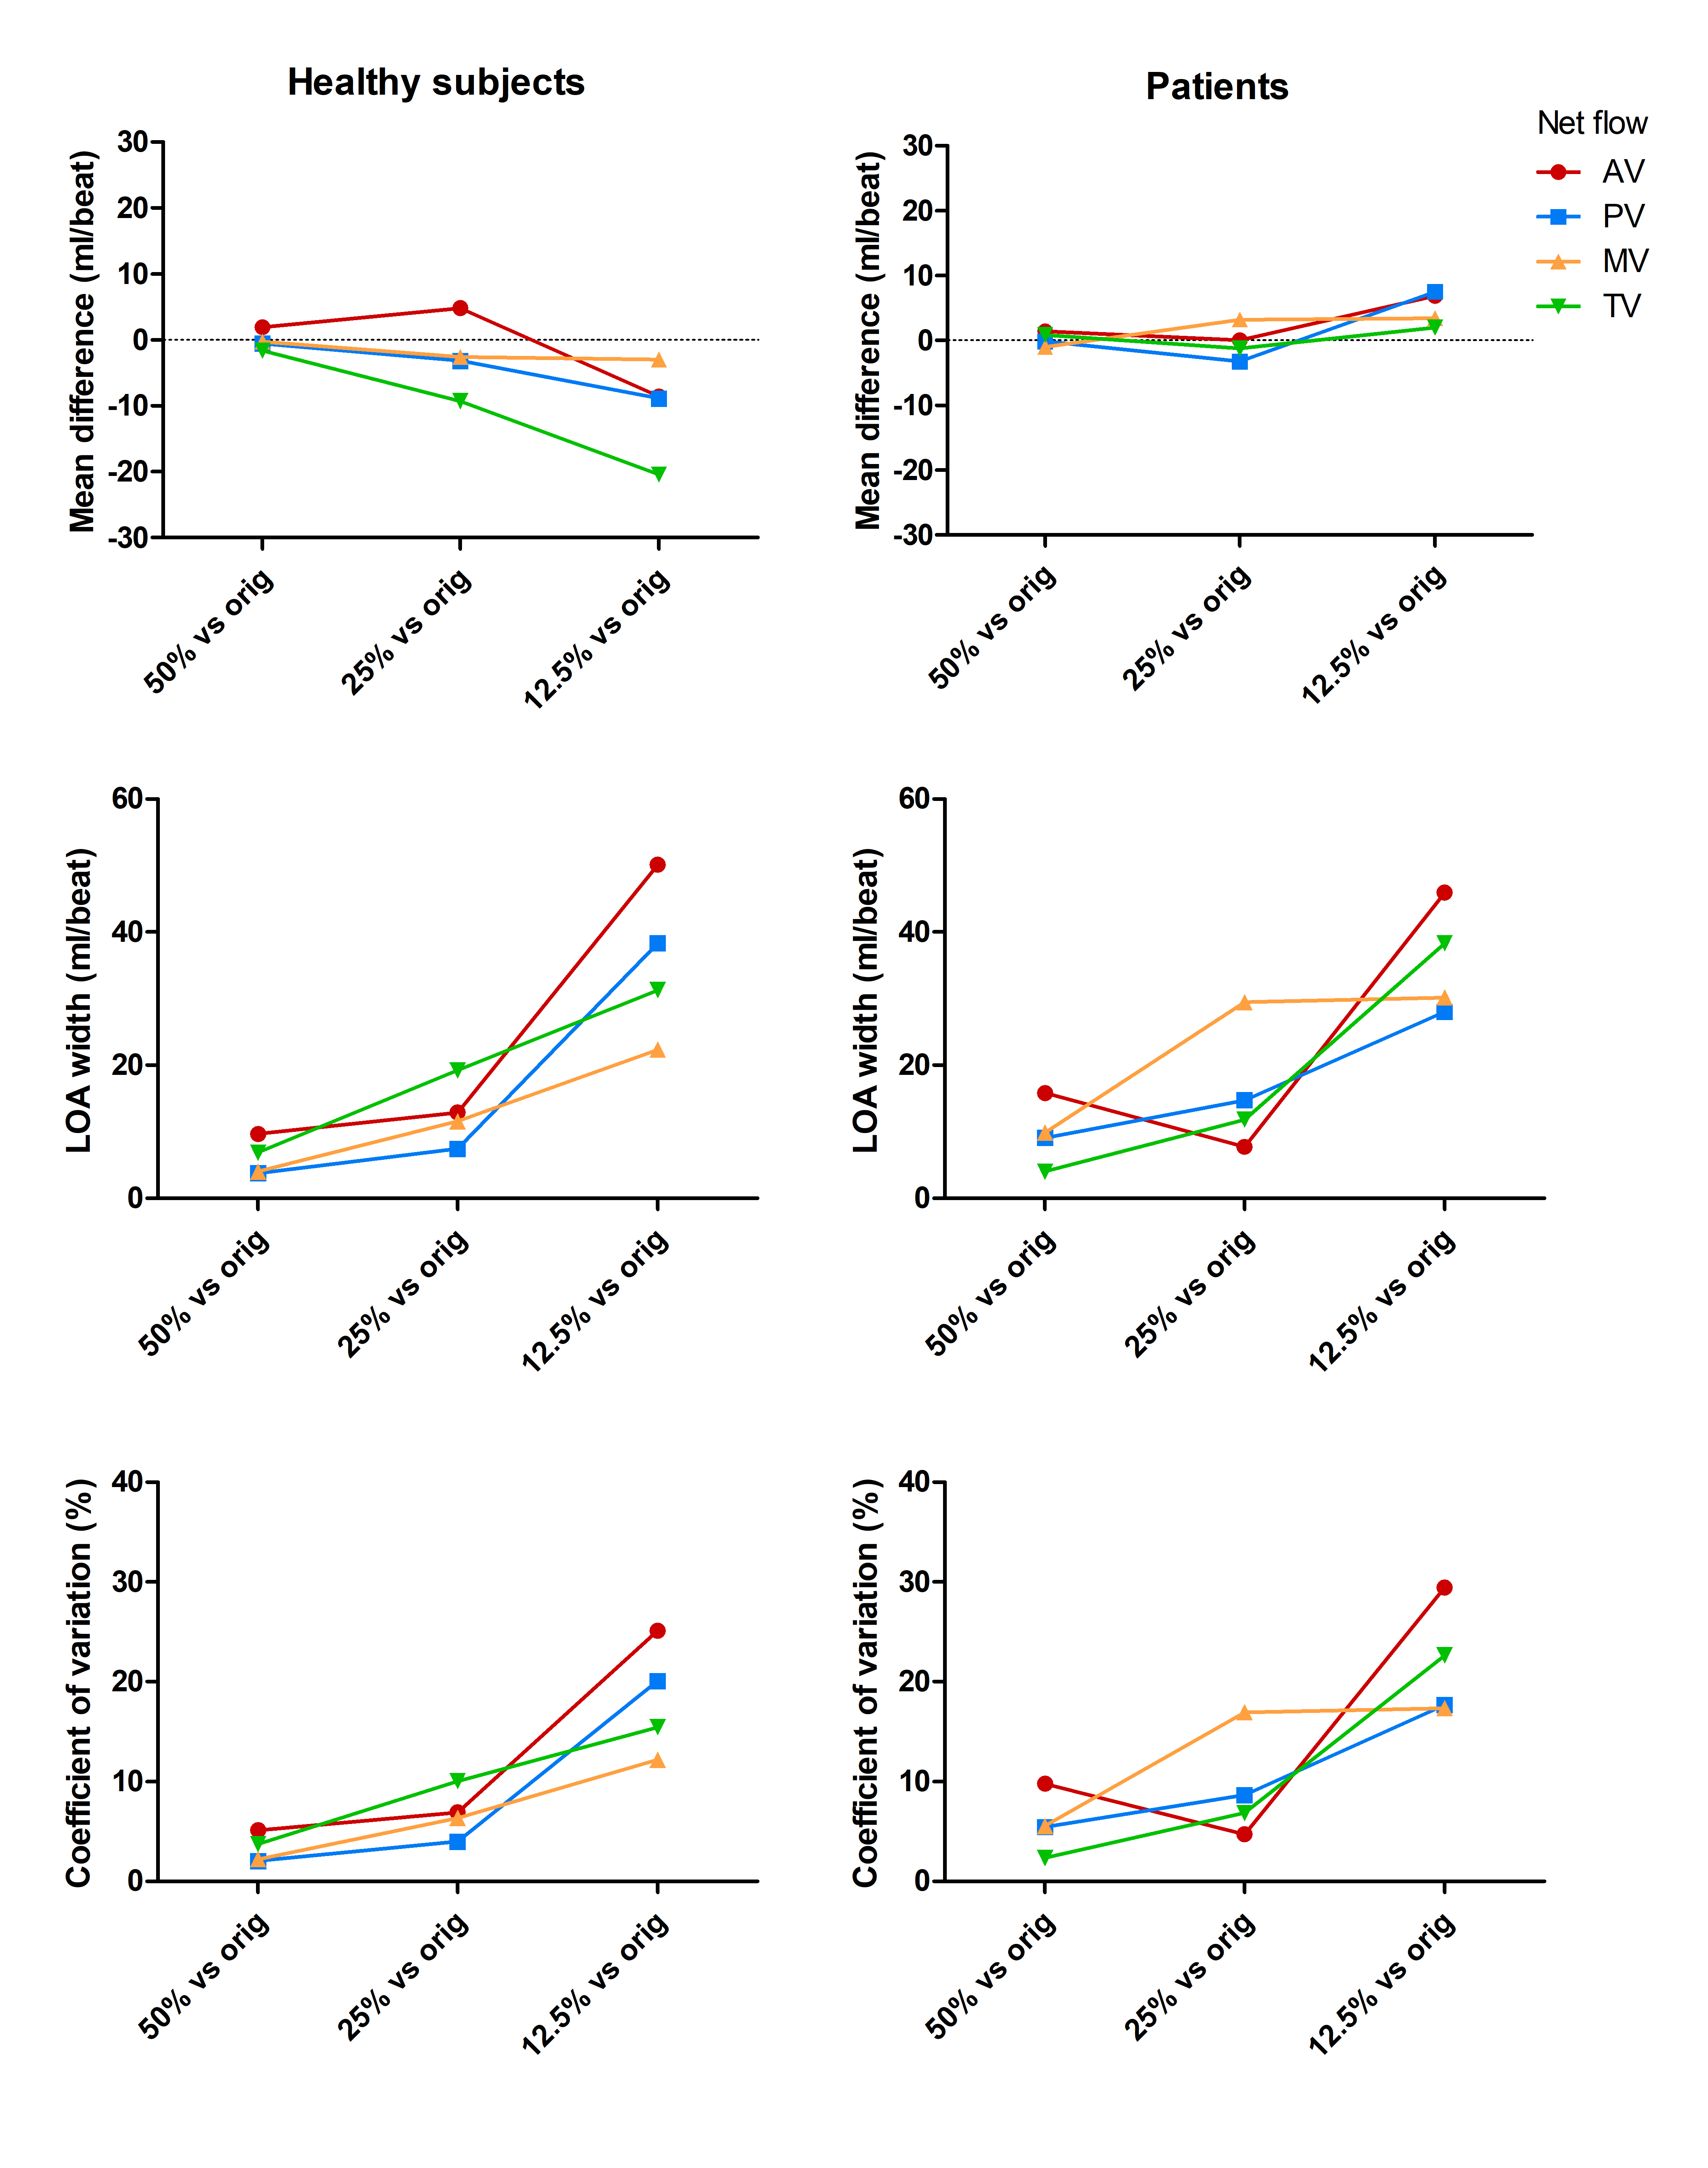
Valve tracking-based blood flow quantification was also performed on CS reconstructions of only 50%, 25% and 12.5% of the acquired data.
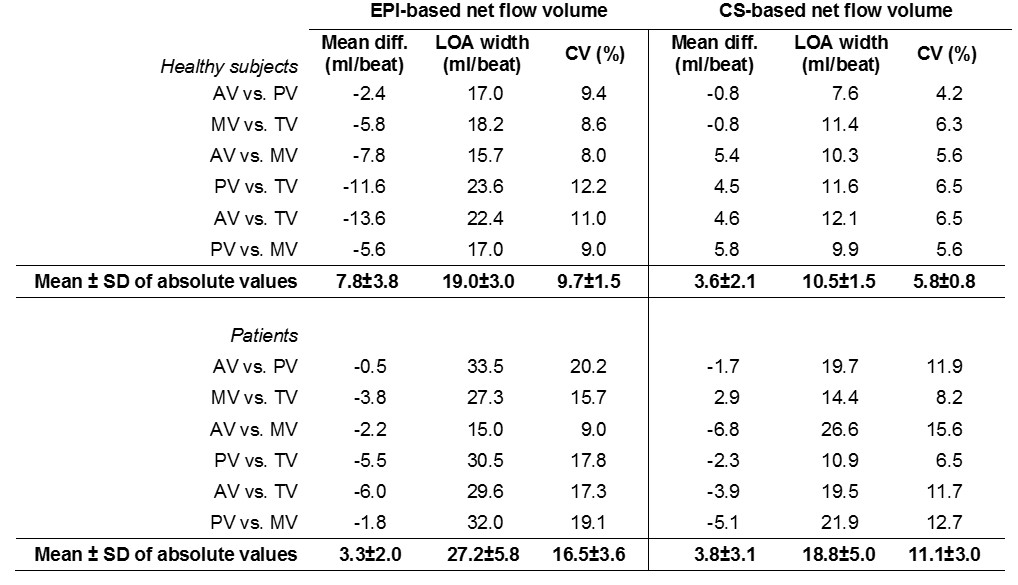
To assess consistency of the blood flow measurements, Bland-Altman parameters and coefficients of variation (SDnet flow differences/meannet flow*100%) were determined.
Results
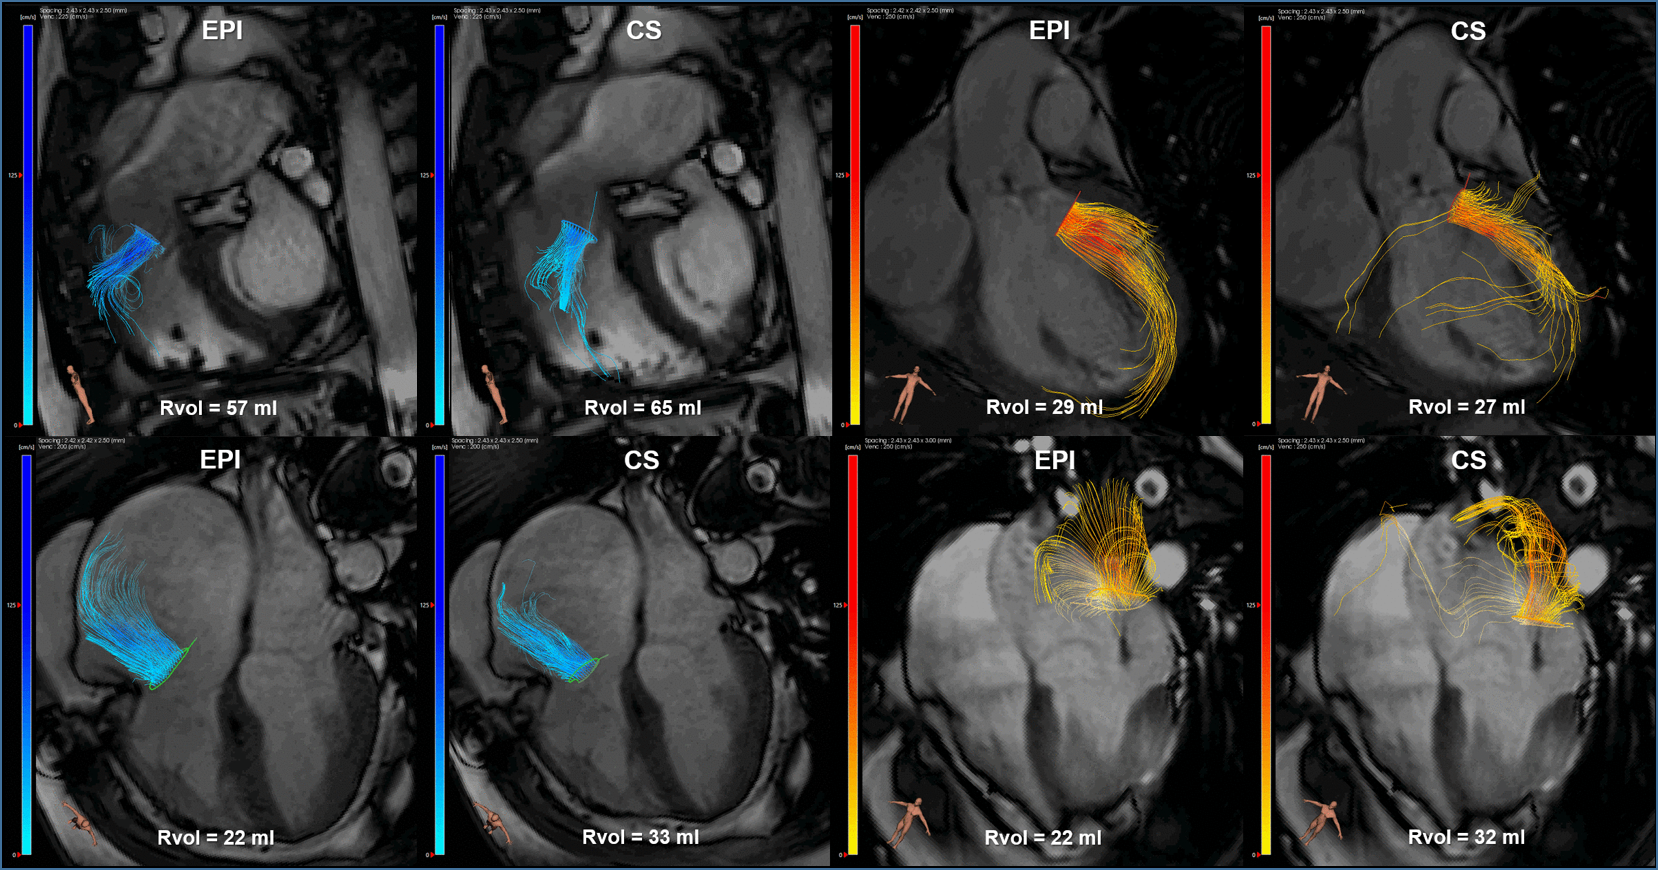
An example of an EPI and CS streamline visualization in a healthy subject, obtained by means of semi-automated retrospective valve tracking, is shown in Figure 1. Between valves, blood flow measurements obtained with CS demonstrated smaller mean differences, limits of agreement and coefficients of variation than those obtained with EPI (Table 1). Figure 2 shows EPI and CS streamline visualizations in four different patients in which valve regurgitation was quantified. Agreement of the 4D flow MRI-based Rvol measurements with 2D MRI-based measurements was comparable between EPI and CS (Figure 3). Reconstructing the CS 4D flow acquisitions with decreasing portions of the acquired data (Figure 4) resulted in increasing measurement differences in net flow volumes compared to using 100% of the acquired data, but coefficients of variation stay within 10% when using 50% of the acquired data.Discussion
In this study, we compared pseudo-spiral undersampled whole-heart 4D flow MRI with CS reconstruction with a clinically used EPI readout in healthy subjects and patients. Our results indicate that CS-based blood flow measurements are at least as consistent between valves as EPI-based measurements, and agreement of regurgitant volume measurement with 2D MRI-based measurement is comparable between EPI and CS. The observation that doubling the undersampling factor of the CS acquisition resulted in <10% deviation of the measurements compared to the original acquisition suggests that CS scan times may be shortened.Conclusion
Pseudo-spiral undersampled whole-heart 4D flow MRI with CS reconstruction is a valuable and reliable technique for blood flow quantification across the heart valves and may be accelerated further to expedite clinical implementation.Acknowledgements
No acknowledgement found.References
1. Lustig M, et al., Sparse MRI: The application of compressed sensing for rapid MR imaging. Magn. Reson. Med. 2007; 58:1182-1195
2. Gottwald LM, Peper ES, Zhang Q et al. Pseudo Spiral Compressed Sensing for Aortic 4D Flow MRI: a Comparison with k-t Principal Component Analysis. Proc 27rd Annu Meet ISMRM, Paris, France. 2018
3. Peper ES, Gottwald LM, Zhang Q et al. 30 times accelerated 4D flow MRI in the carotids using a Pseudo Spiral Cartesian acquisition and a Total Variation constrained Compressed Sensing reconstruction. Proc 27rd Annu Meet ISMRM, Paris, France. 2018
4. Uecker M, et al. Berkeley advanced reconstruction toolbox. Proc. Intl. Soc. Mag. Reson. Med. 23; 2015
5. Westenberg JJ, Roes SD, Ajmone Marsan N, et al. Mitral valve and tricuspid valve blood flow: accurate quantification with 3D velocity-encoded MR imaging with retrospective valve tracking. Radiology. 2008;249:792–800
6. Blanken CPS, Westenberg JJM, Aben JP, et al. Quantification of Mitral Valve Regurgitation from 4D Flow MRI Using Semiautomated Flow Tracking. Radiology: Cardiothoracic Imaging 2020 2:5
Figures