2086
The impact of compressed sensing L1-ESPIRiT reconstruction on the velocity vector fields acquired by 4D-flow MRI: A comparison to L2-ESPIRiT1Medical Physics Group, Institute of Diagnostic and Interventional Radiology, Jena University Hospital - Friedrich Schiller University Jena, Jena, Germany, 2Center for Sepsis Control and Care, Jena University Hospital, Jena, Germany, 3Institute of Computer Science, Department of Mathematics and Computer Science, Westfälische Wilhelms-Universität Münster, Muenster, Germany, 4Institute of Diagnostic and Interventional Radiology, Jena University Hospital - Friedrich Schiller University Jena, Jena, Germany, 5Clinic for Radiology, University Hospital Muenster, Muenster, Germany
Synopsis
Compressed Sensing (CS) is a popular reconstruction technique supporting 4D-flow MRI acquisitions. Many literature studied the velocity changes after CS simplifying the velocity vector field into a scalar field along the time domain. The aim of our investigation was to assess how CS influences reconstructed velocity vector fields in space. Our results showed that CS underestimated the maximum velocity values, broadened the full-width-at-half-maximum of the velocity profiles, and preserved the directional information of the velocity vector fields compared to L2-ESPIRiT. The results of CS were in agreement for differently undersampled data, while the L2-ESPIRiT reconstruction provided differing outputs.
INTRODUCTION
4D-flow magnetic resonance imaging (MRI) is a time-consuming technique to visualize and quantify advanced fluid dynamics in medicine 1,2. For MRI in general, various techniques exist to reduce the acquisition time, such as parallel imaging (PI) and compressed sensing (CS) 3. However, most literature so far only investigated the effects of such sparse reconstruction algorithms on magnitude images, neglecting the necessity of phase difference (velocity fields) preservation after reconstruction 4. Therefore, the purpose of this study was to explore the impact of L1-ESPIRiT (PI plus CS) reconstruction on the estimated 4D-flow data for different undersampling factors at 9.4T, and to compare it to the standard L2-ESPIRiT (PI only) results.METHODS
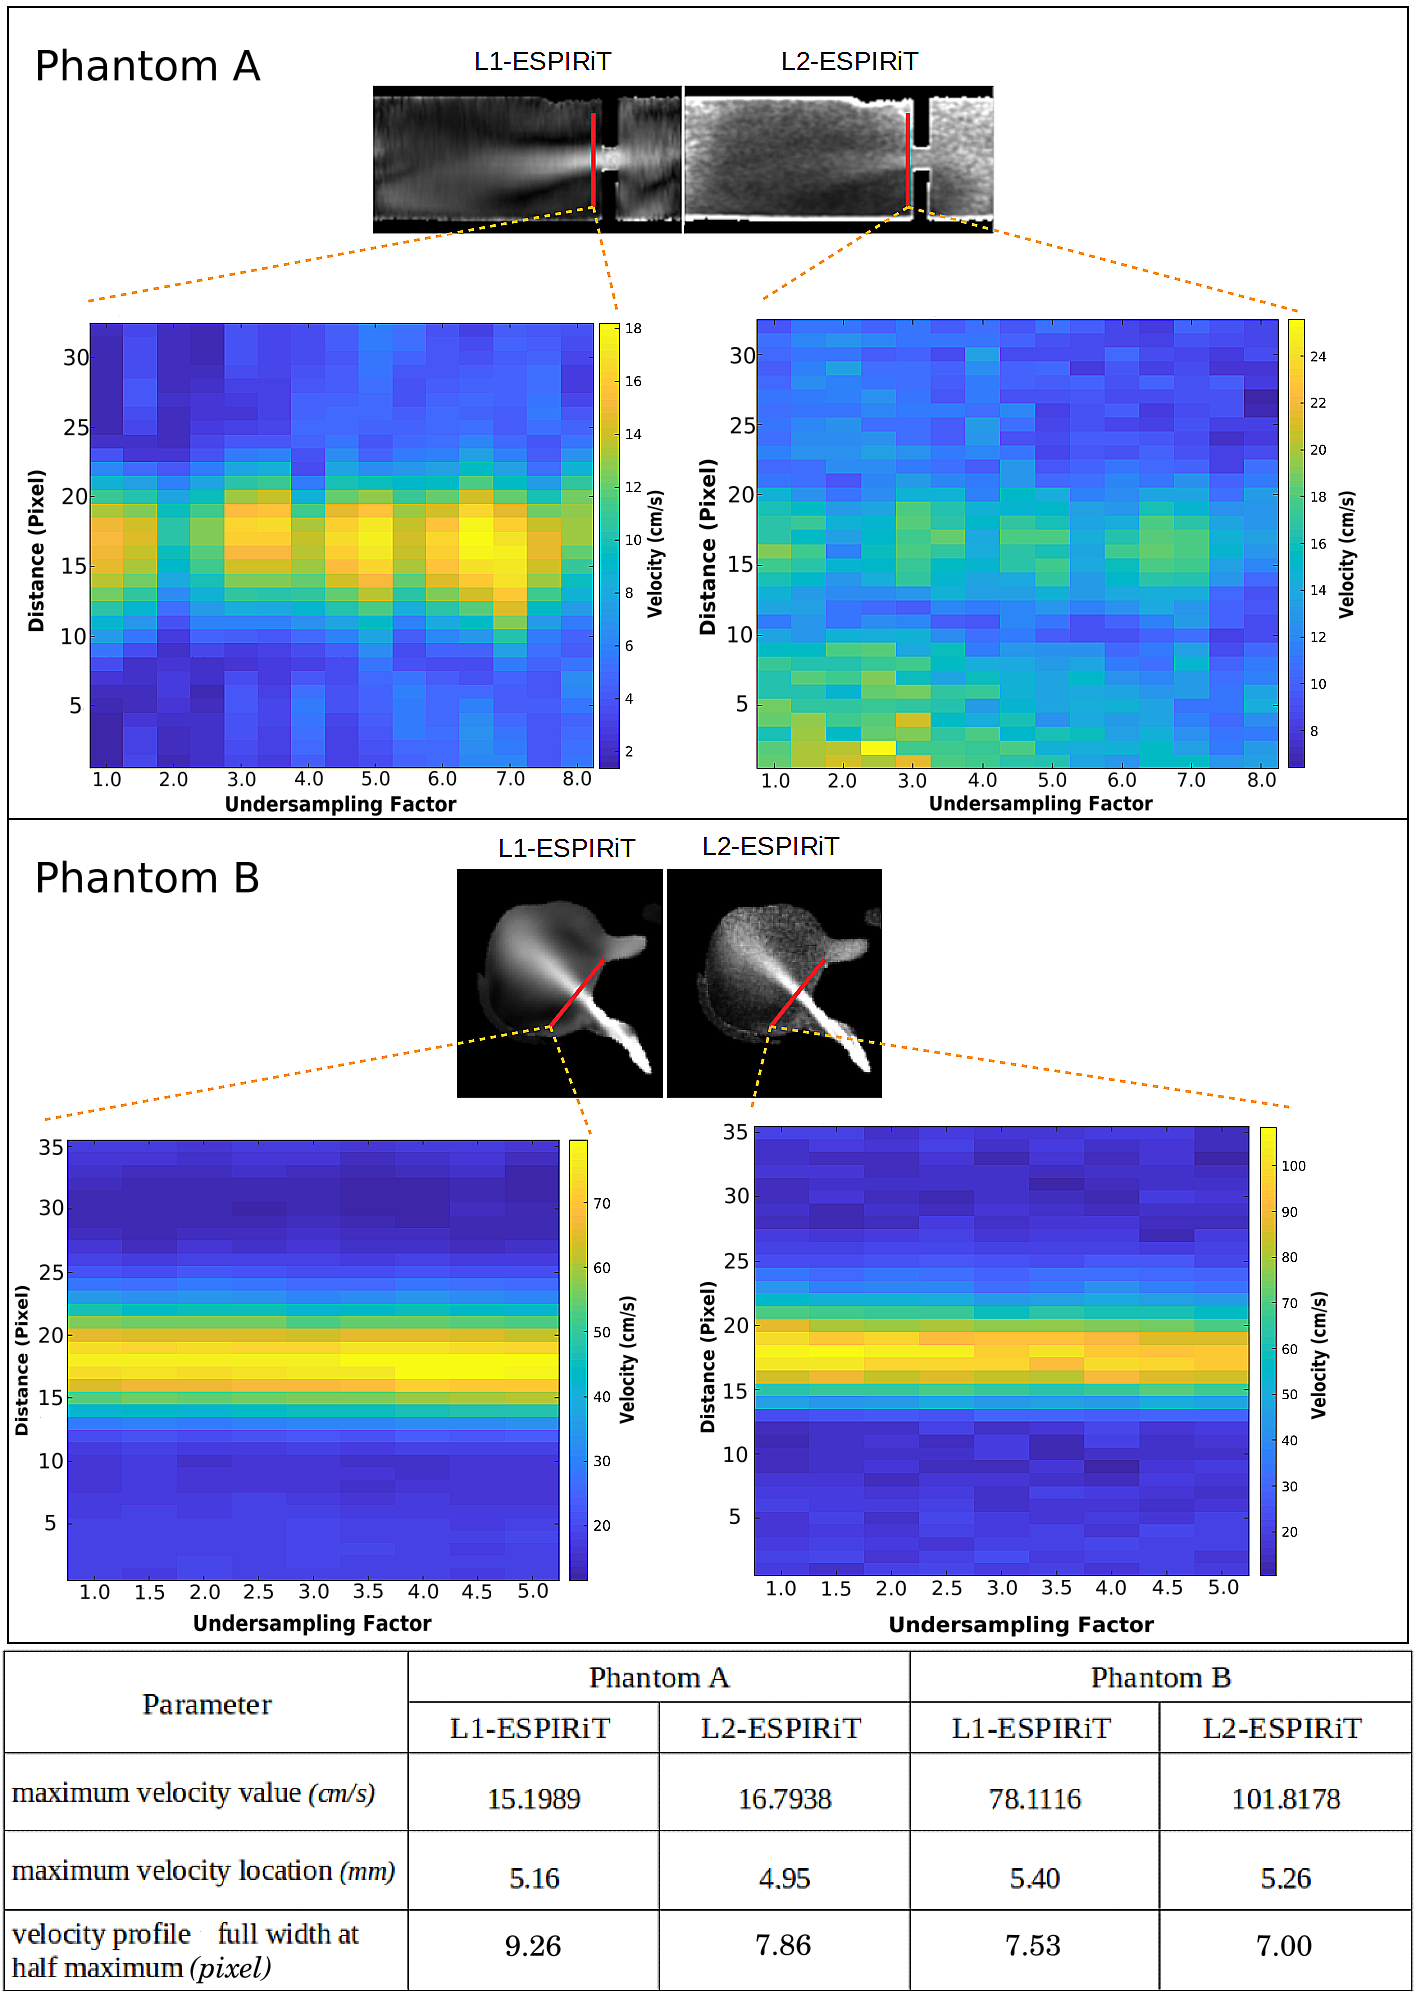
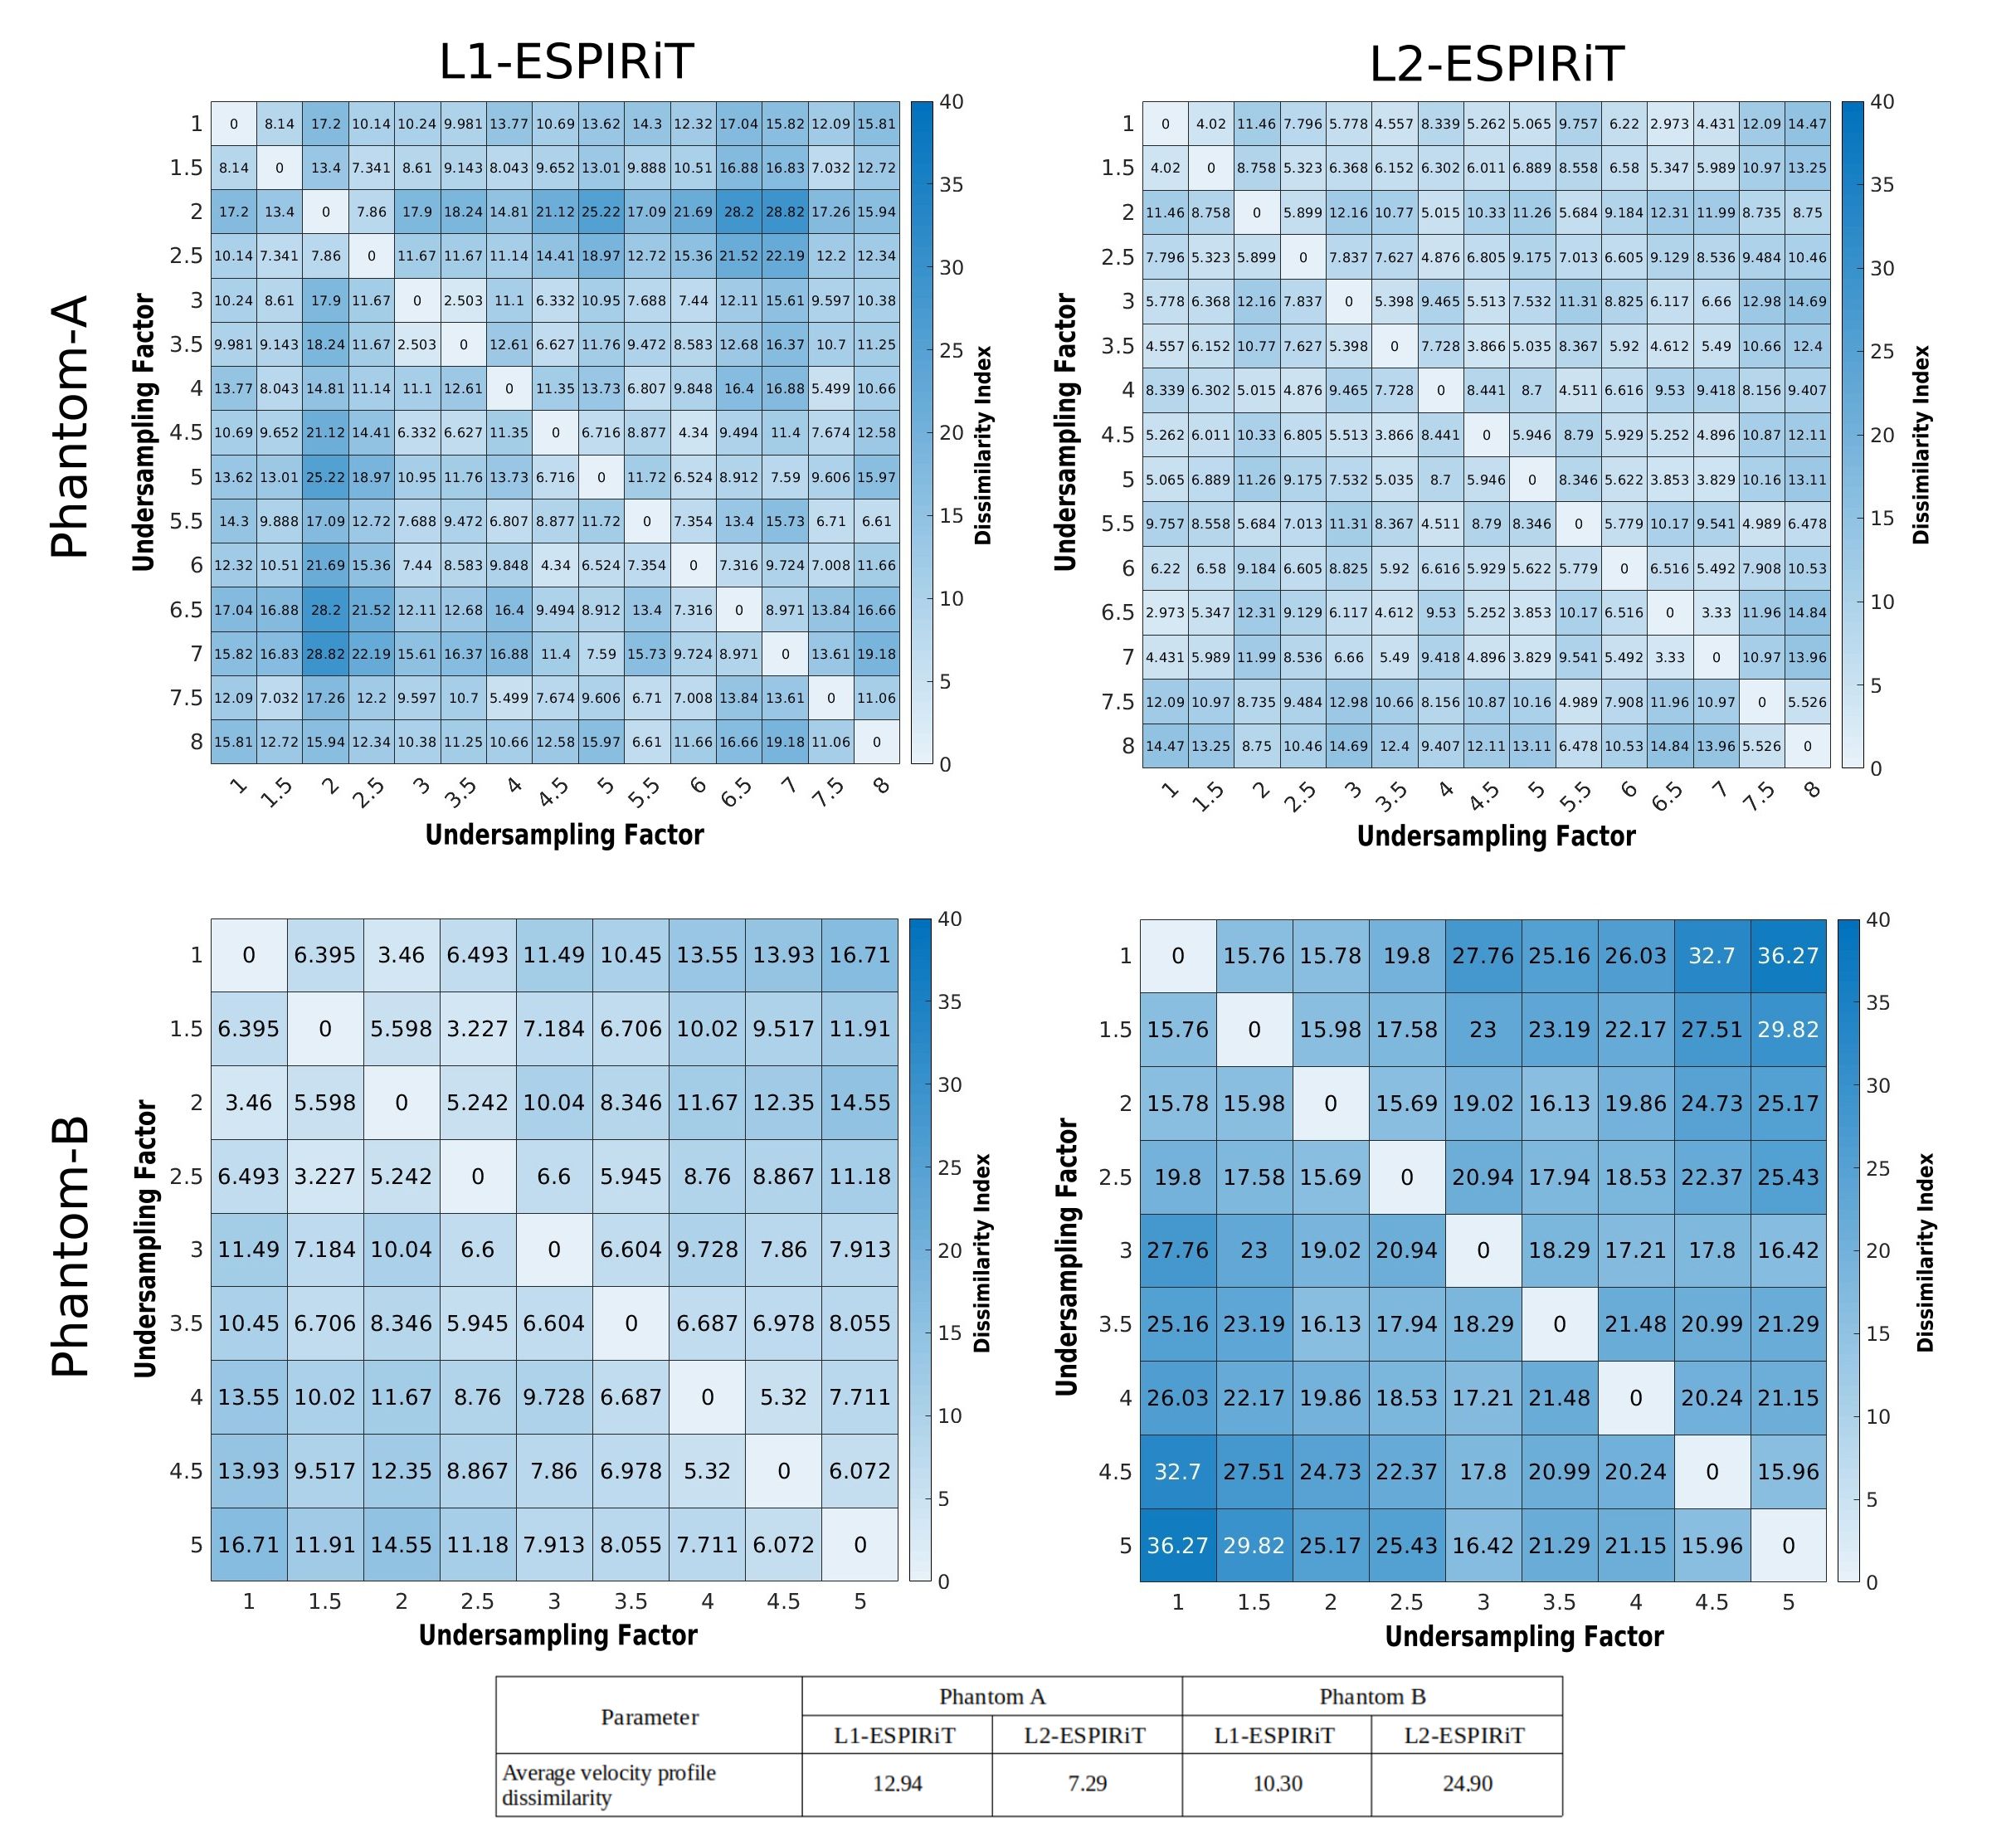
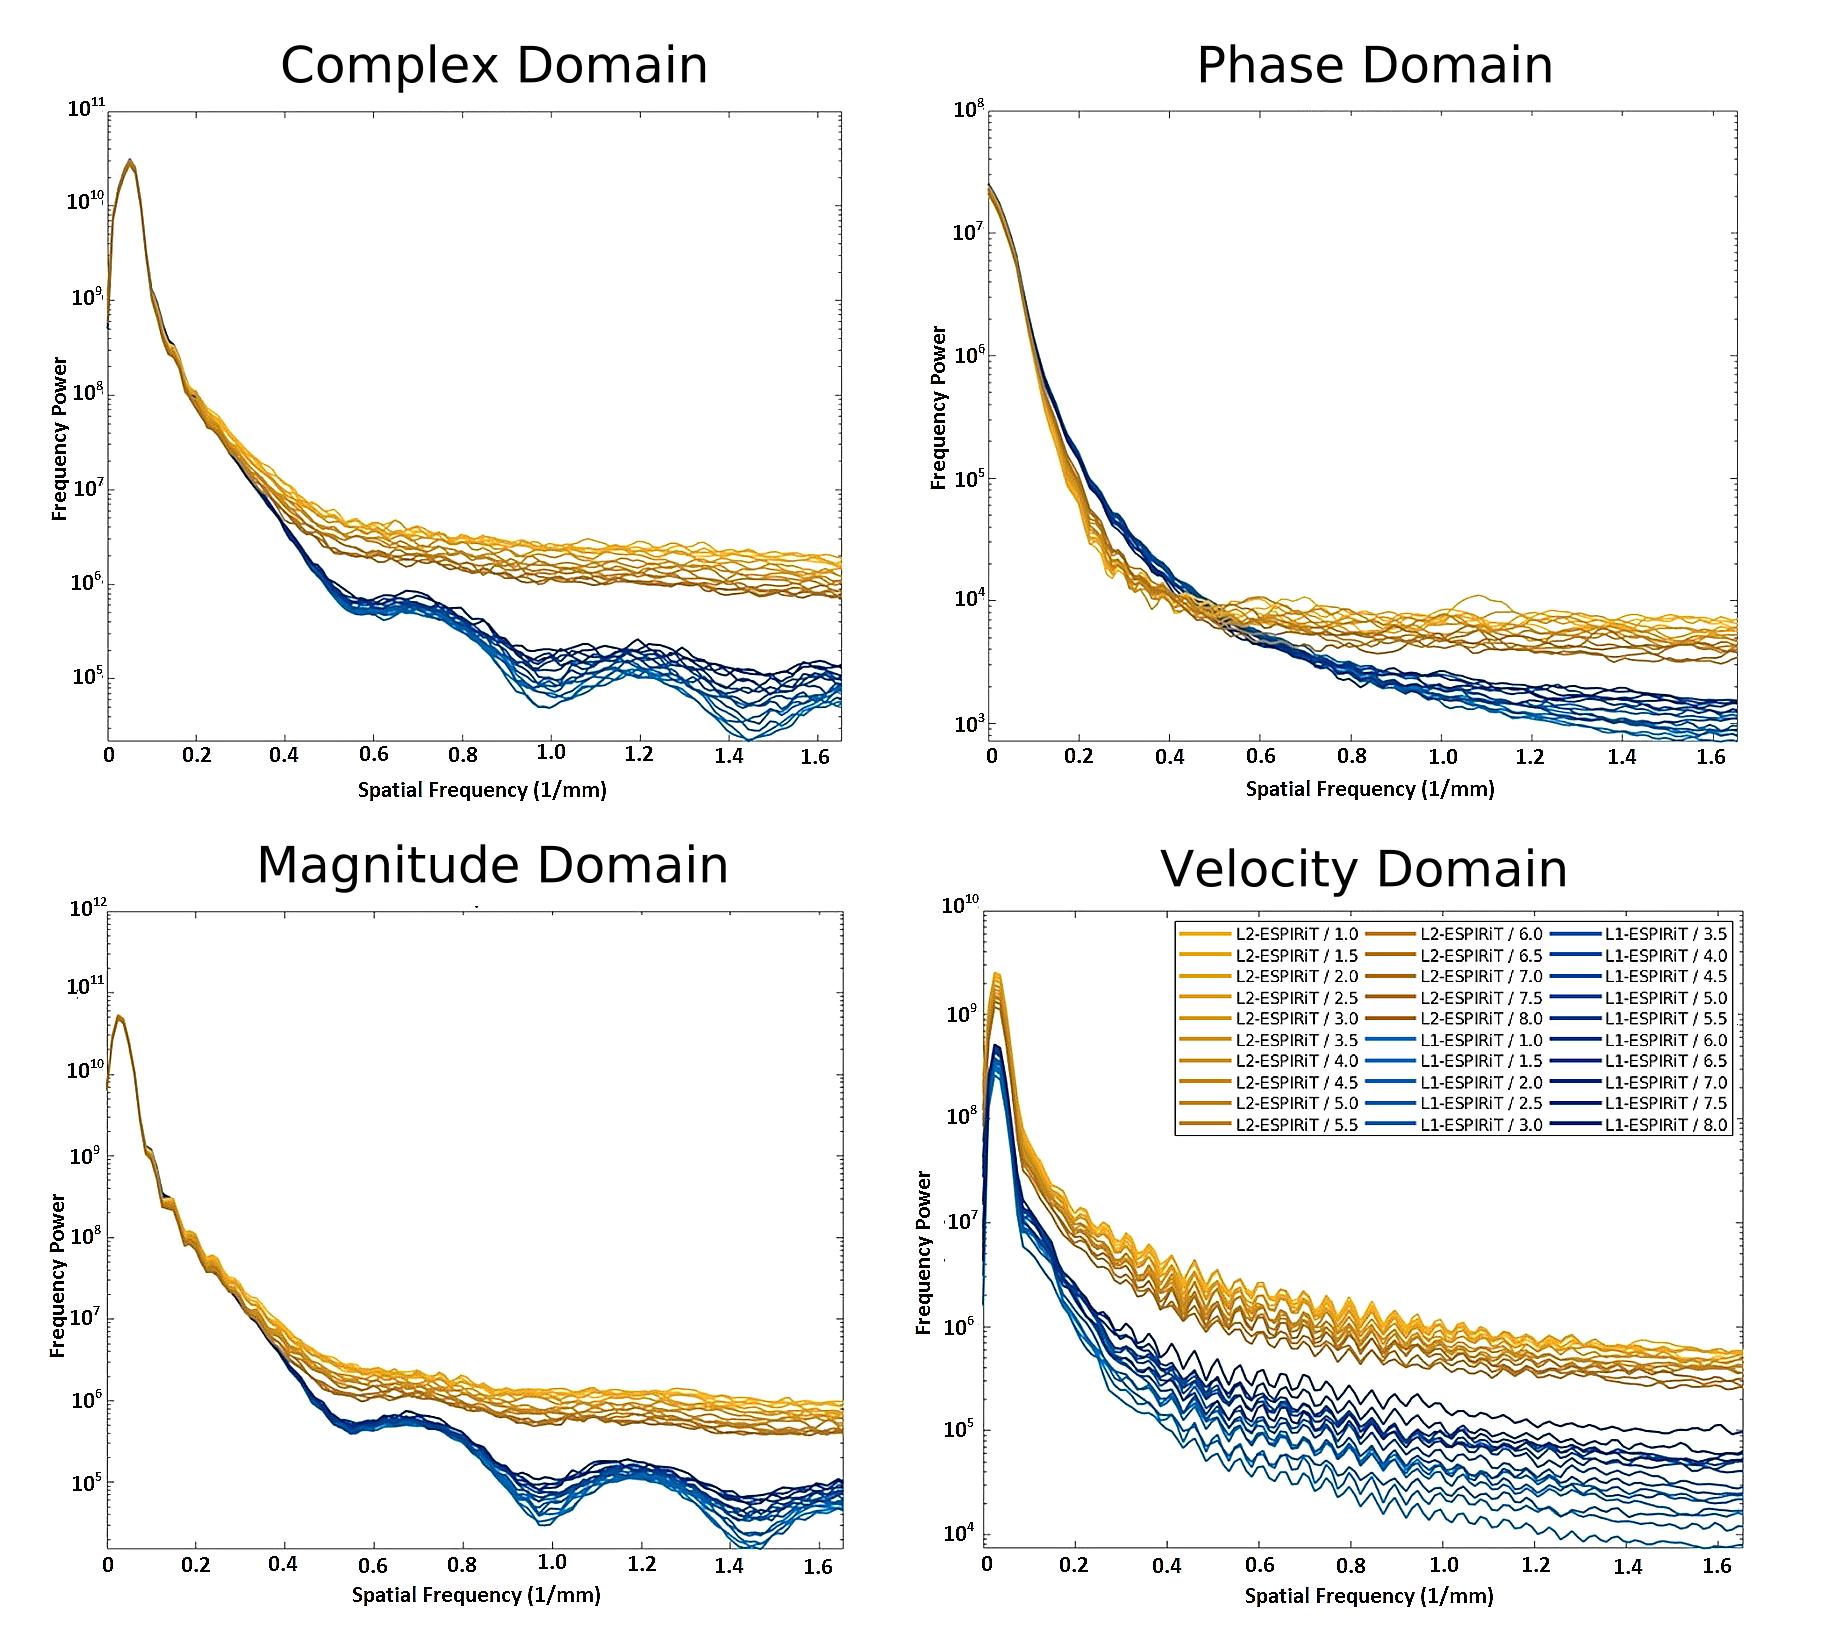
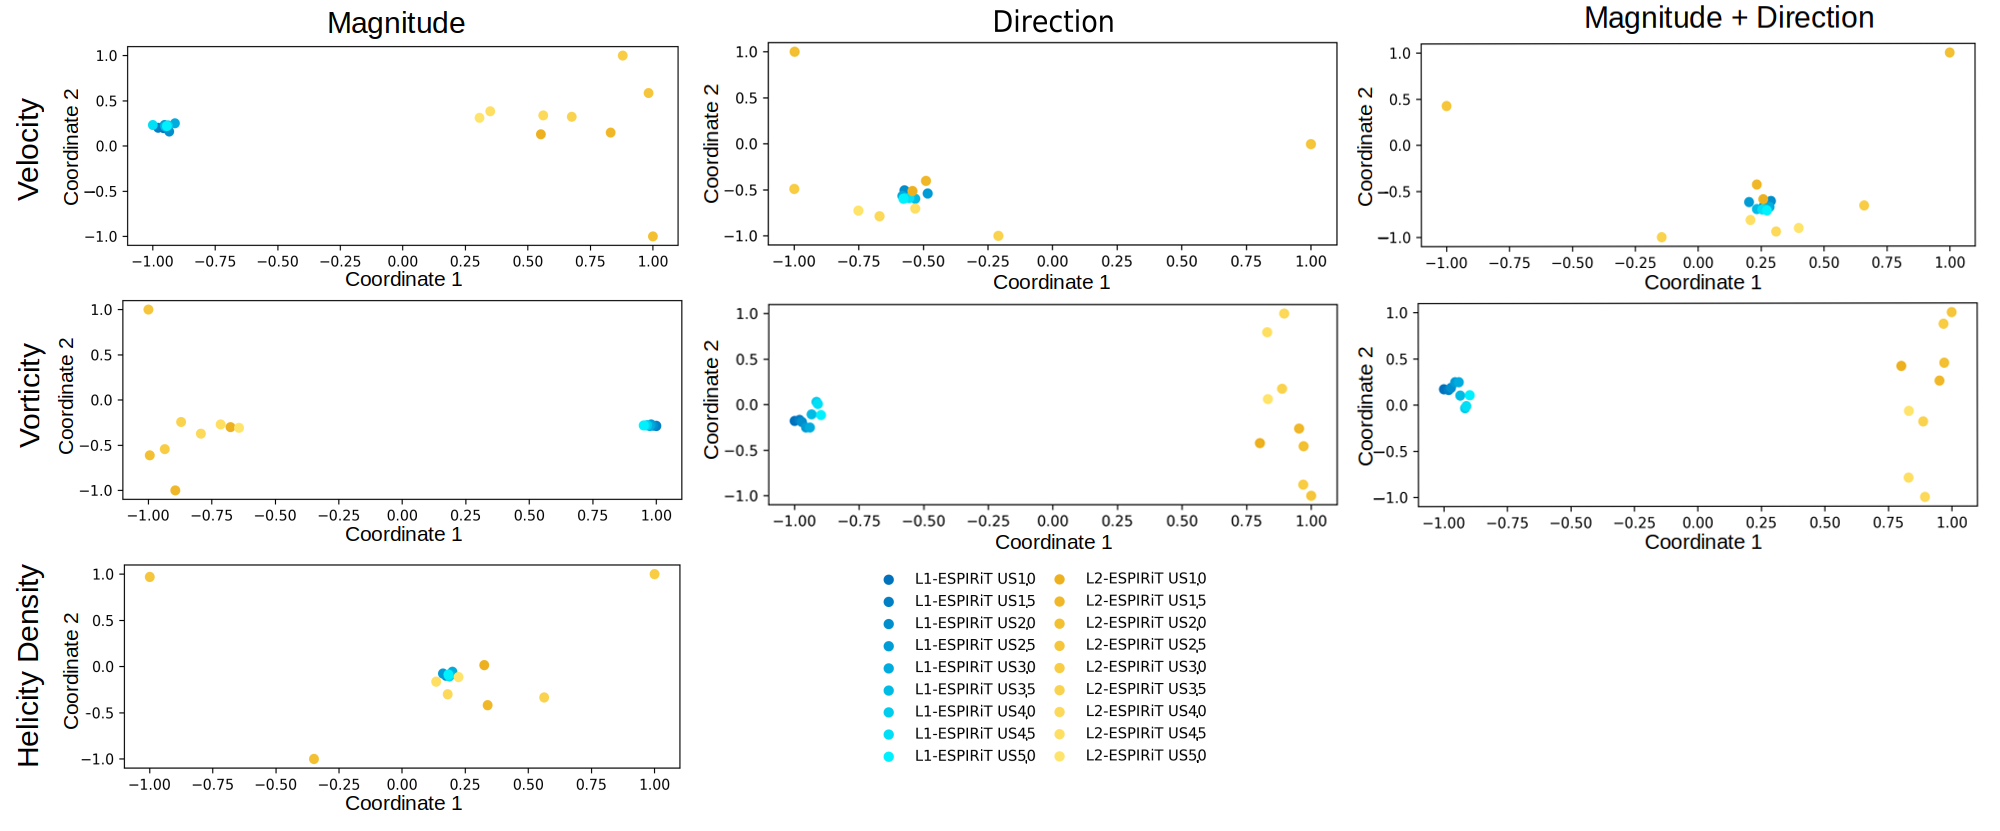
Two different designs of in-vitro flow phantoms were used in the current study; a tube containing a stenotic insertion with low maximum velocities (Phantom-A) and a 3D-printed latex aneurysm phantom with high maximum velocities (Phantom-B) (Figure 1). Both phantoms were scanned by a custom 4D-flow center-out radial stack-of-stars phase contrast sequence on a 9.4T Bruker BioSpec USR 94/20 System using the Hadamard encoding scheme and a vendor supplied 4-channel surface coil with the following parameters: TR=10 ms; TE=1.1/1.5 ms; FA=10°; BW=100 kHz; averages=1; resolution=(300*300*300) μm3; VENC=50 cm/s (Phantom-A) and 150 cm/s (Phantom-B); undersampling factors: 1-8 (Phantom-A) and 1-5 (Phantom-B). The undersampling interval was set to 0.5. After acquisition, complex images were offline reconstructed from the raw data using L1- and L2-ESPIRiT reconstruction (Berkeley advanced reconstruction toolbox 5) and 3D velocity maps were extracted using an in-house developed MATLAB (MathWorks, Natick, MA, USA) framework. For each undersampling factor in both phantoms, spatial velocity profiles were calculated from high velocity regions and were compared with each other using maximum velocity values and locations, full-width-at-half-maximum (FWHM), and Euclidean dissimilarity analysis. Additionally, 2D spectral power analysis (2D-SPA) of the magnitude, phase, and velocity images was performed for Phantom-A. Finally, pairwise dissimilarities between all measurements were calculated for the scalar and vector fields. A multidimensional scaling (MDS) approach was used to create a 2D embedding such that pairwise Euclidean distances between points in the embedding resemble the respective dissimilarities 6.RESULTS
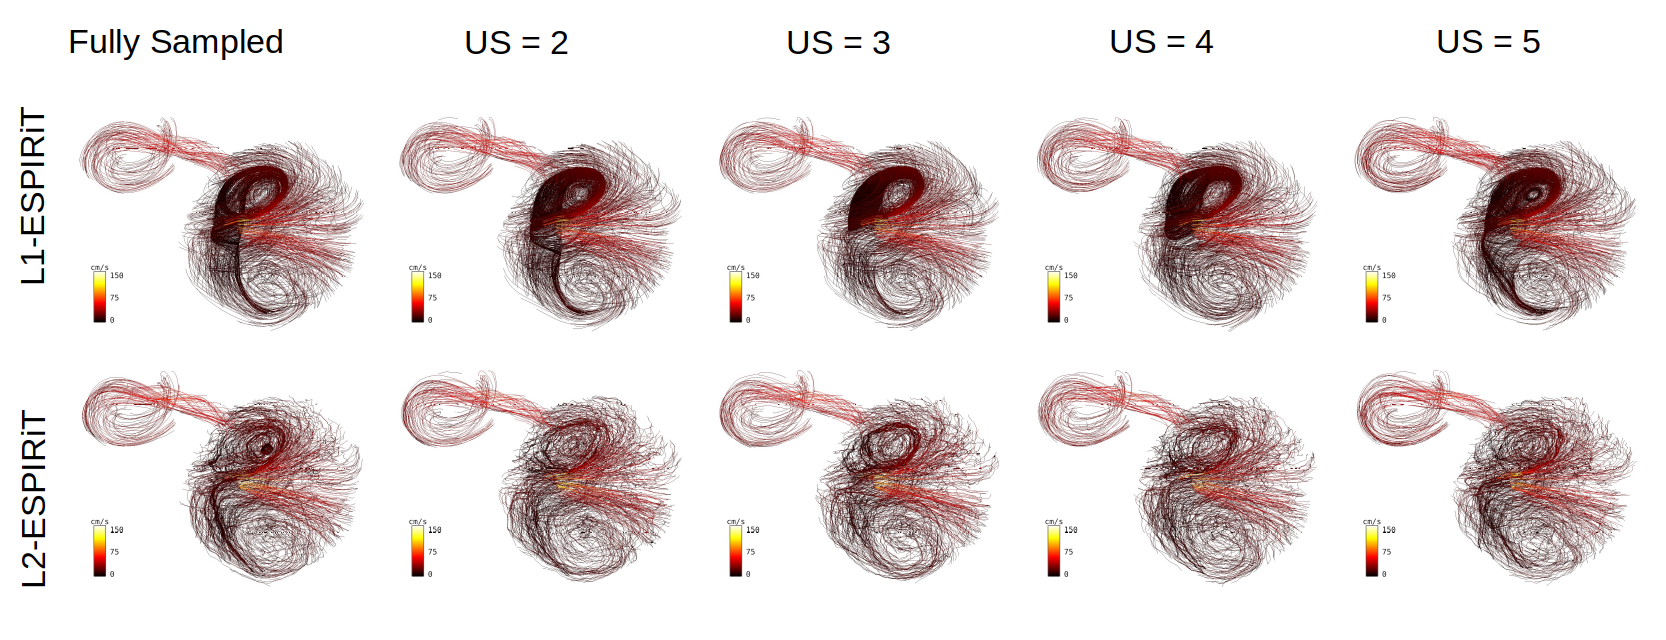
The results of the analysis of the spatial velocity profile measured with different undersampling factors showed that the maximum velocity values of the L1- and L2-ESPIRiT reconstructions were almost constant in Phantom-A, but changed substantially in Phantom-B (Figure 1). For both phantoms, the center point of the velocity profiles was identical with both reconstruction methods, but the FWHM was larger with L1-ESPIRiT than with L2-ESPIRiT (Figure 1). The averaged pair-wise velocity profile dissimilarity was higher with L1-ESPIRiT for Phantom-A and with L2-ESPIRiT for Phantom-B (Figure 2). The 2D-SPA of Phantom-A showed a half-SINC modulation in the complex signal domain after L1-ESPIRiT, which was still present in the magnitude of the signal but missing in the phase. In addition, the power of the high frequency components was on average lower in all signal domains with L1-ESPIRiT than with L2-ESPIRiT (Figure 3). This was also observed for the 2D-SPA of the velocity. Overall, the results of the MDS-based dissimilarity analysis of Phantom-B demonstrated that not only the velocity magnitudes extracted with the L1-ESPIRiT reconstruction differed largely from those extracted from L2-ESPIRiT reconstructions at different undersampling factors but also that the discrepancy between the L2-ESPIRiT and L1-ESPIRiT results increased after adding the information about the spherical angles of the velocity to the magnitude (Figure 4). This issue could be clearly noticed in the corresponding calculated streamlines (Figure 5). As the advanced hemodynamic parameters of vorticity and helicity density depend on the velocity vector field, they suffered from a more pronounced divergence after L2-ESPIRiT reconstruction (Figure 4).DISCUSSION
Traditionally, the influence of data undersampling on 4D-flow results have been examined mainly on the velocity-time profiles within big vessels by visual comparison or single-point statistics. This approach of analysis, however, is mostly inappropriate as the velocity is a vector field and not a scalar field. Our results of maximum velocity showed that L1-ESPIRiT tends to underestimate the velocity magnitudes within high velocity regions compared to L2-ESPIRiT. The 2D-SPA analysis of the velocity maps also confirmed changes in the spatial profiles with diminished low and high frequency components after L1-ESPIRiT; possibly caused by the soft thresholding algorithm within the wavelet domain modulating the velocity information. However, the pair-wise dissimilarity matrix revealed that the performance of the L1- and L2-ESPIRiT depended on velocity; i.e. L1-ESPIRiT produced less dissimilar results for high velocities than L2-ESPIRiT with various undersampling factors (Figure 2). This issue was also noticed by the MDS analysis as both the magnitude and direction of the velocity vector fields were changing more prominently with L2-ESPIRiT than L1-ESPIRiT. Because the spherical angles of the velocity vector fields were more consistent with L1-ESPIRiT, CS reconstructions appear to be reliable in terms of fluid path visualization, but further investigation is needed to evaluate limitations and advantages of both reconstruction methods.CONCLUSION
Our study shows that the L2-ESPIRiT reconstruction produces more dissimilar velocity vector fields at different undersampling factors compared to L1-ESPIRiT – both in magnitude and direction. The L1-ESPIRiT yields more stable directionality of the velocity vector fields, but underestimates the maximum velocity values compared to L2-ESPIRiT.Acknowledgements
The authors thank Mrs. Sara Moradi for her valuable discussions and support on image and data analysis.References
1. Dyverfeldt, P., et al., 4D flow cardiovascular magnetic resonance consensus statement. Journal of Cardiovascular Magnetic Resonance, 2015. 17(1): p. 72.
2. Morgan, A.G., et al., 4D flow MRI for non-invasive measurement of blood flow in the brain: A systematic review. J Cereb Blood Flow Metab, 2020: p. 271678x20952014.
3. Neuhaus, E., et al., Accelerated aortic 4D flow cardiovascular magnetic resonance using compressed sensing: applicability, validation and clinical integration. Journal of Cardiovascular Magnetic Resonance, 2019. 21(1): p. 65.
4. Sandilya, M. and S.R. Nirmala, Compressed sensing trends in magnetic resonance imaging. Engineering Science and Technology, an International Journal, 2017. 20(4): p. 1342-1352.
5. Martin Uecker, et al., Berkeley advanced reconstruction toolbox. Proceedings of the International Society for Magnetic Resonance in Medicine, 2015. 23: p. 2486.
6. Leistikow, S., et al., Interactive Visual Similarity Analysis of Measured and Simulated Multi-field Tubular Flow Ensembles, in 10th Eurographics Workshop on Visual Computing for Biology and Medicine, VCBM 2020, Tübingen, Germany. 2020, The Eurographics Association.
Figures