2085
Dual-venc Dual-echo 2D Cine Phase-contrast MRI1Philips Healthcare, Gainesville, FL, United States, 2Department of Pediatrics, Harvard Medical School, Boston, MA, United States, 3Philips Healthcare, Best, Netherlands
Synopsis
Phase-contrast (PC) cine MRI is used for the clinical assessment of blood flow in various cardiovascular diseases. One of the challenges of PC is a trade-off between velocity aliasing artifacts and velocity-to-noise ratio (VNR). To improve VNR without velocity aliasing, we implemented a novel dual-venc dual-echo 2D cine PC sequence where both high and low-venc data are acquired within a single TR and velocity is measured using data from both venc images. In 10 patients, the dual-venc PC sequence demonstrated similar blood flow measurements with significantly better VNR compared to the standard single-venc PC sequence.
Introduction
Time-resolved cine phase-contrast (PC) MRI is widely used for the assessment of blood flow in various cardiovascular diseases.1,2 In a PC acquisition, the velocity sensitivity (venc) is typically pre-defined to a value higher than the expected maximum velocity to avoid aliasing. Vessels with a wide velocity range suffer from a lower velocity-to-noise ratio (VNR), particularly in the slower velocity ranges. To improve VNR without aliasing artifacts, we sought to develop a dual-venc dual-echo 2D cine PC sequence to acquire high and low-venc images simultaneously and use data from both vencs for the velocity measurement.Methods
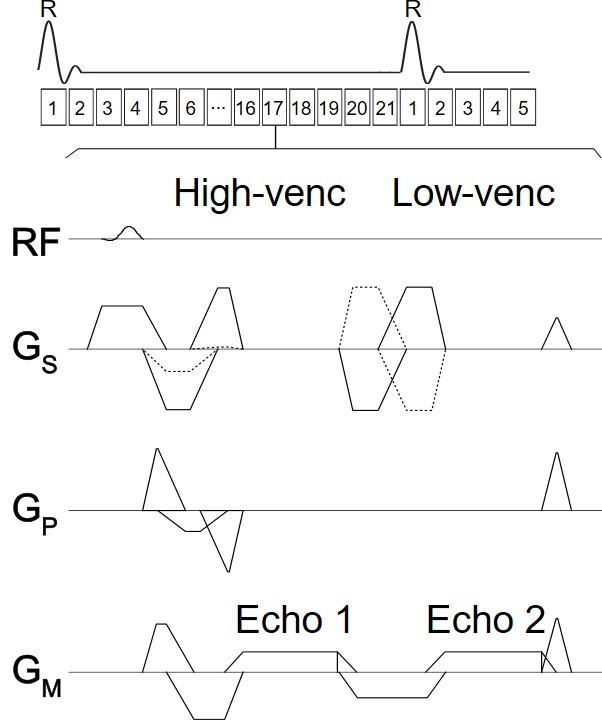
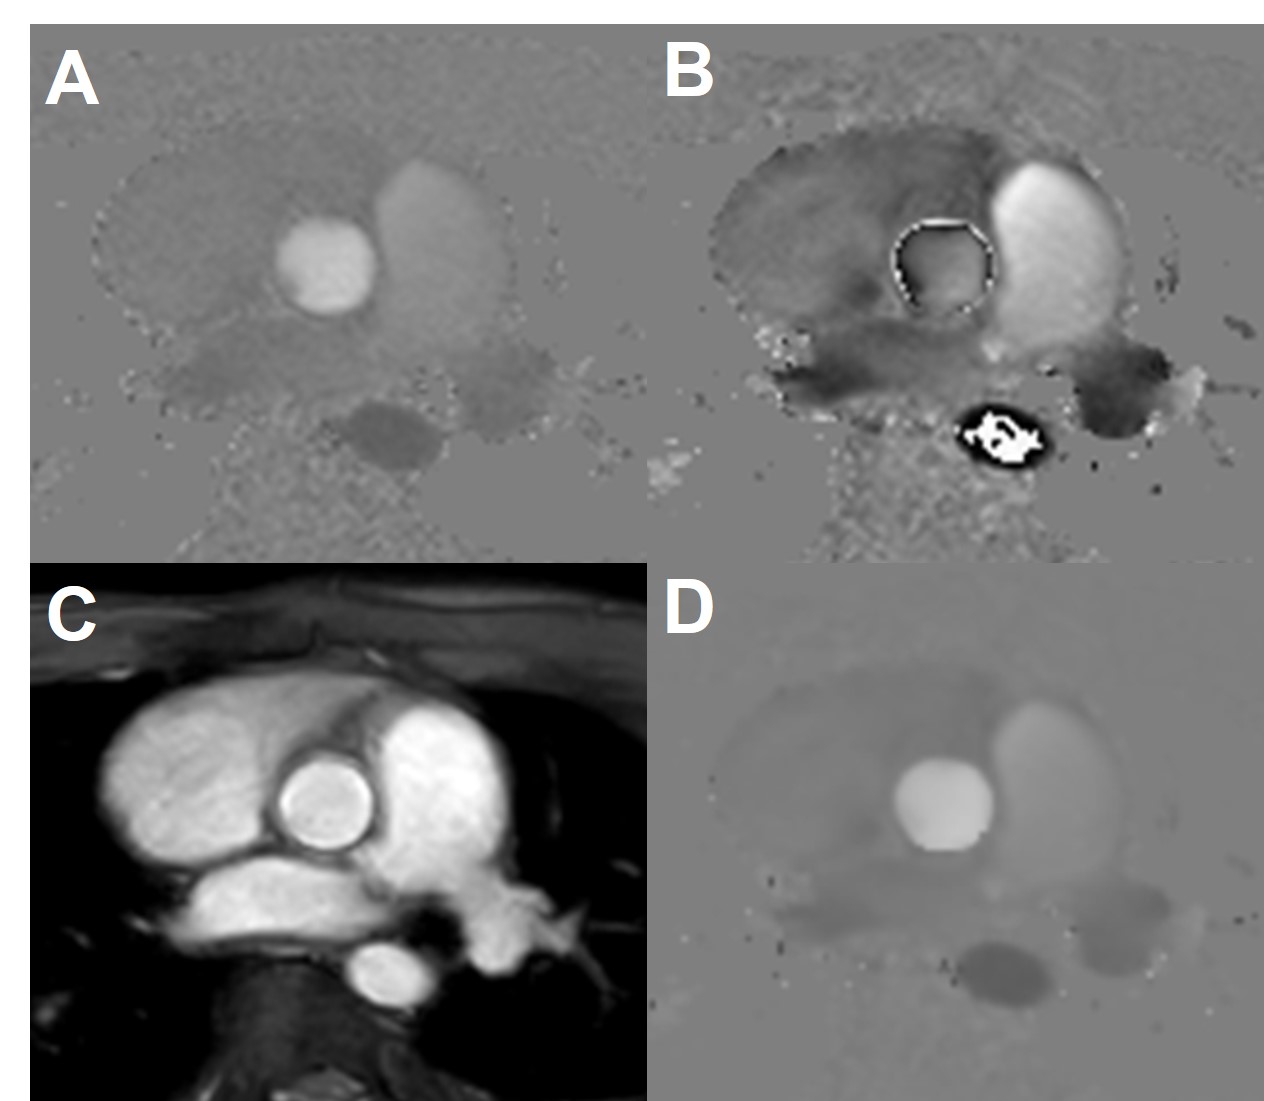
A novel retrospective ECG-gated 2D cine dual-venc dual-echo PC sequence was developed on a 1.5T Achieva-dStream Philips scanner. To minimize the acquisition time associated with the additional venc, the second venc was acquired in a second echo within a single TR3 and flyback gradients were employed to maintain the same gradient polarity and minimize phase errors (Figure 1). Velocity was measured by unwrapping the velocity of the low-venc and using the high-venc phase image as an unwrapping threshold (Figure 2). To minimize the impact of the unwrapping border effects, a bilateral filter for edge-preserving smoothing4 was applied after the unwrapping of the phase image. Magnitude images from both echoes were averaged to improve the signal-to-noise ratio.The standard single-venc PC and the dual-venc dual-echo PC data were acquired in 10 patients referred for clinical cardiac MRI exams (4 female, median age 21 (14-41) years old). All patients provided written consent before participating in the study. Single-venc was acquired with venc of 200 – 350 cm/s, and dual-venc was acquired with a high-venc identical to the single-venc sequence and a low-venc of 50 cm/s. TR/TE for single-venc was 4.8 ms/2.9 ms and for dual-venc was 7.9 ms/(2.9, 6.0) ms. This results in a scan time of 1:13 min vs 2.01 min for single-venc vs. dual-venc at a heart rate of 60 bpm. Other imaging parameters were identical between the single-venc and dual-venc sequences: spatial resolution = 1.56 × 1.56 mm, slice thickness = 6 mm, field-of-view = 275 x 275 mm, flip angle = 12°, acquired heart phases = 21 reconstructed to 30, compressed SENSE = 2, and number of signals averages = 3.
Net blood flow and peak velocity were measured in the single and dual-venc PC sequences acquired to measure flow in the main pulmonary artery (MPA) and in the ascending aorta (AAo). The VNR was measured as the ratio of the mean velocity to the standard deviation5 of velocity during diastole in the MPA and AAo, and compared between single and dual-venc PC MRI. The measured blood flow and VNR were statistically compared using a non-parametric Wilcoxon signed-rank test and p<0.05 was considered statistically significant. The intraclass correlation coefficient was calculated to measure the agreement.
Results
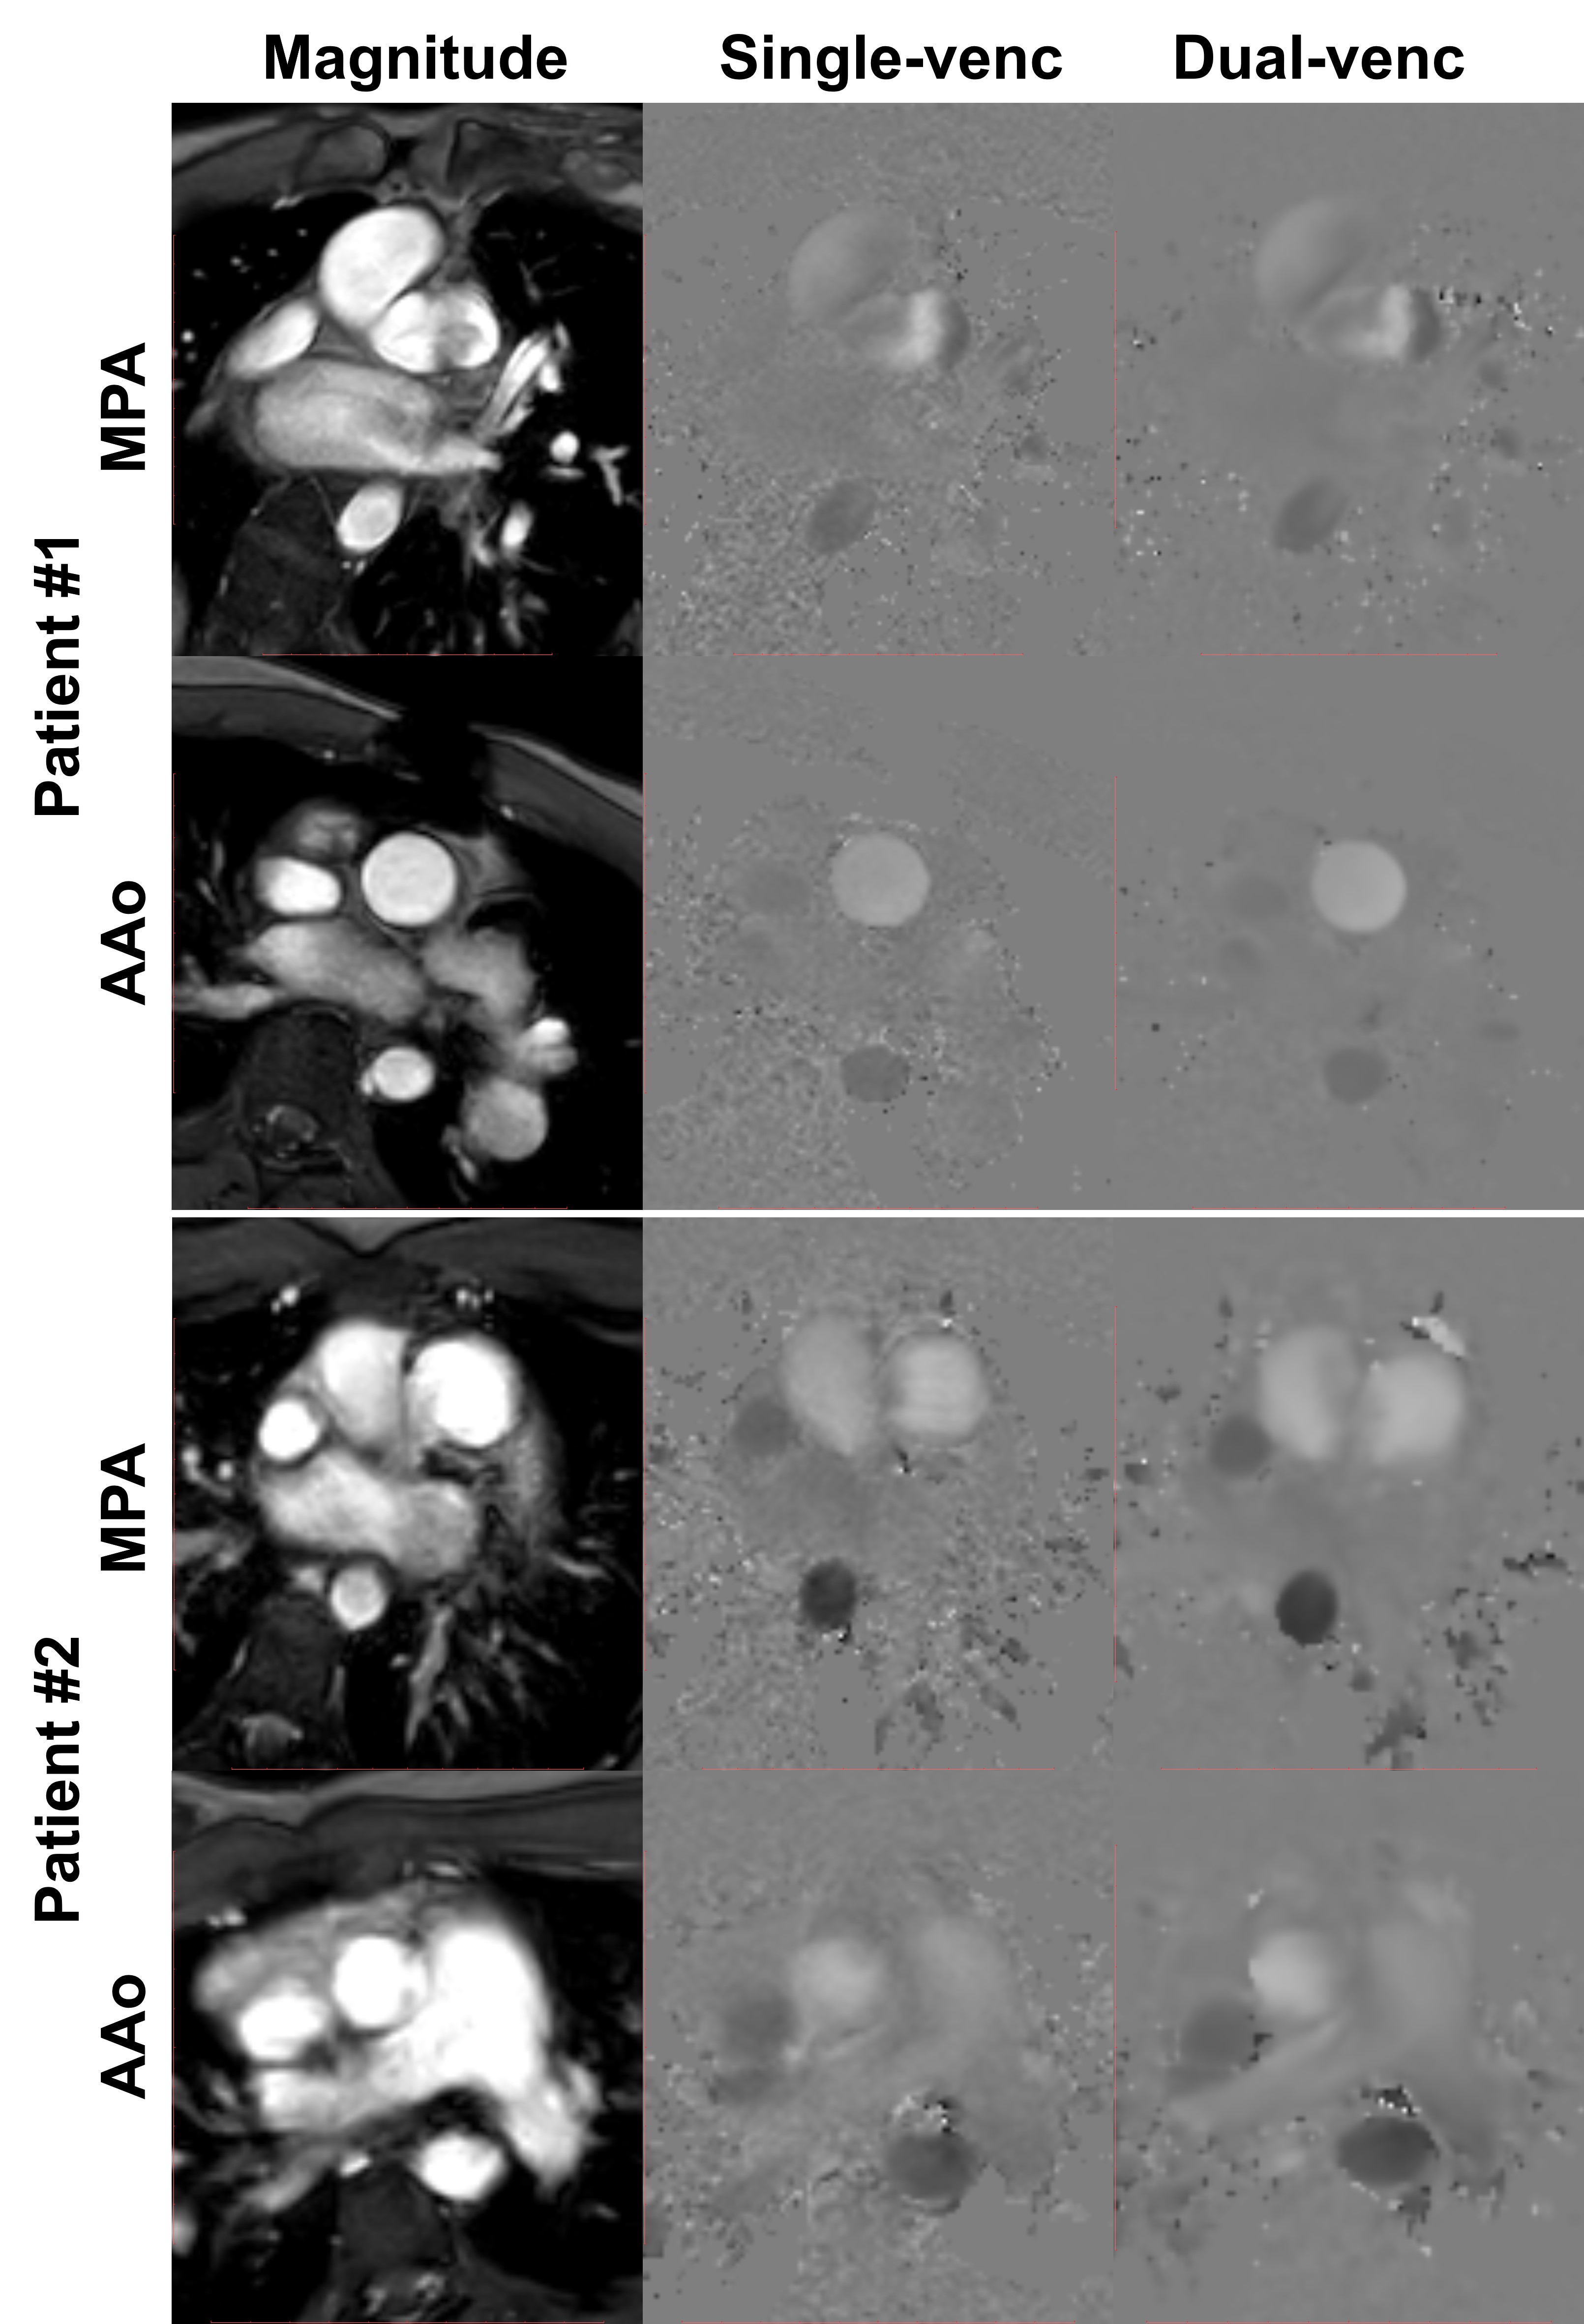
The dual-venc dual-echo PC sequence demonstrates similar blood flow measurements in both the MPA and AAo and had improved VNR compared to the standard single-venc PC sequence (Figure 3). Table 1 summarizes the blood flow measurements in MPA and AAo. The dual-venc sequence demonstrated comparable net blood flow to the standard single-venc PC sequence (MPA: 112 ± 52 ml vs. 110 ± 55 ml, p-value=0. 39; and AAo: 93 ± 26 ml vs. 96 ± 32 ml, p-value=0.72) and peak velocity (MPA: 143 ± 78 cm/s vs. 140 ± 80 cm/s, p-value=0.26; and AAo: 135 ± 38 cm/s vs. 134 ± 36 cm/s, p-value=0.59). The dual-venc sequence demonstrated higher VNR compared to the standard single-venc PC sequence (MPA: 0.78 ± 0.94 vs. 1.49 ± 1.00, p-value=0.01; and AAo: 0.64 ± 1.11 vs. 0.97 ± 1.10; p-value=0.02).Discussion
Our novel retrospectively ECG-gated 2D cine dual-venc dual-echo PC sequence demonstrates comparable blood flow measurements in the MPA and AAo and improved VNR. The application of this technique in vessels with a wide velocity range such as the AAo in aortic regurgitation and in a 4D flow sequence for the simultaneous assessment of the arterial and venous blood flow will be investigated in future studies.Conclusion
Dual-venc dual-echo 2D cine PC sequence demonstrates higher VNR and comparable blood flow measurements in the MPA and AAo. Future work will focus on incorporating this technique for the 4D flow sequence and using this technique in routine clinical practice.Acknowledgements
No acknowledgement found.References
1. Pelc NJ, Herfkens RJ, Shimakawa A, Enzmann DR. Phase contrast cine magnetic resonance imaging. Magn Reson Q 1991;7:229–254.
2. Rebergen SA, van der Wall EE, Doornbos J, de Roos A. Magnetic resonance measurement of velocity and flow: technique, validation, and cardiovascular applications. Am Heart J 1993;126:1439–1456.
3. Ajala A, Zhang J, Pednekar A, Buko E, Wang L, Cheong BY, Hor PH, Muthupillai R. Mitral valve flow and myocardial motion assessed with dual-echo dual-velocity cardiac MRI. Radiology: Cardiothoracic Imaging. 2020 Jun 25;2(3):e190126.
4. Paris S, Durand F. A fast approximation of the bilateral filter using a signal processing approach. International journal of computer vision. 2009 Jan 1;81(1):24-52.
5. Bhabatosh C. Digital image processing and analysis. PHI Learning Pvt. Ltd.; 2011.
Figures