2083
Limits of Turbulent Flow Spectrum Encoding using 4D Flow MRI1Institute for Biomedical Engineering, University and ETH Zurich, Zurich, Switzerland
Synopsis
This work employs spectral interpretation of velocity encoding gradients (VEG) to assess their encoding power of fluctuating velocities in turbulent flows. Using CFD and MRI simulations based on particle tracking, it is shown that Reynolds Stress Tensor values are underestimated for VEG frequencies typically used in 4D Flow MRI, while mean velocity estimation is not impacted.
Introduction
Estimation of mean and turbulent velocities from 4D Flow MRI enables detection of elevated shear stresses1,2 downstream of stenoses3-6. Quantification of the full Reynolds stress tensor (RST) allows for improved estimation of pressure gradients across valves and stenotic sections7 which holds potential for clinical decision making8.Turbulence quantification in 4D Flow MRI exploits encoding of the intravoxel standard deviation (IVSD) in the magnitude image data9. Due to dephasing given the (Gaussian) distribution of intra-voxel velocities during the velocity encoding gradients, the damping factor$$$\;\alpha(t)\;$$$is observed in the ensemble-averaged signal$$E(t)=\exp\left(\mathrm{j}\varphi_v(t)-\alpha(t)\right)\;,\quad\quad(1)$$in addition to the phase component$$$\;\varphi_v(t)\;$$$which represents voxel-mean velocity (volume integral and spatial encoding omitted for brevity).
The necessary assumption for estimating intravoxel random motion (IVSD) in 4D Flow MRI is based on the correlation time scale$$$\;T_0\;$$$relating to the duration of the velocity encoding gradient (VEG)$$$\;\tau\;$$$such that$$T_0 << \tau \;, \quad \quad(2)$$where$$$\;T_0\;$$$was estimated around 10ms9 based on 4D Flow MRI data10. However, in-vitro measurements of realistic flow conditions using Laser Doppler Anemometry (LDA; cardiac output 5l/min, viscosity$$$\;\nu=3.03\mathrm{mm}^2/\mathrm{s}$$$) predict$$$\;T_0\approx1\mathrm{ms}\;$$$11. This may invalidate Eq.2. Employing a spectral interpretation12,13, the frequency response of VEGs can be compared to the random motion spectrum to be imaged and it is readily seen that only at the limit of infinitely short gradient lobes the turbulent velocity spectrum is probed correctly14.
In this work, the random motion encoding power of velocity encoding gradients (VEG) as used in 4D Flow MRI is studied for a range of motion spectra derived from CFD of stenotic flows. Results demonstrate that VEGs with durations on the order of ms underestimate the IVSD by as much as 50%.
Methods
A CFD simulation was performed on a stenosed tube (75% area reduction15) using a large-eddy simulation (LES) approach in OpenFOAM v1912 with steady inlet conditions. The inlet Reynolds number was 4000 and viscosity of blood was used ($$$\nu=2.7\mathrm{mm}^2/\mathrm{s}$$$). Time-resolved slices along the flow direction were exported and used as input for subsequent MRI turbulence encoding simulations.A previously presented particle tracking MRI simulation framework16 was extended with GPU utilization to include random motion using a discrete random-walk model
$$ x’ = \zeta \sqrt{\bar{x’^2}}, \; x’ = {u’, v’} \;, \quad\quad (3) $$
where$$$\;\zeta\;$$$is a normally distributed random number,$$$\;\sqrt{\bar{x’^2}}\;$$$the local RMS value of the velocity fluctuations in $$$u,v$$$ directions and$$$\;x’\;$$$the resulting fluctuating velocity to be added to the particles’ mean velocity.$$$\;x’\;$$$was kept constant for$$$\;T_L=1/(2f_{eddy})$$$, where$$$\;f_{eddy}\;$$$varies over simulation time depending on the particles’ positions.
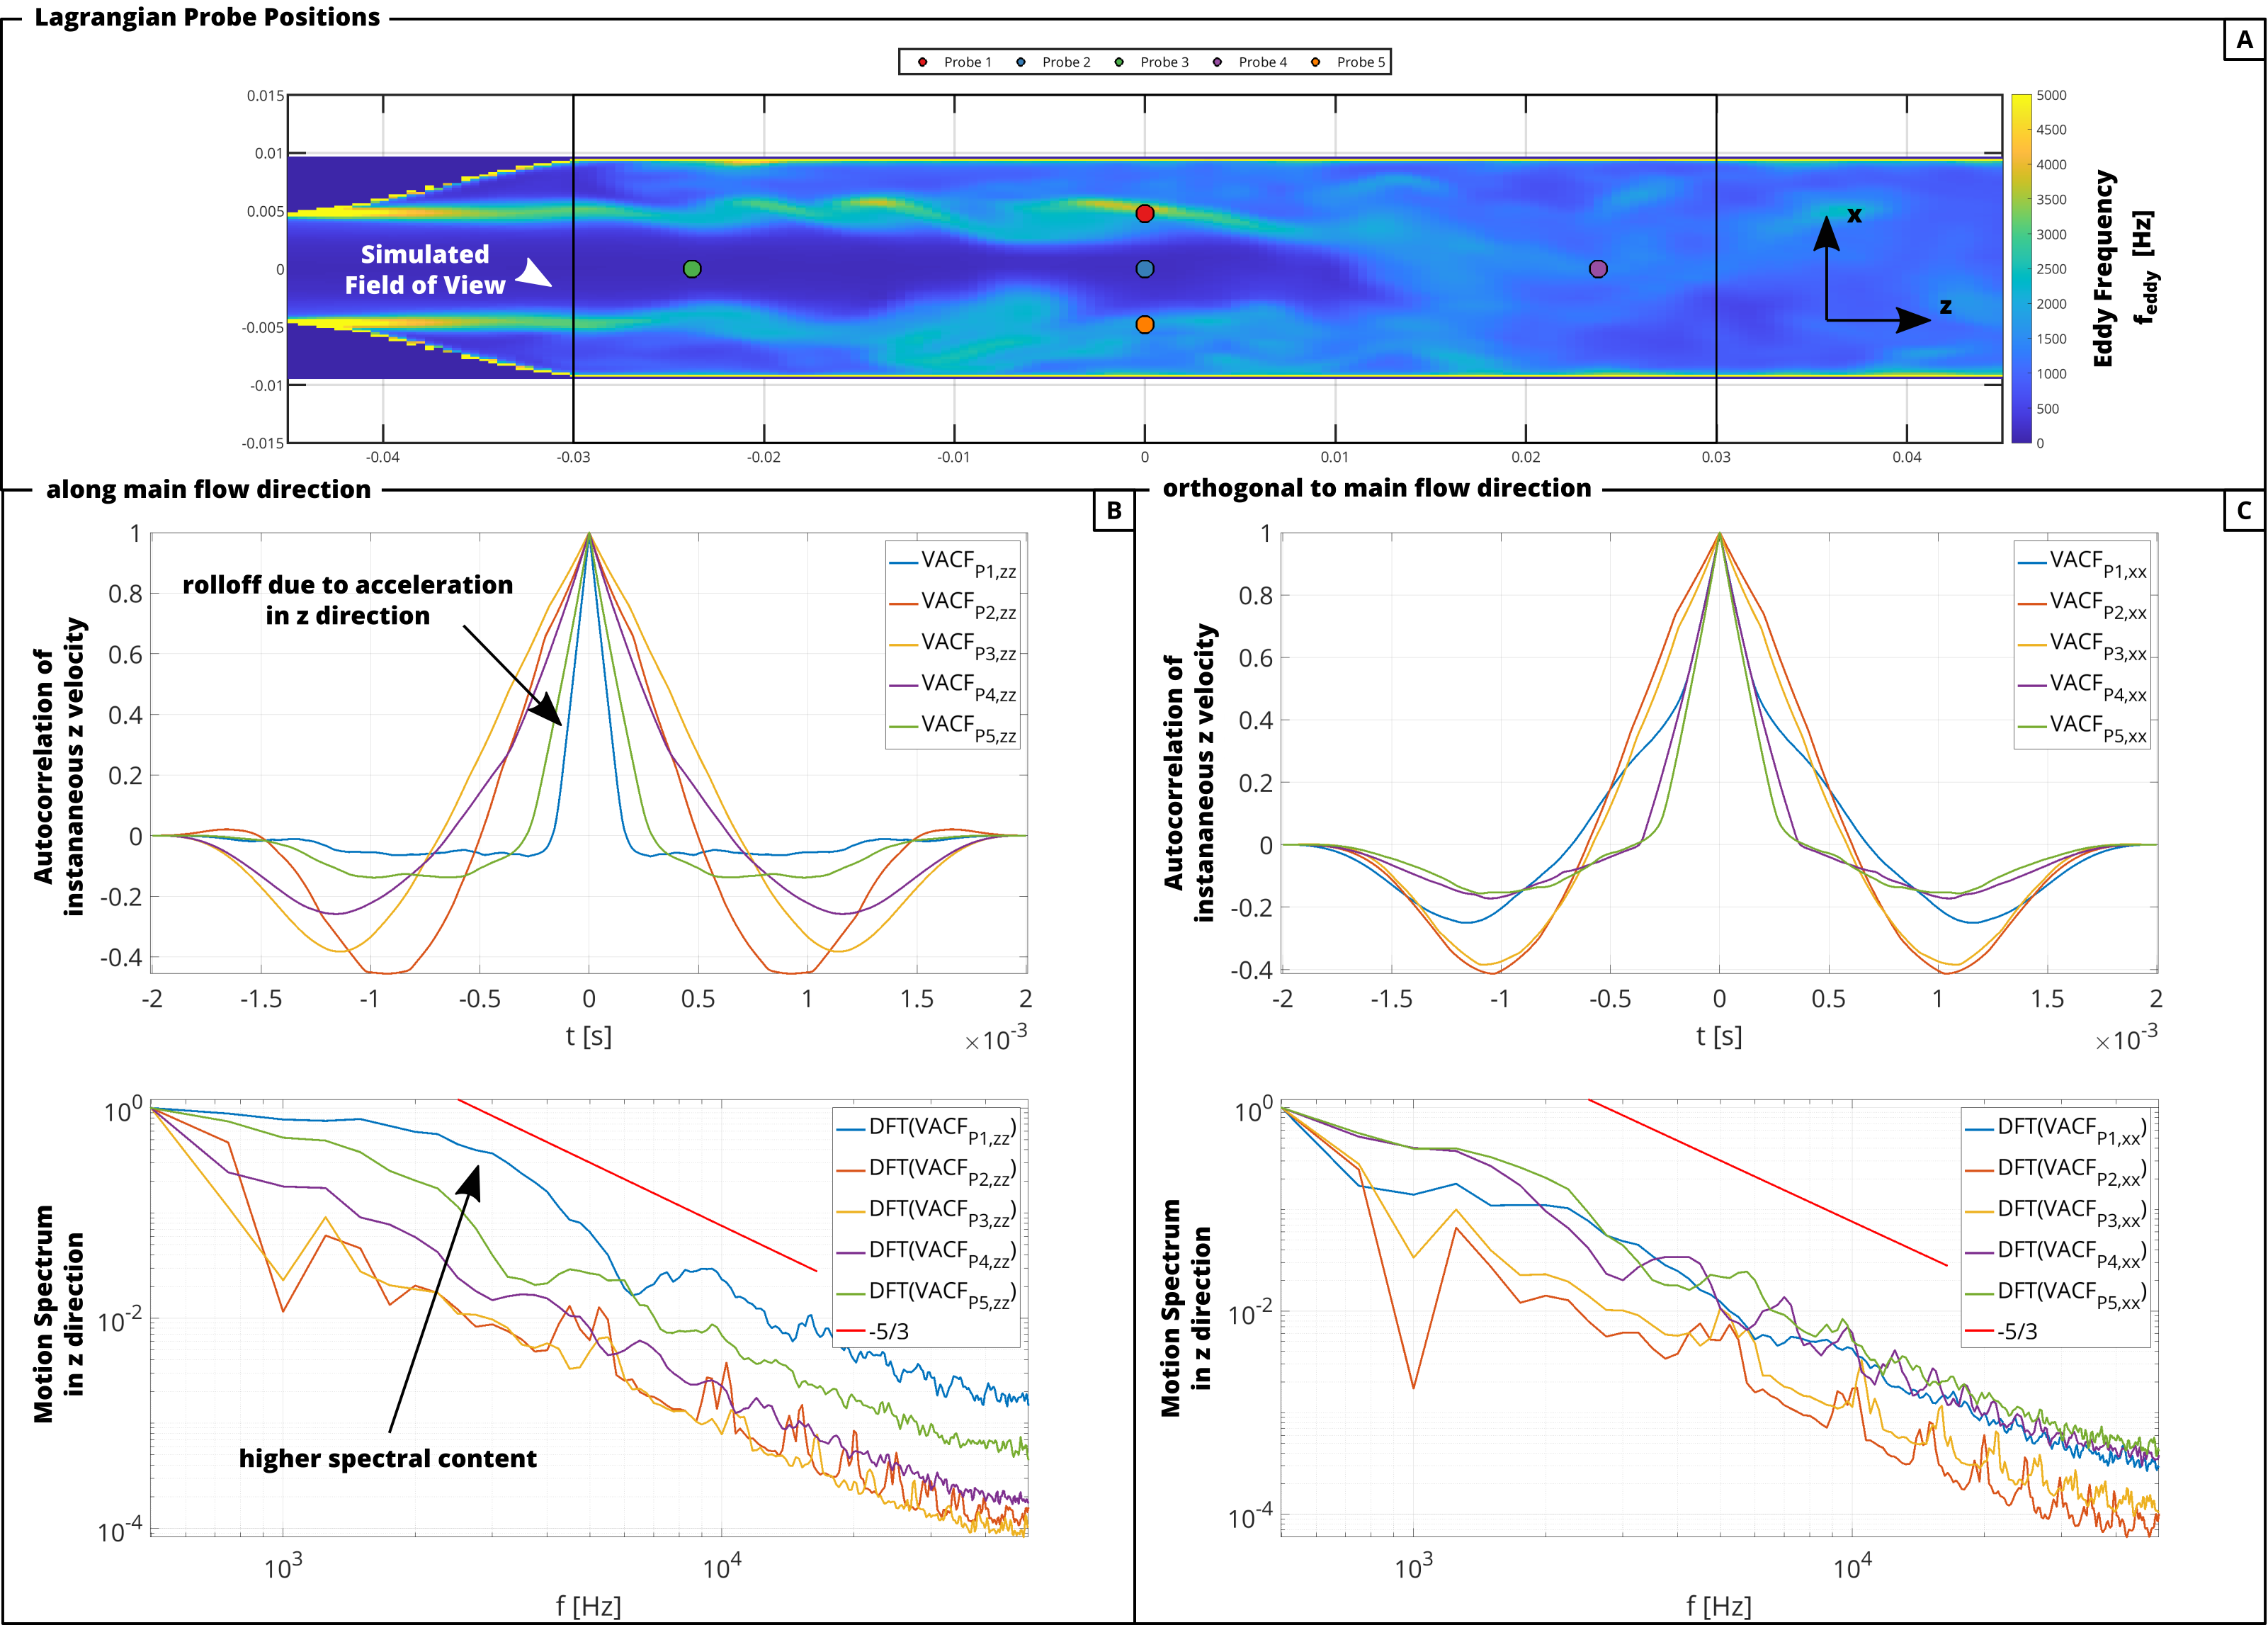
Particles’ instantaneous velocities were recorded during simulation time. The autocorrelation of these velocities was calculated and Fourier transformed to output the velocity spectrum. Probing positions are depicted in Figure 2A.
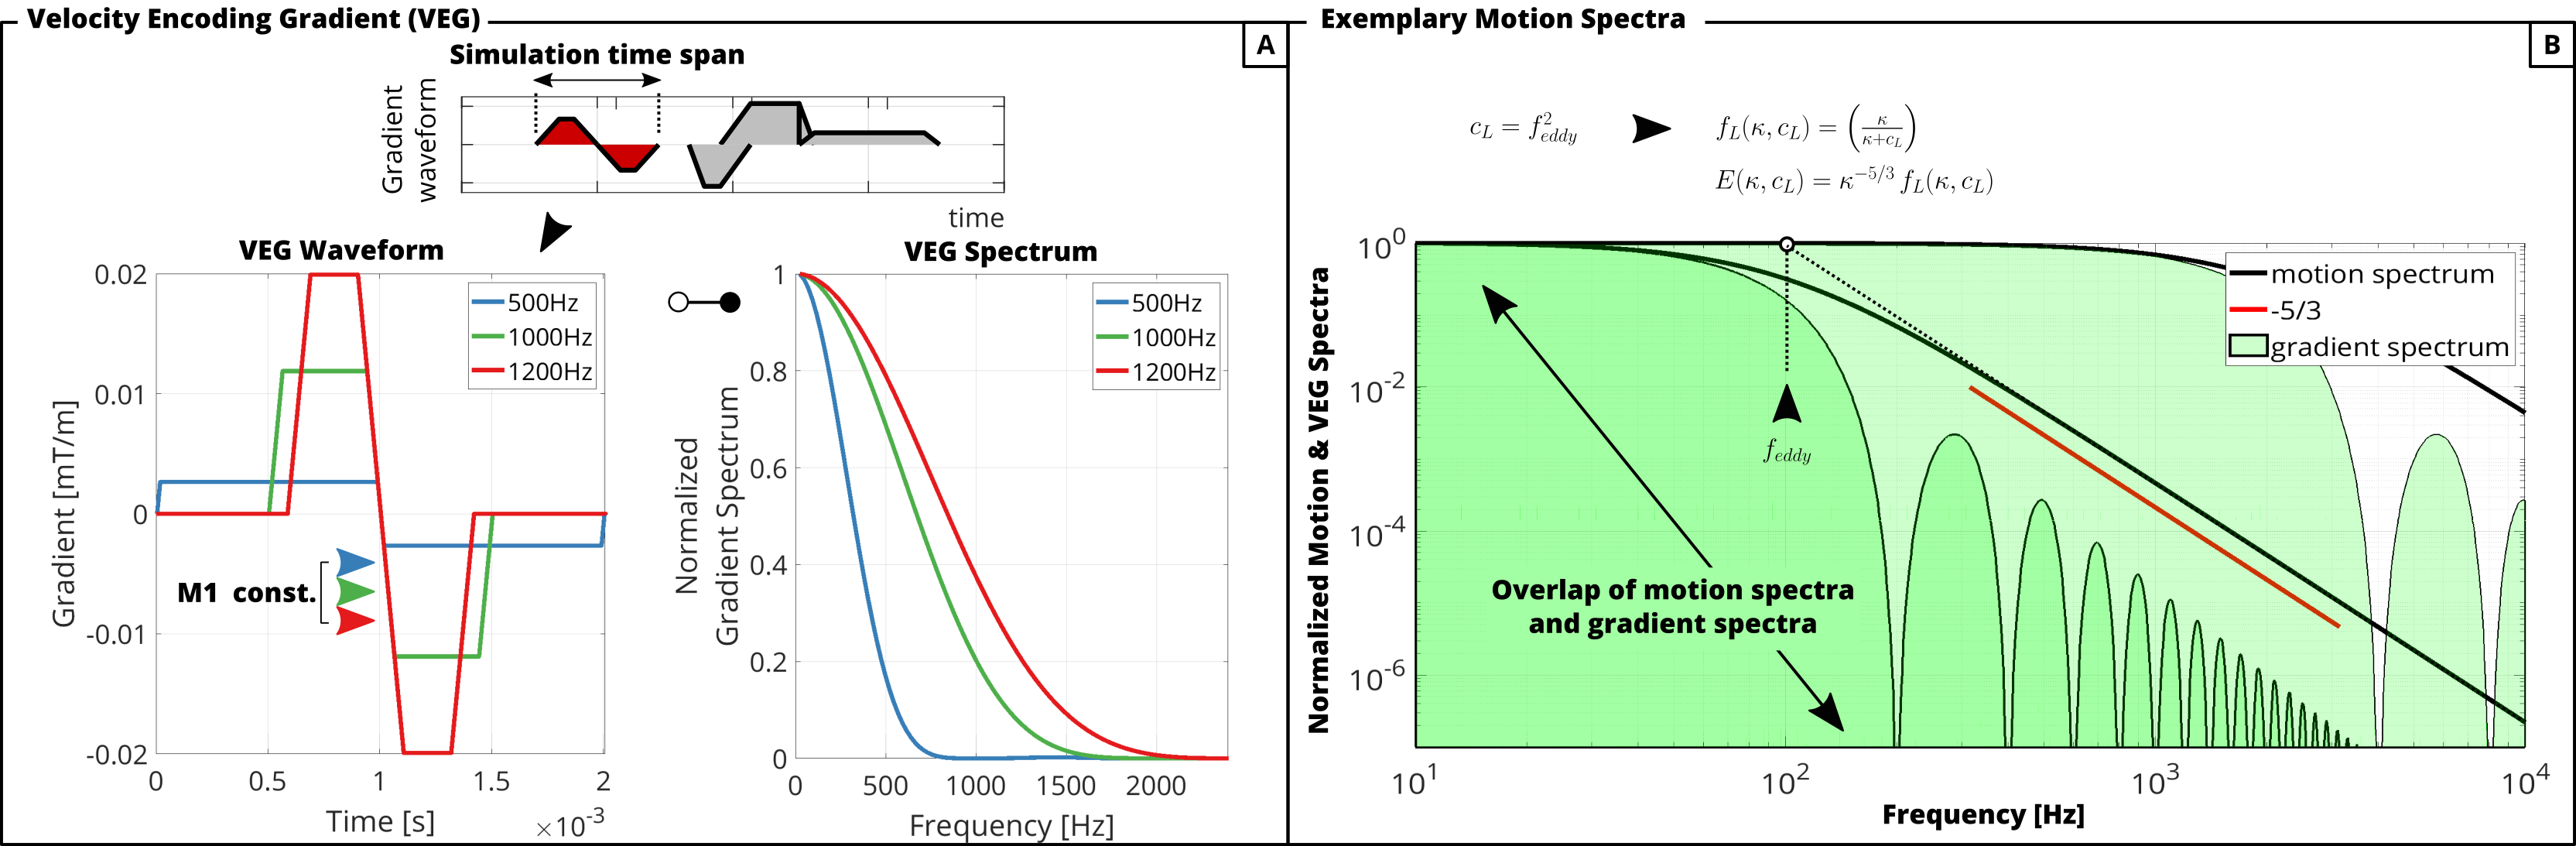
The gradient spectrum is defined as17
$$ S(\omega, t) = \frac{ \left | g(\omega, t) \right | ^2 }{\omega^2} \; , \quad\quad (4) $$
where$$$\;g(\omega, t)=\int_0^tG(t')\exp(\mathrm{j}\omega t')\,\mathrm{d}t'\;$$$denotes the Fourier transformed gradient time samples. Of note, gradients having the same first moment$$$\;M_1(t)=\int_0^tG(t’)t’\mathrm{d}t’\;$$$can exhibit different spectra (Figure 1A).
The encoding of the motion spectrum$$$\;D(\omega)\;$$$is given by17$$ \alpha(t) = \frac{1}{2\pi} \, \gamma^2 \int_{-\infty}^{\infty}D(\omega) S(\omega, t) \; \mathrm{d}\omega \; , \quad\quad (5) $$where the spectral overlap of$$$\;D(\omega)\;$$$and$$$\;S(\omega,t)\;$$$defines the encoding ability.$$$\;D(\omega)\;$$$varies spatially and temporally depending on particle position.
The VEG waveforms for 500Hz,1000Hz,1200Hz were calculated for venc=4.5m/s to comply with amplitude and slew rate limits of 30mT/m, 195T/m/s, respectively. The tracking time was limited to the duration of the longest VEG (assuming instantaneous image encoding after VEGs) to keep the simulation tractable on a workstation.
Results & Discussion
Gradient & Exemplary Motion SpectraFigure 1A shows the VEG waveforms and their spectra. For a constant first gradient moment (M1=const.$$$\;\Leftrightarrow\;$$$venc=const.) different spectral coverage between 0 and 2000Hz is seen. Figure 1B shows exemplary motion spectra arising in turbulent flow18 of$$$\;f_{eddy}=\{100,1000\}Hz\;$$$and VEG of 100Hz and 1000Hz on a logarithmic scale. Depending on the motion spectrum, the frequency coverage of low frequency VEGs is insufficient and underestimation of Reynolds stresses occurs.
Motion Spectra from Lagrangian Particle Tracking
Figures 2B,2C show the velocity autocorrelation function (VACF) of example particles (P1 to P5) and their spectra along x and z. Particles in regions of high$$$\;f_{eddy}\;$$$show fast decaying VACFs (Figure 2B, P2 vs. P3). Due to transport by mean flow, the dynamics of the particles (namely$$$\;f_{eddy}$$$) change during simulation time, resulting in a kink in the VACF (Figure 2B, P4; Figure 2C, P1,4,5). The Fourier transform of the VACF reveals that motion spectra contain energy in frequency regions above 1000Hz.
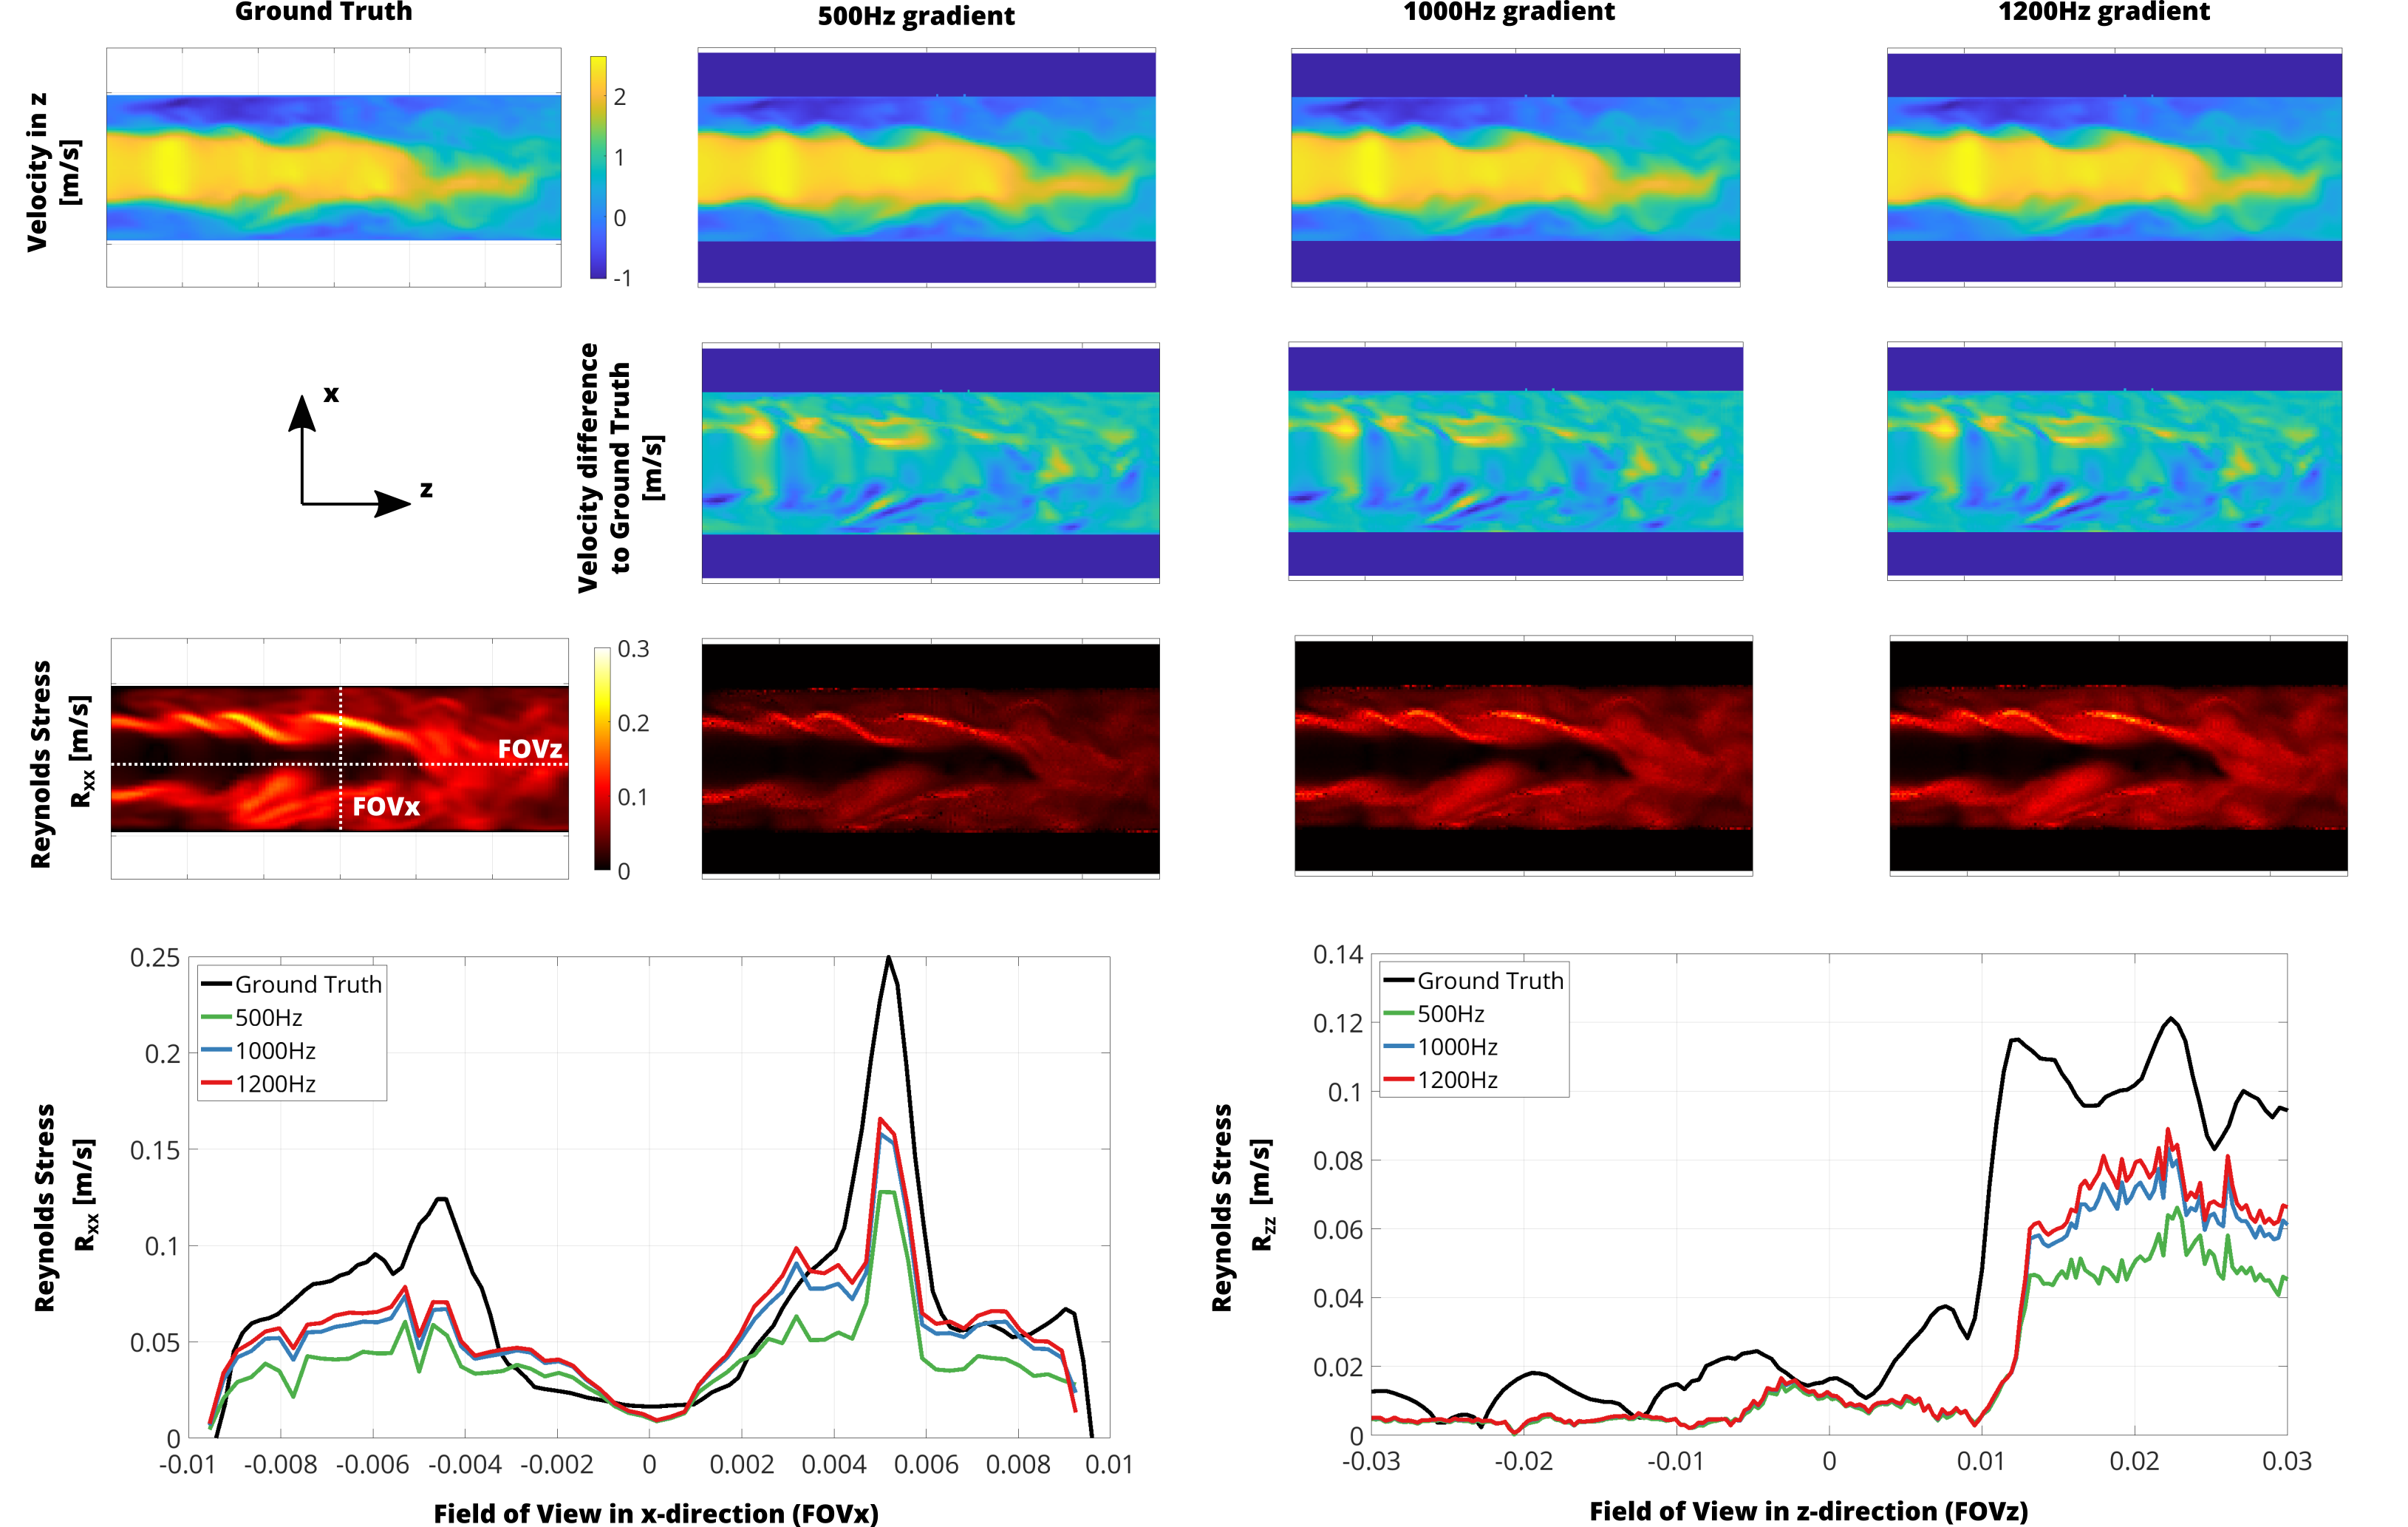
Estimated Reynolds Stress Tensors
Figure 3 compares estimated RSTs to ground truth data. While mean velocities are imaged correctly (besides displacement artefacts due to finite time velocity encoding16), underestimation of RST increases with decreasing VEG frequency.
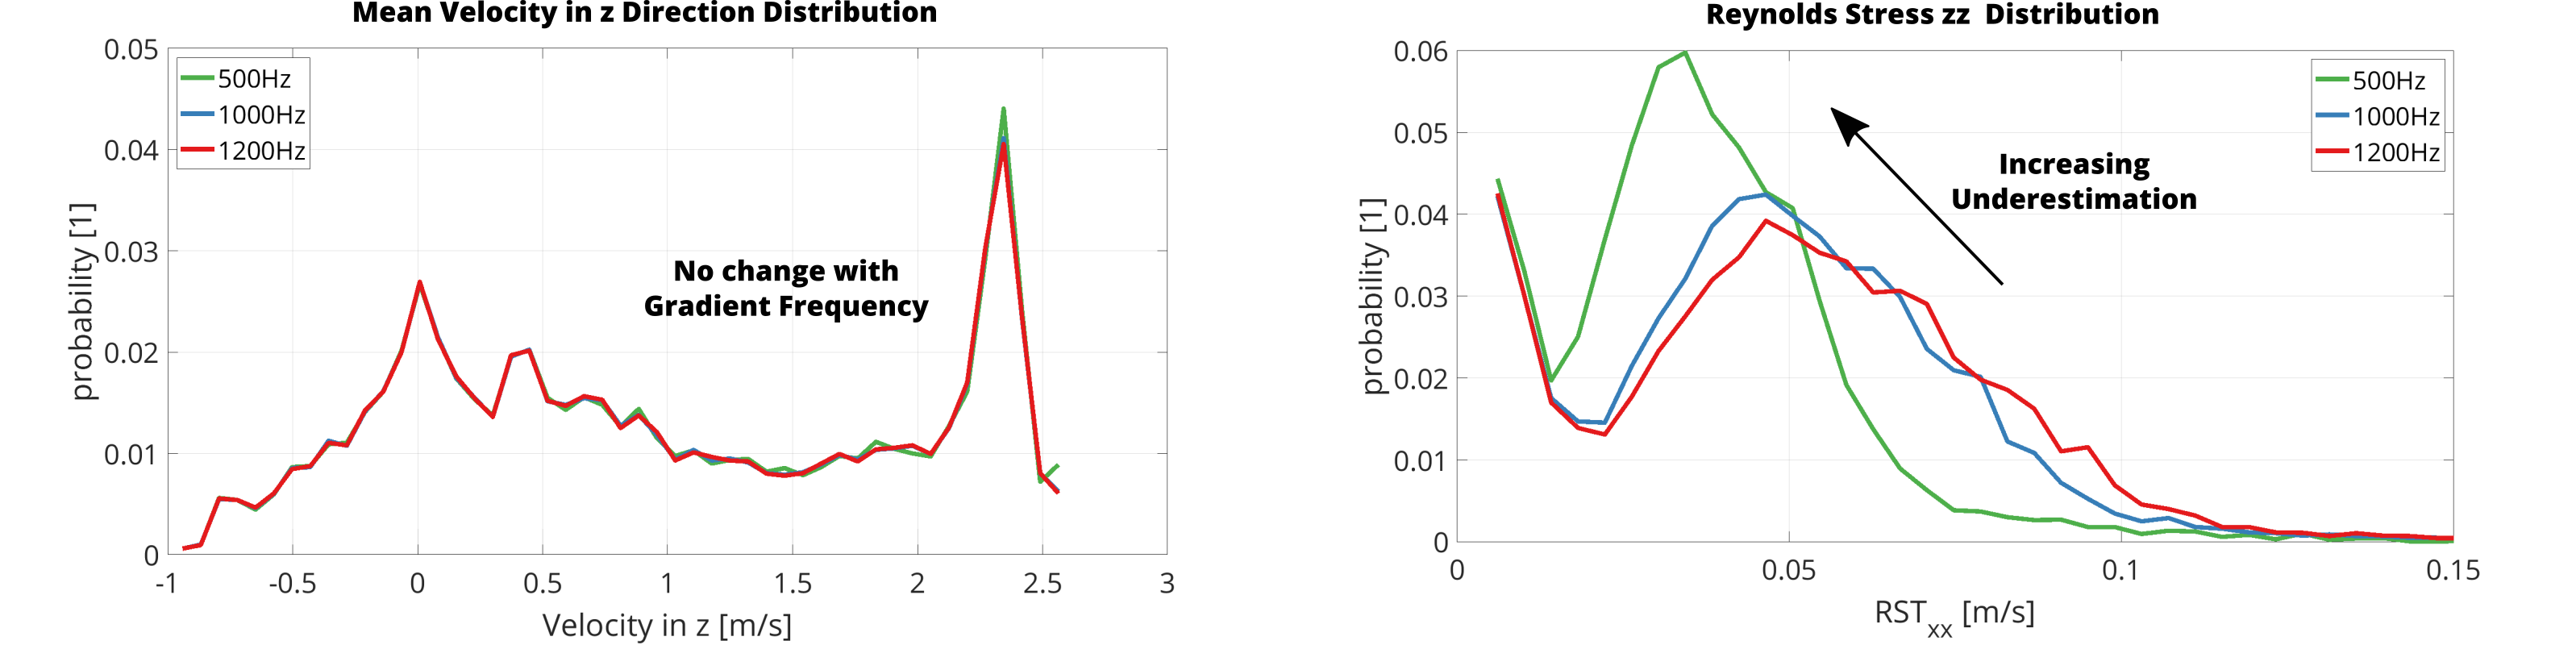
Probability Distribution of Velocities and Reynolds Stresses depending on VEG Frequency
Figure 4 shows histograms using 50 bins of mean velocity and RST along the z-direction. The mean velocity distribution is found to be independent of VEG frequency. RSTs, on the other hand, show a shift towards lower RST values as VEG frequency decreases.
Conclusion
In this work we have shown that velocity encoding gradients with identical first gradient moments but different durations result in different values of the RST. Increasing the duration of the gradients increases underestimation of the RST. As TKE values are derived from RST, this leads to systematic errors in turbulence quantification.Acknowledgements
The authors acknowledge funding of the Platform for Advanced Scientific Computing of the Council of Federal Institutes of Technology (ETH Board), Switzerland and are grateful for the donation of a Quadro GPU by NVIDIA’s academic program.References
1. Binter C, Knobloch V, Sigfridsson A, Kozerke S. Direct quantification of turbulent shear stresses by multi-point phase-contrast MRI. Proc. Intl. Soc. Mag. Reson. Med. 20 (2012) 2012;671.
2. Ha H, Kvitting J-PE, Dyverfeldt P, Ebbers T. 4D Flow MRI quantification of blood flow patterns, turbulence and pressure drop in normal and stenotic prosthetic heart valves. Magn. Reson. Imaging 2019;55:118–127 doi: 10.1016/j.mri.2018.09.024.
3. Binter C, Gotschy A, Sündermann SH, et al. Turbulent Kinetic Energy Assessed by Multipoint 4-Dimensional Flow Magnetic Resonance Imaging Provides Additional Information Relative to Echocardiography for the Determination of Aortic Stenosis Severity. Circ. Cardiovasc. Imaging 2017;10 doi: 10.1161/CIRCIMAGING.116.005486.
4. Haraldsson H, Kefayati S, Ahn S, et al. Assessment of Reynolds stress components and turbulent pressure loss using 4D flow MRI with extended motion encoding. Magn. Reson. Med. 2018;79:1962–1971 doi: 10.1002/mrm.26853.
5. Casas B, Lantz J, Dyverfeldt P, Ebbers T. 4D Flow MRI-based pressure loss estimation in stenotic flows: Evaluation using numerical simulations. Magn. Reson. Med. 2016;75:1808–1821 doi: 10.1002/mrm.25772.
6. Ha H, Kvitting J, Dyverfeldt P, Ebbers T. Validation of pressure drop assessment using 4D flow MRI-based turbulence production in various shapes of aortic stenoses. Magn. Reson. Med. 2019;81:893–906 doi: 10.1002/mrm.27437.
7. Ha H, Lantz J, Ziegler M, et al. Estimating the irreversible pressure drop across a stenosis by quantifying turbulence production using 4D Flow MRI. Sci. Rep. 2017;7:1–14 doi: 10.1038/srep46618.
8. Baumgartner H, Falk V, Bax JJ, et al. 2017 ESC/EACTS Guidelines for the management of valvular heart disease. Eur. Heart J. 2017;38:2739–2791 doi: 10.1093/eurheartj/ehx391.
9. Dyverfeldt P, Gårdhagen R, Sigfridsson A, Karlsson M, Ebbers T. On MRI turbulence quantification. Magn. Reson. Imaging 2009;27:913–922 doi: 10.1016/j.mri.2009.05.004.
10. Dyverfeldt P, Kvitting J-PE, Sigfridsson A, Engvall J, Bolger AF, Ebbers T. Assessment of fluctuating velocities in disturbed cardiovascular blood flow: In vivo feasibility of generalized phase-contrast MRI. J. Magn. Reson. Imaging 2008;28:655–663 doi: 10.1002/jmri.21475.
11. Liu JS, Lu PC, Chu SH. Turbulence Characteristics Downstream of Bileaflet Aortic Valve Prostheses. J. Biomech. Eng. 2000;122:118–124 doi: 10.1115/1.429643.
12. Stepišnik J. Measuring and imaging of flow by NMR. Prog. Nucl. Magn. Reson. Spectrosc. 1985;17:187–209 doi: 10.1016/0079-6565(85)80008-X.
13. Stepišnik J, Callaghan PT. The long time tail of molecular velocity correlation in a confined fluid: observation by modulated gradient spin-echo NMR. Phys. B Condens. Matter 2000;292:296–301 doi: 10.1016/S0921-4526(00)00469-5.
14. Stejskal EO. Use of Spin Echoes in a Pulsed Magnetic-Field Gradient to Study Anisotropic, Restricted Diffusion and Flow. J. Chem. Phys. 1965;43:3597–3603 doi: 10.1063/1.1696526.
15. Deshpande MD, Giddens DP. Turbulence measurements in a constricted tube. J. Fluid Mech. 1980;97:65 doi: 10.1017/S0022112080002431.
16. Dillinger H, Walheim J, Kozerke S. On the limitations of echo planar 4D flow MRI. Magn. Reson. Med. 2020;84:1806–1816 doi: 10.1002/mrm.28236.
17. Callaghan PT. Translational Dynamics and Magnetic Resonance: Principles of Pulsed Gradient Spin Echo NMR. OUP Oxford; 2011.
18. Pope SB. Turbulent Flows. Cambridge: Cambridge University Press; 2000. doi: 10.1017/CBO9780511840531.
Figures