2082
Lesion Patterns and Blood Flow Lateralization in Atherosclerotic Middle Cerebral Artery Disease
Wenwen Chen1, Xiaowei Song2, Shuo Chen1, Mingzhu Fu1, Hanyu Wei1, Duoduo Hou2, Le Chen2, Miaoqi Zhang1, Jian Wu2, and Rui Li1
1Center for Biomedical Imaging Research, Department of Biomedical Engineering, School of Medicine, Tsinghua University, Beijing, China, 2Beijing Tsinghua Changgung Hospital, Beijing, China
1Center for Biomedical Imaging Research, Department of Biomedical Engineering, School of Medicine, Tsinghua University, Beijing, China, 2Beijing Tsinghua Changgung Hospital, Beijing, China
Synopsis
Intracranial atherosclerosis disease (ICAD) can induce blood flow lateralization (BFL). However, the relationship of infarct patterns (IPs) with BFL was rarely explored. This study investigated the relationship between BFL and IPs in middle cerebral artery (MCA) using 4D flow MRI. Twenty-eight patients with unilateral MCA infarction were included. Average net flow (Flowavg) of infarction side and the contralateral side of MCA-M1 were compared in various IPs. Flowavg is significantly different between two sides of MCA in cortical infarct, but not significant in subcortical lesions. This suggests that cortical infarct may be the specific pattern for BFL in MCA.
Introduction
Intracranial atherosclerotic disease (ICAD) has been considered a major cause of ischemic stroke worldwide1. And ICAD occurred in middle cerebral artery is considerable, which may result in fatal outcomes. Risk assessment parameters of ischemic stroke for clinical use is mainly stenosis degree. Increasing evidence suggests that using lumen stenosis degree is not enough to stratify stroke risk, and new factors such as hemodynamics2-3, and plaque characteristics4 are also considered. So it is important to verify the interaction mechanism of these factors with infarctions. Previous studies have investigated many factors which may correlate with infarct patterns5-10, however, the relationship between infarct patterns and hemodynamics is not fully understood. Furthermore, 4D flow MRI (3D time-resolved 3-directional velocity encoding) offers assessment of quantitative value of absolute blood flow rates in MCA11. The goal of this study was to explore whether there remain hemodynamic differences between various MCA infarct patterns in MCA-M1 segment. In this study, hemodynamics specifically refers to the blood flow lateralization, which compares the bilateral average net flow (Flowavg) of MCA.Methods
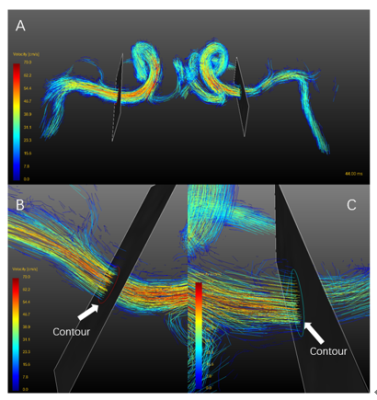
A total of 28 patients with unilateral symptomatic MCA infarction were included in the retrospective study, and those with severe internal carotid artery (ICA) and anterior cerebral artery (ACA) stenosis were excluded.Patients were scanned with a 3.0T magnetic resonance scanner (GE discovery750, GE Medical Systems). For clinical evaluation of stroke patients, routine brain MRI including T1-, T2-weighted, Flair, DWI and ADC was initially acquired. All participants underwent 4D-flow MRI. Velocity encoding of 4D-flow MRI was set to 150 cm/s in all directions. Spatial resolution=1 x 1 x 1 mm3, temporal resolution=30-57 ms. All preprocessing, visualization, and quantification of 4D-flow data were performed using GTFlow (GyroTools, Zurich, Switzerland). For quantification of blood flow, cut-planes of both sides were created symmetrically perpendicular to the MCA-M1 section and velocities of flowing blood that passes through manually drawn contours were measured12, as shown in Figure 1. Average blood flow rate (Flowavg, mL/s) defined by the mean flow value passing through contours in one cardiac cycle, was automatically measured in GTFlow.
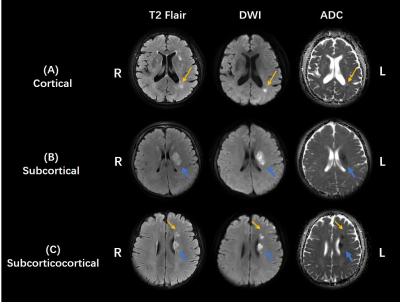
Infarct patterns in the territory of the MCA were classified as three types after comprehensive observation of T2 Flair, DWI, and ADC image series, based on published criteria 13-15. (1) cortical infarcts, including pial artery infarcts and border-zone infarcts in the anterior or posterior cortical border zone or internal border zone, (2) subcortical infarct: perforating vessel infarcts of M1 segment, (3) subcorticocortical lesion comprised both subcortical and cortical infarcts. Examples of these different infarct patterns are provided in Figure 2.
Intra-observer reproducibility was assessed for Flowavg measurements using the Bland–Altman test. The Flowavg in each subgroup were illustrated by using box-and-whisker plots. Paired samples t-test is used to compare Flowavg on both sides of MCA to explore blood flow lateralization in different infarct patterns. Statistical analysis was conducted by MedCalc, version 15.2.2 (MedCalc Software, Mariakerke, Belgium). The level of statistical significance was set at P < 0.05.
Results
For statistical results, the intra-observer reproducibility for Flowavg measurements is good, as depicted in Figure 3.For cortical infarct pattern, Flowavg of the infarct side in MCA is significant lower than that of the contralateral side (P=0.0067, n=12), as shown in Figure 4 (A). However, Flowavg of both sides in MCA is not significantly different in subcortical (P=0.1449, n=13) and subcorticocortical (P=0.1196, n=3) infarct patterns, as shown in Figure 4 (B-C).
Conclusion and Discussion
In summary, this 4D flow MRI study shows that the state of MCA blood flow lateralization is different among three infarct patterns (cortical, subcortical and subcorticocortical infarcts), and the lateralization is significant only in cortical infarct pattern. Significant association between the infarct patterns and blood flow lateralization was found.In this research, significant blood flow lateralization is likely to occur with cortical lesion. In our study, cortical lesion includes pial and border zone infarct patterns. The mechanism of those infarcts may be the artery-to-artery embolism caused by large artery atherosclerosis. And large artery atherosclerosis is likely to induce blood flow lateralization, especially in severe stenosis. Previous researches found that pial infarcts was identified more often in patients with severe stenosis or occlusion of MCA15-16. Their explanation is that severe stenosis is more likely to cause distal embolism and severe hemodynamic compromise likely reduces the washout of distal emboli, which is consistent with the conclusion of this study.
No significant blood flow lateralization is found in subcortical infarct pattern in our research. Stroke mechanism for subcortical infarct may be small artery occlusion etc. Small artery occlusion may have little influence on blood flow lateralization of large arteries. And as previous reported, subcortical lesions were more common in patients with milder stenosis than with severe stenosis or occlusion of MCA15-16.
There remain limitations of our study. Firstly, the sample size is small in subcorticocortical group, which limited the deeper exploration on this infarct pattern. As reported, subcorticocortical infarct was identified more often in patients with severe stenosis or occlusion of MCA15. If the sample size is enough, significant blood flow lateralization may also occur. Future work will focus on investigating the impact of more various infarct patterns on hemodynamic changes in a much larger cohort.
Acknowledgements
No acknowledgement found.References
- Arenillas JF. Intracranial atherosclerosis: current concepts. Stroke 2011;42(1 Suppl):S20-23.
- Liebeskind DS, Cotsonis GA, Saver JL, Lynn MJ, Turan TN, Cloft HJ, et al; Warfarin-Aspirin Symptomatic Intracranial Disease (WASID) Investigators. Collaterals dramatically alter stroke risk in intracranial atherosclerosis. Ann Neurol. 2011;69:963–974.
- Liebeskind DS, Kosinski AS, Lynn MJ, Scalzo F, Fong AK, Fariborz P, et al. Noninvasive fractional flow on MRA predicts stroke risk of intracranial stenosis in SONIA/WASID. Stroke. 2013; 44:ATP166.
- Ryoo S, Lee MJ, Cha J, Jeon P, Bang OY. Differential vascular pathophysiologic types of intracranial atherosclerotic stroke: a high-resolution wall magnetic resonance imaging study. Stroke. 2015;46: 2815–2821. doi: 10.1161/STROKEAHA.115.010894
- Wabnitz AM, Derdeyn CP, Fiorella DJ, Lynn MJ, Cotsonis GA,Liebeskind DS, et al. Hemodynamic Markers in the Anterior Circulation as Predictors of Recurrent Stroke in Patients With Intracranial Stenosis. Stroke. 2019;50:00-00.
- Lopez-Cancio E, Matheus MG, Romano JG, Liebeskind DS, Prabhakaran S, Turan TN, et al. Infarct patterns, collaterals and likely causative mechanisms of stroke in symptomatic intracranial atherosclerosis. Cerebrovasc Dis 2014;37:417–422.
- Jung JM, Kang DW, Yu KH, Koo JS, Lee JH, Park JM, et al. Predictors of recurrent stroke in patients with symptomatic intracranial arterial stenosis. Stroke. 2012;43:2785-2787.
- Kang DW, Chalela JA, Ezzeddine MA, Warach S. Association of ischemic lesion patterns on early diffusion-weighted imaging with TOAST stroke subtypes. Arch Neurol. 2003;60:1730-1734.
- Lee DK, Kim JS, Kwon SU, Yoo SH, Kang DW. Lesion patterns and stroke mechanism in atherosclerotic middle cerebral artery disease: early diffusion-weighted imaging study. Stroke. 2005;36:2583-2588.
- Wu F, Song H, Ma Q, Xiao J, Jiang T, Huang X, et al. Hyperintense Plaque on Intracranial Vessel Wall Magnetic Resonance Imaging as a Predictor of Artery-to-Artery Embolic Infarction. Stroke. 2018;49:905-911
- Markl M, Frydrychowicz A, Kozerke S, Hope M, Wieben O. 4D flow MRI. J Magn Reson Imaging 2012;36(5):1015-1036.
- Li Y, Chen H, He L, et al. Hemodynamic assessments of venous pulsatile tinnitus using 4D-flow MRI. Neurology 2018;91(6):e586-e593.
- Tatu L, Moulin T, Bogousslavsky J, Duvernoy H. Arterial territories of the human brain: cerebral hemispheres. Neurology. 1998;50: 1699–1708.
- Chen H, Hong H, Liu D, Xu G, Wang Y, Zeng J, et al. Lesion patterns and mechanism of cerebral infarction caused by severe atherosclerotic intracranial internal carotid artery stenosis. J Neurol Sci. 2011; 307:79–85.
- Jung, J. M., et
al. Predictors of recurrent stroke in patients with symptomatic intracranial
arterial stenosis. Stroke. 2012; 43(10): 2785-2787.
- Lee, D. K., et al. Lesion patterns and stroke mechanism in atherosclerotic middle cerebral artery disease: early diffusion-weighted imaging study. Stroke. 2005; 36(12): 2583-2588.
Figures

Figure 1: 4D-flow
data analysis using dedicated software. Flow pattern visualization was
performed by streamlines (A) and hemodynamic measurements within contours (B, C)
were used for quantification of blood flow.

Figure 2: Different infarct patterns of patients with
ICAD in MCA. (A) Cortical infarct pattern. Patients with left border zone
infarct (yellow arrow). (B) Subcortical infarct pattern. Patients with left
perforating artery infarct (blue arrow). (C) Subcorticocortical infarct
pattern. Patients with left perforating artery infarct (blue arrow) and left
border zone infarct (yellow arrow).

Figure 3:
Bland-Altman plots
presenting the agreement of the two measurements of Flowavg,
indicating good intra-observer reproducibility.

Figure
4 - (A) : Box-and-whisker plots of Flowavg on bilateral sides in cortical infarct pattern (n=12). There
is significant
difference
between
Flowavg
of the infarction
side
and Flowavg of the contralateral side.

Figure
4 -
(B-C): Box-and-whisker
plots of Flowavg
on bilateral sides in two
infarct patterns. (B) Left is
the
box-and-whisker plot of the subcortical infarct (n=13).
(C). Right is the subcorticocortical infarct
(n=3).