2080
Reverse Flow and Reverse Flow Volume is Associated with Aortic Dilatation in Bicuspid Aortic Valve Disease1Radiology, Northwestern University, Chicago, IL, United States, 2Cardiothoracic Surgery, Northwestern University, Chicago, IL, United States, 3Cardiology, Northwestern University, Chicago, IL, United States, 4Radiology, Lurie Children's Hospital, Chicago, IL, United States
Synopsis
Bicuspid Aortic Valve (BAV) patients often develop aortic dilation which can lead to life-threatening complications. Voxel-wise reverse flow was calculated to assess deranged flow in BAV patients with dilation and in healthy volunteers. In BAV patients, the mean reverse flow was significantly increased in the ascending aorta and aortic arch. The reverse flow volume (volume with reverse flow>0.03mL/cycle) was also increased. Linear regression demonstrated that these reverse flow metrics were significant contributors to mid-ascending aorta diameter even when age was accounted for. We demonstrated that reverse flow is a significant component of deranged flow in BAV disease.
Introduction
Bicuspid aortic valve (BAV) disease is the most common congenital heart defect and can lead to life-threatening aortic complications (BAV aortopathy) such as dilatation, aneurysms, or aortic dissections. Currently, aortic diameter and annual growth rates are used to monitor risk, but the cause of the dilation is unclear. Prior 4D flow MRI studies have shown changes in aortic flow, such as increased vorticity and wall shear stress, are associated with BAV aortopathy. However, these metrics require either manual observer grading or noisy, complex calculations.1,2,3 We propose that 4D flow MRI derived volumetric aortic reverse flow may serve as a simpler and more robust measure of deranged flow in BAV patients with aortic root dilation. Our goal was to test the hypotheses that 1) reverse flow is elevated in BAV patients with aortic dilatation compared to healthy volunteers and 2) reverse flow is associated with the degree of aortic dilatation in BAV patients.Methods
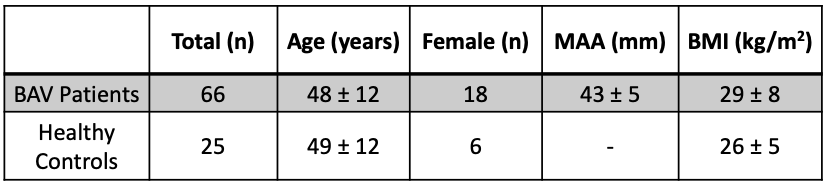
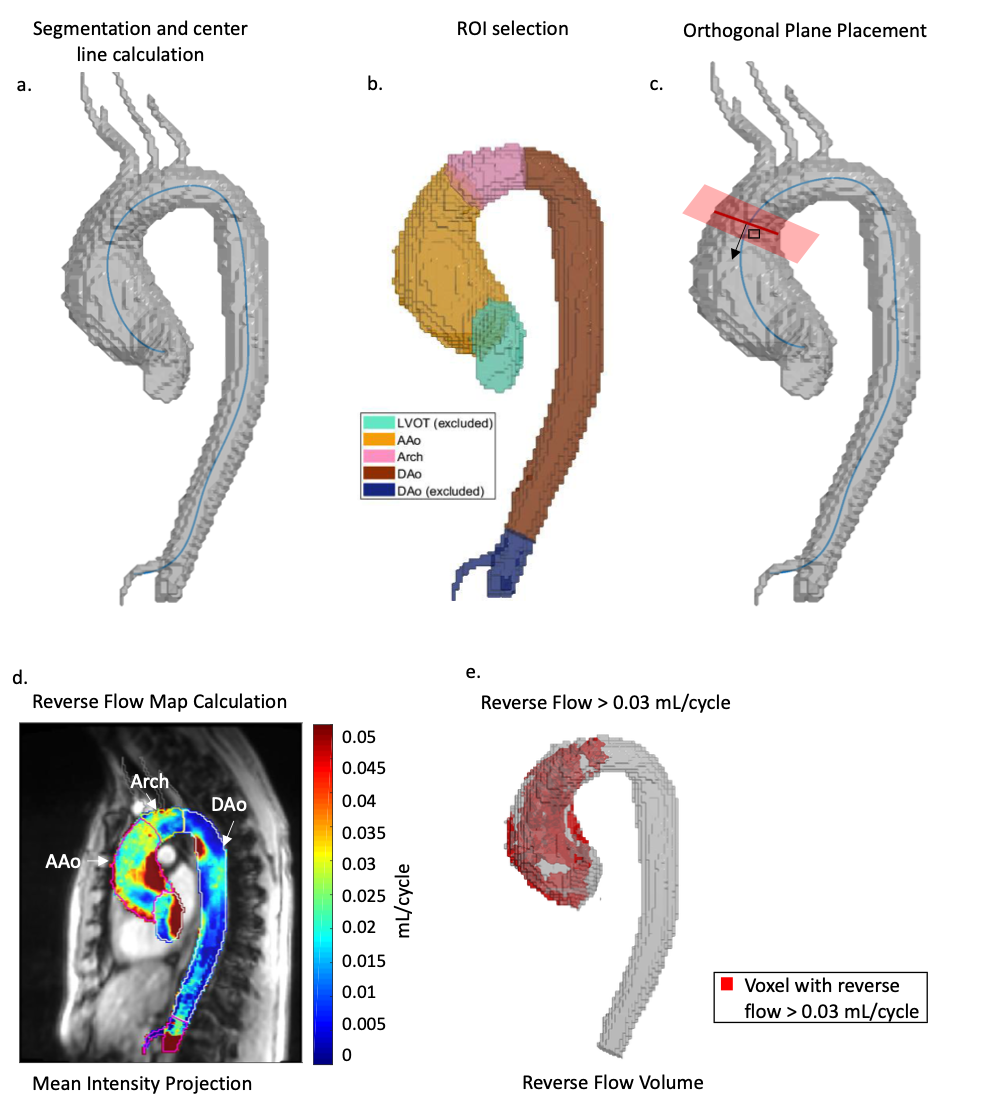
This retrospective study included 66 BAV patients (48±12 years) (mean ascending aorta (MAA) diameter > 35mm and without aortic regurgitation or aortic stenosis) and 25 healthy volunteers (49±12 years) (Table 1). 4D flow MRI of the aorta was acquired in all subjects (2.125x2.125x2.5mm spatial resolution, 38.4ms temporal resolution, venc=150cm/s) and preprocessed according to an established workflow. A phase contrast MR angiogram was calculated to segment the aortic volume and a centerline was automatically calculated (Figure 1a). Anatomic landmarks were used to define three 3D ROIs: ascending aorta (AAo), aortic arch, descending aorta (DAo) (Figure 1b). The left ventricular outflow tract (LVOT) and DAo beyond the celiac artery were excluded. Orthogonal 2D analysis planes were automatically placed every 4mm along the centerline to determine the vector describing the direction of reverse flow (vdir). The time-resolved reverse flow was calculated for each voxel based on its projection onto the nearest vdir (Figure 1c). 3D reverse flow maps were calculated by summing over the cardiac cycle on a voxel-wise basis.4,5 The mean reverse flow was calculated for each ROI and a 2D mean intensity map was plotted (Figure 1d). Reverse flow volume was determined by the number of voxels with reverse flow greater than 0.03mL/cycle. To reduce impact of noisy voxels, connected component analysis was used to keep only the two largest volumes (Figure 1e). The threshold was determined by the distribution of overall mean reverse flow for each BAV patient where 0.03mL/cycle was the mean plus one standard deviation of that distribution. The fraction of the AAo containing reverse flow volume was also calculated. Linear regression using maximum likelihood estimation was performed to study relationships between BAV reverse flow quantifications and MAA diameter (Figure 4).Results
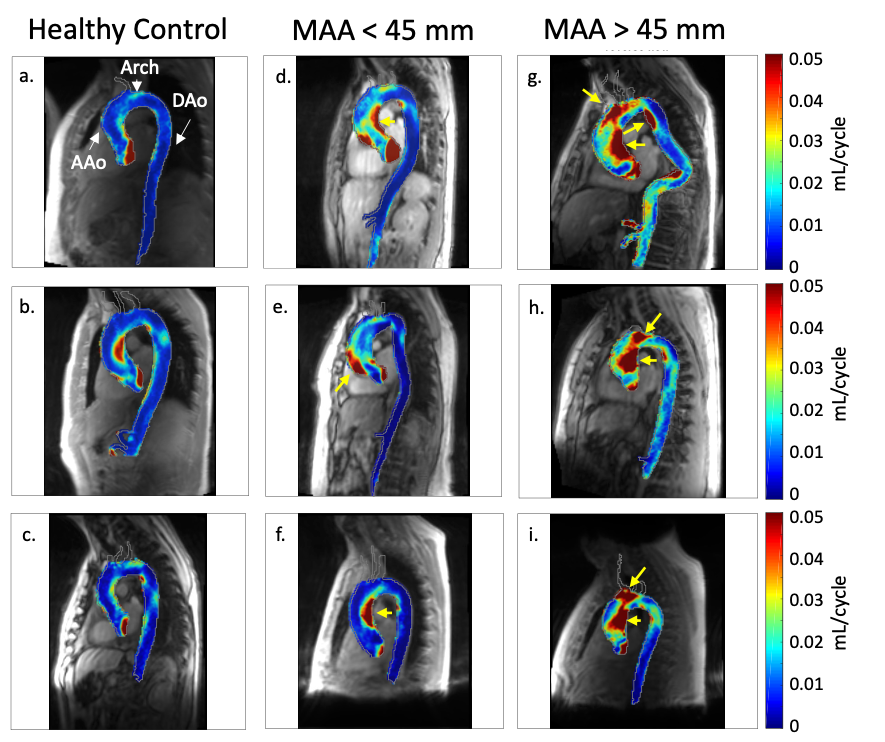
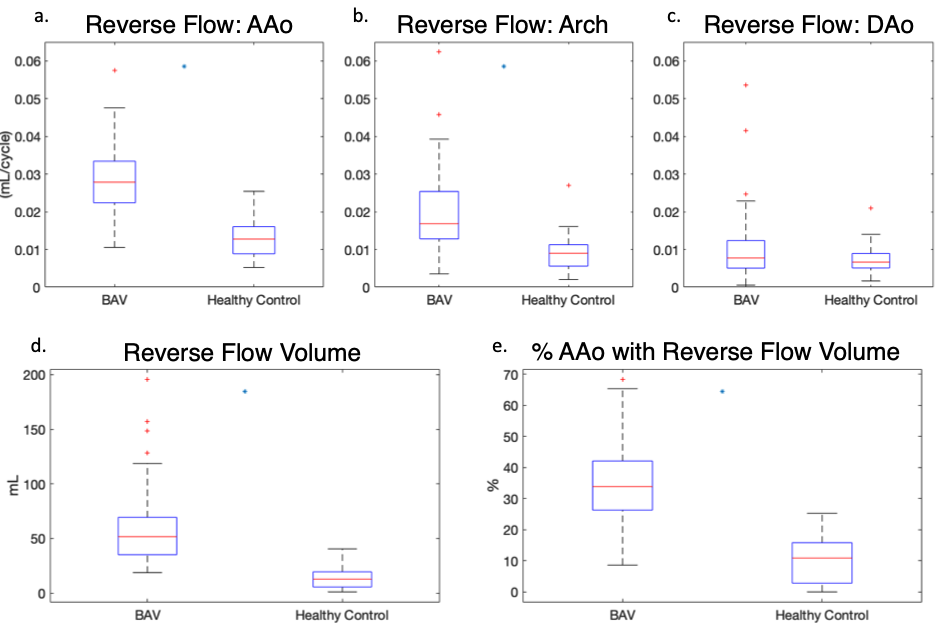
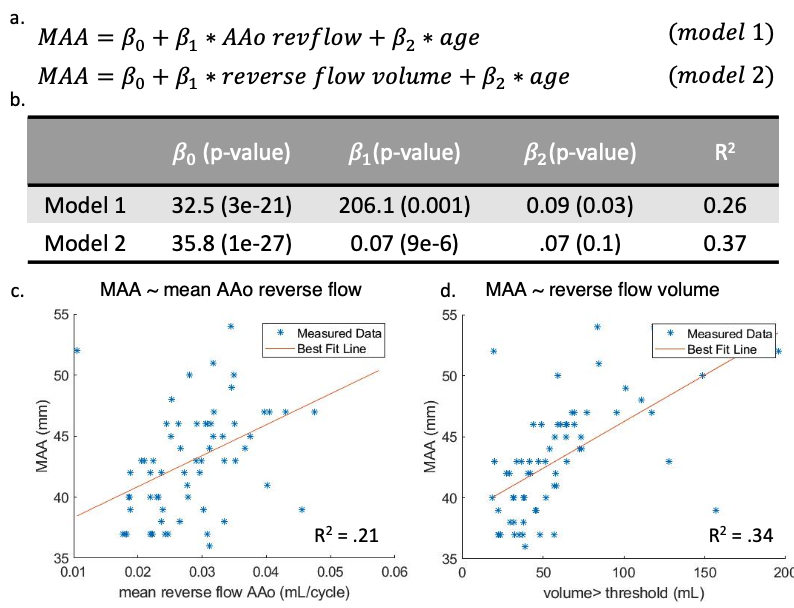
There was no significant difference in age ($$$p=0.72$$$) or BMI ($$$p=0.08$$$) between BAV patients and controls. Results in nine example subjects are shown in figure 2 to visualize the progressive increase in reverse flow volume and magnitude from healthy controls to BAV patients with MAA<45mm and MAA>45mm. Results for the entire cohort are shown (Figure 3). In BAV patients, a significant increase in the mean voxel-wise reverse flow was found in the AAo (0.03 vs 0.01 mL/cycle, $$$p=1e-11$$$) and arch (0.02 vs 0.01 mL/cycle, $$$p=2e-7$$$). Additionally, an increase in reverse flow volume (58.9 vs 14.1 mL, $$$p=2e-11$$$) and fraction of AAo with reverse flow volume (0.35 vs 0.10, $$$p=6e-12$$$) was found in BAV patients (Figure 3). A linear regression using model 1 (Figure 4a) found that mean reverse flow ($$$p=0.001$$$) and age ($$$p=0.03$$$) were independent predictors of MAA diameter. An analogous regression was performed using reverse flow volume (model 2) and found that only reverse flow volume ($$$p=9e-6$$$) was significant. Characteristics for each model are found in Figure 4b. Single variate linear regression was performed to compare the predictive value of mean reverse flow in the AAo (R2$$$=0.21$$$, preverseflow$$$=9e-5$$$) and reverse flow volume (R2$$$=0.34$$$, pvolume$$$=2e-7$$$) which suggested reverse flow volume was a better predictor of MAA diameter (Figure 4c-d).Discussion
Reverse flow is a simple volumetric measure that can be used to characterize deranged flow in BAV patients with aortic dilation. This voxel-wise analysis enabled a measure of both the magnitude of deranged flow and the volume affected – both of which were elevated in BAV patients. Notably, it was seen that the fraction of AAo containing reverse flow volume was also increased in BAV patients. This demonstrates that the increase in reverse flow volume exceeds the proportionate change from the larger aorta. Multivariate linear regression demonstrated that, even when age is accounted for, the reverse flow measures correlate with MAA diameter suggesting the deranged flow may be an important hemodynamic factor implicated in the risk for aortic dilation in BAV disease.Conclusions
A simple workflow enables semi-automated, voxel-wise quantification of reverse flow magnitude and volume in the entire aorta. Though further studies are required to assess the metrics’ robustness, this analysis suggests that mean reverse flow and reverse flow volume may be significant contributors to aortic dilation in BAV patients. Future studies will aim to investigate reverse flow in BAV patients with valve disease, in patients with aortic dilation but without BAV, and longitudinally to assess if reverse flow metrics can predict MAA growth rate.Acknowledgements
We would like to acknowledge our funding source, National Institutes of Health Grant R01HL115828.References
[1] Evaluation of 3D blood flow patterns and wall shear stress in the normal and dilated thoracic aorta using flow-sensitive 4D CMR
[2] von Spiczak, J., Crelier, G., Giese, D., Kozerke, S., Maintz, D., & Bunck, A. C. (2015). Quantitative analysis of vortical blood flow in the thoracic aorta using 4D phase contrast MRI. PLoS One, 10(9), e0139025.
[3] Barker, A. J., Markl, M., Bürk, J., Lorenz, R., Bock, J., Bauer, S., ... & von Knobelsdorff-Brenkenhoff, F. (2012). Bicuspid aortic valve is associated with altered wall shear stress in the ascending aorta. Circulation: Cardiovascular Imaging, 5(4), 457-466.
[4] Shen, X., Schnell, S., Barker, A. J., Suwa, K., Tashakkor, L., Jarvis, K., ... & Markl, M. (2018). Voxel‐by‐voxel 4D flow MRI‐based assessment of regional reverse flow in the aorta. Journal of Magnetic Resonance Imaging, 47(5), 1276-1286.
[5] Jarvis, K., Pruijssen, J. T., Son, A. Y., Allen, B. D., Soulat, G., Vali, A., Barker, A. J., Hoel, A. W., Eskandari, M. K., Malaisrie, S. C., Carr, J. C., Collins, J. D., & Markl, M. 2020. Parametric Hemodynamic 4D Flow MRI Maps for the Characterization of Chronic Thoracic Descending Aortic Dissection. J Magn Reson Imaging, 51(5): 1357-1368.
Figures