2076
First Experiences Utilizing Whole-Chest 4D-Flow for Everyday Clinical Use: A Step from Bench to Bedside1Department of Radiology, Northwestern University, Chicago, IL, United States, 2University Hospital Basel, University of Basel, Basel, Switzerland, 3Department Biomedical Engineering, Northwestern University, Chicago, IL, United States
Synopsis
We present initial results of our novel full chest, free-breathing 4D-flow protocol which was designed for clinical use. In 25 patient who required imaging of aortic and pulmonic flow, it proved to be feasible for two reasons: mean acquisition times of 4D-flow was 12.5min versus 9.7min for 2D phase contrast (2D-PC) imaging, resulting in only a minor mean measurement time increase of about three minutes. Second, flow measurements for aortic and pulmonic flow for were consistent for both 4D-flow and 2D-PC. We will continue with our evaluation in a larger cohort to confirm these initial results.
Introduction
4D-flow MRI is an advanced technique for in-vivo analysis of cardiovascular 3D blood flow dynamics [1]. Data analysis can be performed retrospectively after the exam, which is one of its main advantages over 2D phase contrast (2D-PC) imaging [2]. 4D-flow is performed with free-breathing which is easier on most cardiovascular patients who often experience dyspnea and fatigue as a result of breath-holding during cardiovascular (CV) MRI (CMR) [3]. Despite these advantages, clinical adoption of 4D-flow remains limited, in part by the perception of longer acquisitions and uncertainty around data fidelity. While 2D-PC acquisition is shorter, these images need precise planning and manual placement of imaging planes prior to image acquisition. In patients with congenital heart or valvular disease, planning and executing a comprehensive 2D-PC exam can be challenging and time consuming. We have recently generated a user-friendly 4D-flow protocol for clinical routine that includes full chest coverage without respiratory navigator. The aim of this study was to systematically analyze its time efficiency and flow quantification performance relative to the clinical standard 2D-PC in clinical patients.Methods
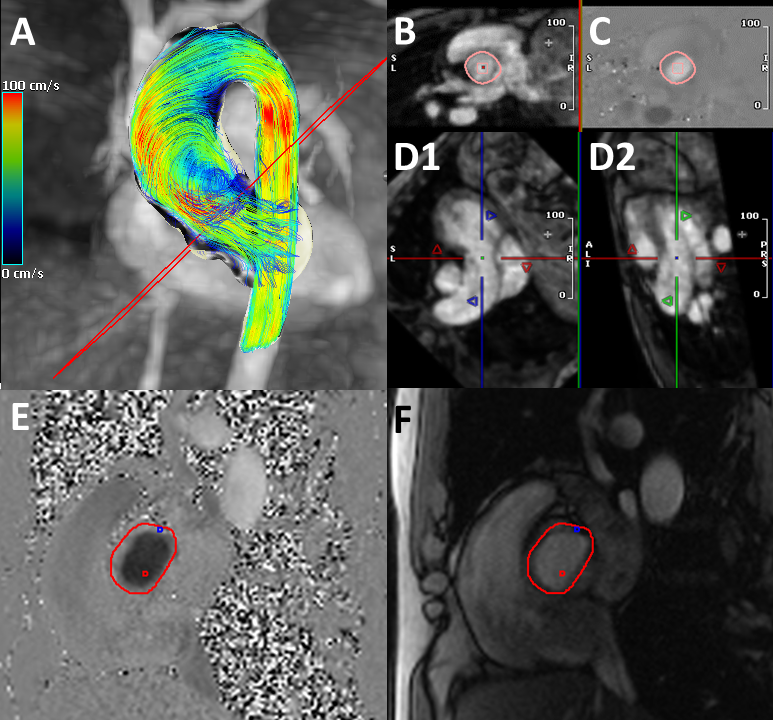
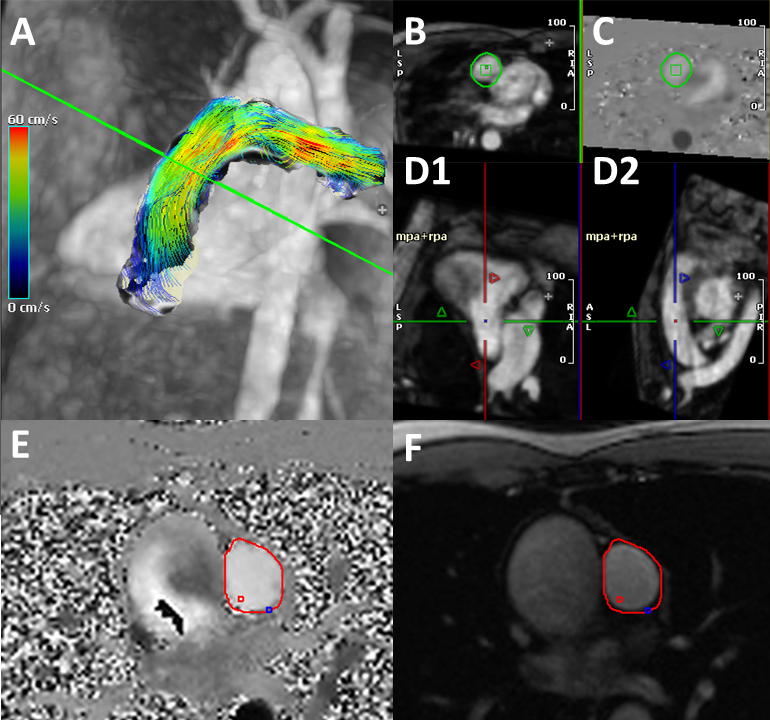
For this retrospective analysis, we included consecutive patients who underwent standard-of-care CMR including 4D-flow and 2D-PC imaging of the aortic valve (AV) and pulmonic valve (PV) in November 2020. All scans were performed on 1.5T MRI systems (Avanto or Sola, Siemens Healthineers, Germany). Time for series was evaluated using the DICOM header information. In 4D-flow, first time point of image acquisition and last time point of image reconstruction were compared. In 2D-PC, the last time point of the previous sequence was compared with the last time point of the 2D-PC image reconstruction; thereby planning time would be partly accounted for. Our clinical 4D-flow protocol was acquired in coronal orientation with full 3D coverage of the entire heart, thoracic aorta, and pulmonary arteries and great vessels during free-breathing. 4D-flow|2D-PC parameters: spatial resolution: 2.6x2.6x3.1mm|2.2x2.2x6mm, temporal resolution: 40ms|33ms, velocity sensitivity (Venc): 150 or 300cm/s|150cm/s (adjusted by MR technician if aliasing occurred), FOV: 460x376x176mm|420x288x192mm, TE: 2.2ms|2.5, TR: 5ms|46ms, flip angle: 15°|20°. Net flow measurements (total forward flow minus backward flow) were performed by a fellowship-trained CV radiologist with 2 years of experience using commercially available software (Circle Cardiovascular Imaging, version 5.11.2, Canada). In normal physiology (i.e. no shunt), these values should be equivalent which was used to assess internal consistency of the 2D-PC and 4D-flow measurements. 4D-flow analysis workflow included preprocessing (Eddy Current Correction (first order), velocity anti-aliasing, and noise masking) [4]. Planes for the measurement of AV and PV-flow were manually defined on multiplanar reformation (MPR) and vessel lumen contours were traced semi-automatically (Figure 1A-D2, Figure 2A1-D2). For 2D-PC flow quantification, AV and PV vessel lumen boundaries were delineated semi-automatically (Figure 1E-F, Figure 2E-F). We used Wilcoxon signed-rank test and Bland Altman Plots to compare our data in Python (Python Software Foundation).Results
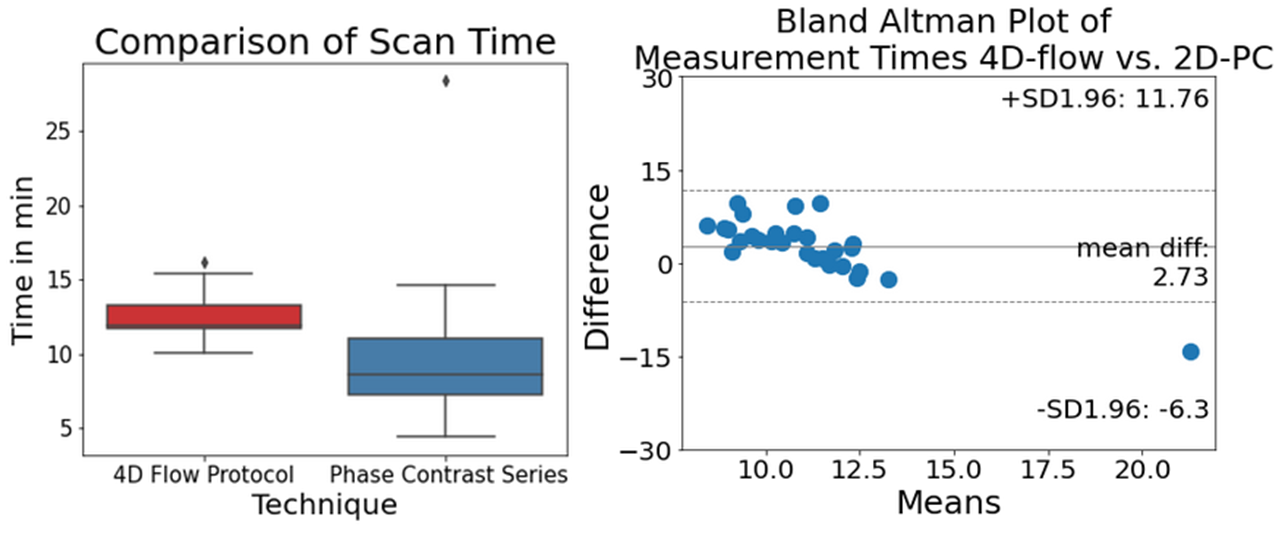
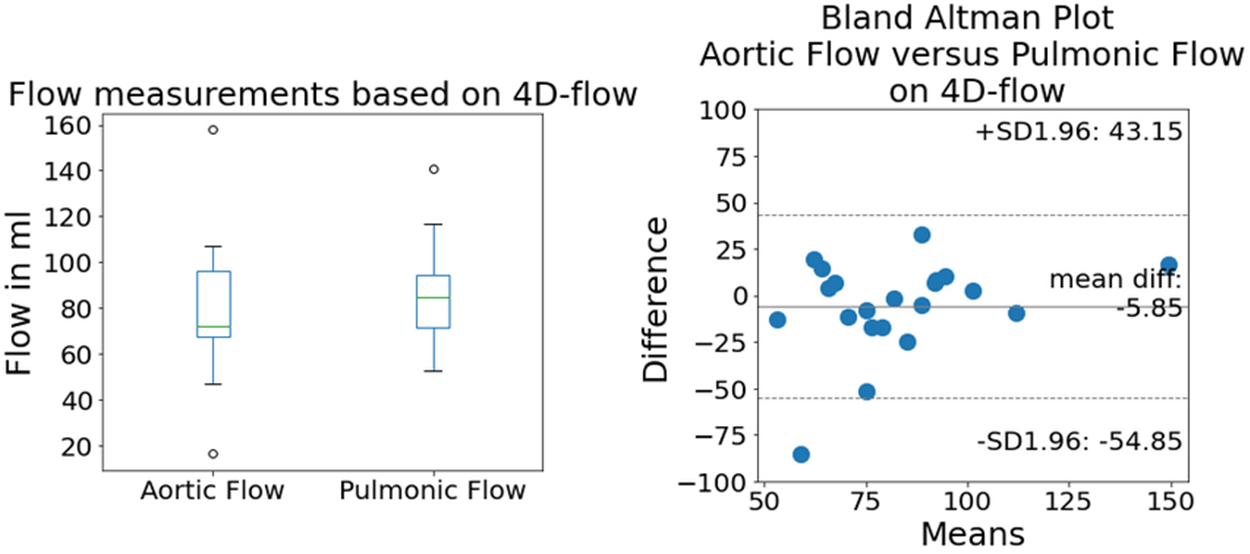
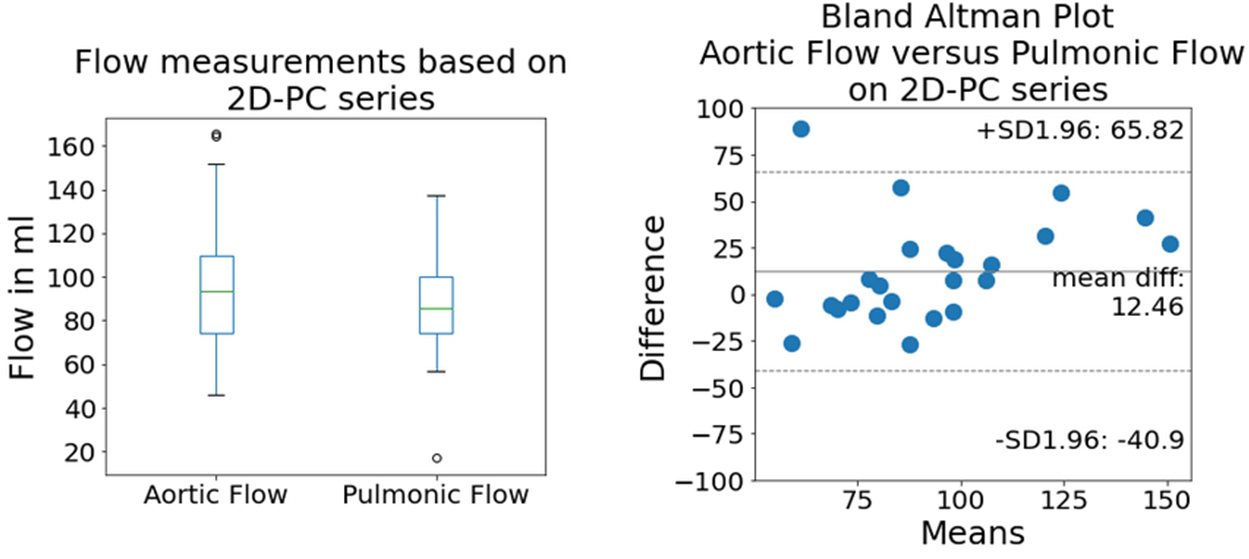
25 patients matched our inclusion criteria, none had a diagnosed cardiac shunt. 24 of 25 patients showed good image quality (96%, one patient showed aliasing at the aortic root in the 4D-flow scan). Median number of acquired 2D-PC series was 7 (range 5-11). Mean measurement time was 12.5min±1.4min for 4D-flow compared to 9.7min±4.5min for the 2D-PC series (p=0.001, Figure 3). 4D-flow-derived aortic and pulmonic flow were 78.96 ml±27.73ml and 84.64ml±20.26ml, respectively. The mean difference of matched measurements from Bland Altman analysis was -5.85ml (Figure 4). The Wilcoxon test showed same distribution (p=0.08). For 2D-PC, aortic and pulmonic flow quantification yielded 96.48ml±32.68ml and 85.85ml±23.95ml, respectively. The mean difference of matched measurements from Bland Altman analysis was +12.46 ml (Figure 5). The Wilcoxon test showed same distribution (p=0.191).Discussion
The initial data analysis of our novel 4D-flow protocol, which was designed for clinical routine, showed two main points: We could acquire a 4D-flow sequence in reasonable time compared to 2D-PC in patients requiring aortic and pulmonic evaluation. The mean measurements of aortic and pulmonic flow were comparable in 4D-flow and 2D-PC and there was no significant difference in the matched pair analysis. Our 4D-flow protocol would take about three minutes longer than the 2D-PC which might be slightly underestimated. Due to coronal full-chest orientation and free-breathing, 4D-flow was easier to acquire, and planning of measurement planes was not necessary in contrast to 2D-PC. Instead, we gained the opportunity for retrospective measurements on editable measurement planes. Our measurements comparing aortic with pulmonic flow, in this patient cohort without shunts, were similar for 4D-flow and 2D-PC. However in Bland Altman analysis, 2D-PC seemed to overestimate, and 4D-flow to underestimate aortic flow, respectively. Imperfectly placed measurement planes in 2D-PC could influence those measurements but this remains uncertain. Further investigation in a larger cohort is required to determine our initial observations. Limitations of this analysis were a small sample size, only two measurement locations and the lack of a systematic comparison with a reference standard.Conclusion
Our 4D-flow protocol, which was designed for clinical routine, was feasible in our cohort resulting in only a minor acquisition time increase of three minutes on average. We will continue to evaluate a larger cohort in order to proof data integrity. If the results are confirmed, we will replace 2D-PC with the 4D-flow protocol in certain cases.Acknowledgements
No acknowledgement found.References
1. Markl, M., et al., 4D flow MRI. J Magn Reson Imaging, 2012. 36(5): p. 1015-36.
2. Nayak, K.S., et al., Cardiovascular magnetic resonance phase contrast imaging. J Cardiovasc Magn Reson, 2015. 17: p. 71.
3. Markl, M., et al., Advanced flow MRI: emerging techniques and applications. Clin Radiol, 2016. 71(8): p. 779-95.
4. Lorenz, R., et al., Influence of eddy current, Maxwell and gradient field corrections on 3D flow visualization of 3D CINE PC-MRI data. Magn Reson Med, 2014. 72(1): p. 33-40.
Figures