2075
Evaluation of Portal System Flow with liver 4D-Flow and APTw MRI in Response to a Meal Challenge1The First Affiliated Hospital of Dalian Medical University, Dalian, China, 2Philips Healthcare, Beijing, China
Synopsis
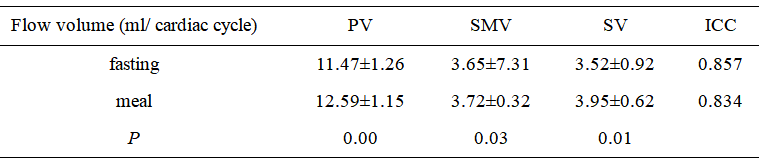
Liver MRI was conducted with both 4D-Flow and APTw imaging before and after a meal challenge. After the meal, significantly increased blood flow velocity and volume were observed in portal vein (PV) and superior mesenteric vein (SMV) and significantly decreased blood flow was observed in splenic vein (PV), while no change was observed in APT values (MTRasym) in liver parenchyma after the meal.
Introduction
Amide proton transfer-weighted (APTw) imaging is a novel imaging tool for the detection of amide protons in mobile cellular proteins and peptides 1.Emerging time-resolved 3D MRIfor blood flow assessment (4D-Flow sequence)provides simultaneous and spatially-coregistered anatomical and hemodynamic information of all vessels within the imaging volume2-3.Meal challenges are standard clinical procedures applied in imaging modalities such as ultrasound and MRI to induce physiological hyperemia4. The purpose of this study was to monitor the changes in liver APT value (MTRasym) and the portal system blood flow changes through a meal challenge in healthy volunteers to investigate the feasibility of non-invasively quantifying the hemodynamic changes in pathological conditions.Methods
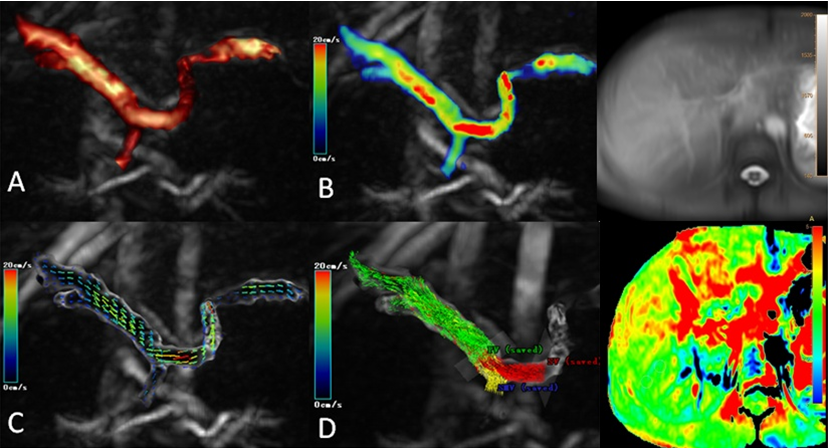
This study has been approved by the institutional IRB. Ten healthy subjects were prospectively enrolled for MRI examination at 3.0 T (Ingenia CX, Philips Healthcare, the Netherlands) with a 16-channel abdominal array coil. The MR protocol included a 3D APTw imaging (axial, TR/TE = 6500/8 ms, FOV = 139×98 mm2, resolution = 2.0×2.0×7 mm3, scan time = 210s) a 2D quantitative flow sequence (axial, TR/TE = 4.4/2.7 ms, FOV = 200×200 mm2, resolution = 1.5×1.5×8 mm3, PC direction = RL, PC velocity = 200 cm/s, scan time = 13 s) to measure the flow velocity in the portal vein as a reference for velocity encodings (VENC), and a 4D-Flow sequence with compressed sensing (CS) acceleration (axial, TR/TE = 5.0/3.2 ms, FOV = 300×350 mm2, resolution = 2.5×2.5×2.5 mm3, PC direction = RL-AP-FH, CS =8, scan time = 370 s) for hemodynamic quantification. VENC was set to 30 cm/s for the 4D flow sequence to slightly surpass the measured velocity and avoid phase wrapping. Scans were taken immediately before the meal and repeated 30 min after the meal. The acquired images were processed on CVI42 (Canada Circle Cardiovascular Imaging)by two radiologists to obtain a 3D angiogram (Figure 1). The measurement planes were put at the middle of the portal vein (PV), superior mesenteric vein (SMV), and splenic vein (SV) trunk. Flow velocity (cm/s)and volume (ml/cardiac cycle) measurements were performed blinded to subject status (fasting/meal). Intra-class correlation coefficients (ICC) was used to check the consistency of the data measured by the two observers. The flow velocity and volume for each vessel were compared before and after the meal using paired t test.Results
The consistency of the data obtained by the two observers were good (ICC value > 0. 75). The APT values (MTRasym) of liver parenchyma was found not change before and after a meal (P>0.05). After meal, significantly increased blood flow velocity and volume were observed in PV and SMV, and significantly decreased blood flow was observed in SV (P<0.05, Table 1).Discussion and Conclusions
We have non-invasively measured the increase of flow velocity and volume in both PV and SMV and the decrease in SV after the meal uptake in all the healthy volunteers using 4D-flow MRI, indicating this technique a sensitive tool for the quantification of portal system flow changes4. A varying range of complicated abdominal and whole-body conditions may involve changes in portal system flow, such as hepatic encephalopathy and hypersplenism, for which 4D-flow MRI can help to provide both diagnosis and therapy monitoring information. Liver APT values were found not changing through the meal challenge, likely because the protein synthesis metabolism takes a relatively longer time.Acknowledgements
No acknowledgement found.References
[1]. Zhou J, Heo HY, Knutsson L, et al. APT-weighted MRI: Techniques, current neuro applications, and challenging issues. J MagnReson Imaging. 2019; 50(2):347-364.
[2] Stankovic Z, Csatari Z, Deibert P, et al. A feasibility study to evaluatesplanchnic arterial and venous hemodynamics by flow-sensitive 4DMRI compared with Doppler ultrasound in patients with cirrhosis andcontrols. Eur J Gastroenterol Hepatol. 2013, 25 (6):669-675.
[3] Stankovic Z, Jung B, Collins J, et al. Reproducibility study of fourdimensionalflow MRI of arterial and portal venous liver hemodynamics:Influence of spatio-temporal resolution. Magn Reson Med. 2013, 72 (2):477-484.
[4] Roldán-Alzate A, Frydrychowicz A, Said A, et al. Impaired Regulation of Portal VenousFlow in Response to a Meal Challenge asQuantified by 4D Flow MRI. Magn Reson Imaging. 2015, 42(4):1009-1017.
Figures