2068
4D Flow MRI evaluation and intraoperative MCA pressure measurements before and after STA-MCA bypass surgery1Nippon Medical School, Tokyo, Japan
Synopsis
The purpose of this study was to clarify the intracranial hemodynamics before and after superficial temporal artery to middle cerebral artery (STA-MCA) bypass surgery by comparing flow parameters obtained by time-resolved 3-dimensional phase-contrast (4D flow) MRI and intraoperative MCA pressure measurement.
The visual and quantitative assessment of 4D flow MRI revealed that intracranial blood flow changes complementarily after STA-MCA bypass surgery. The sum of intracranial BFV can be used for the evaluation of treatment outcome after the surgery.
Introduction
The purpose of this study was to clarify the intracranial hemodynamics before and after superficial temporal artery to middle cerebral artery (STA-MCA) bypass surgery by comparing flow parameters obtained by time-resolved 3-dimensional phase-contrast (4D flow) MRI and intraoperative MCA pressure measurement.Methods
This retrospective study adhered to institutional ethics guidelines and was approved by the institutional review board.Patients
We recruited 23 patients who underwent STA-MCA bypass surgery for ICA or MCA stenosis. We monitored intraoperative MCA pressure, STA pressure, and radial artery (RA) pressure. All patients underwent 4D flow MRI preoperatively and 3 weeks after surgery.
Intraoperative pressure monitoring
We monitored pre-anastomosis MCA pressure, post-anastomosis MCA pressure, and STA pressure during STA-MCA bypass procedures [1]. In addition, radial artery (RA) pressure was monitored as systemic blood pressure. We calculated the increase ratio from pre- to post-MCA pressure as the treatment outcome.
Imaging techniques
4D Flow MRI was performed using an Achieva 3.0-T MRI unit (Philips). The parameters were as follows: repetition time/echo time, 8.4/5.4 ms; K-space segmentation, 2-3 depending on heart rate; temporal resolution, 67.2 ms; flip angle, 13°; velocity encoding (VENC), 120 cm/s; field of view, 210×210×44.8 mm3; voxel size, 0.82×0.82×1.40 mm; 15 cardiac phases; sensitivity encoding factor 2; and nominal acquisition time approximately 6 min. These parameters were set to achieve sufficient image quality to quantify BFV in the intracranial artery with an acceptable scan time for clinical use [2-4].
Evaluation
We quantified the blood flow volume (BFV) of the ipsilateral ICA (BFViICA), contralateral ICA (BFVcICA), basilar artery (BFVBA), ipsilateral STA (BFViSTA), and contralateral STA (BFVcSTA). The sum of intracranial BFV was defined as BFVtotal. We also visually evaluated blood flow direction of ipsilateral M1, A1, and posterior communicating artery (Pcom).
Statistics
We compared BFV parameters, intraoperative MCA pressure, and MCA/RA pressure ratio between before and after surgery using Student’s t-test. Based on the previous study, we categorized patients into three groups according to pre-MCA pressure levels as follows: 1) patients with pre-MCA pressure ≤ 32 mmHg; 2) patients with pre-MCA pressure ≤ 46 mmHg; and 3) all patients [5]. We compared the increase ratio of total BFV and that of MCA pressure in each group, using Spearman correlation coefficient. We compared BFV parameters between the ICA stenosis group and the MCA stenosis group using Mann-Whitney U test.
Results
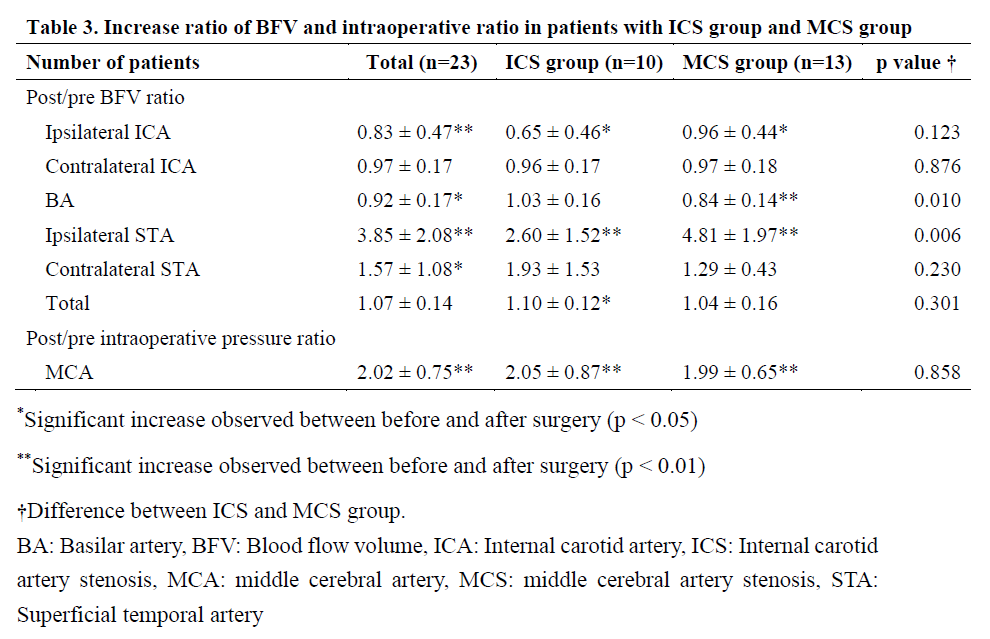
The characteristics of patients are summarized in Table 1.Results of the BFV parameters (Table 2, Table 3, and Figure 1)
BFViSTA significantly increased after surgery (p < 0.001); while BFViICA and BFVBA significantly decreased after surgery (BFViICA, p = 0.005; BFVBA, p = 0.02). No significant difference was observed between BFVcICA before and after surgery (p = 0.07). As a result, BFVtotal postoperatively increased by 6.8%; however, no significant difference was observed (p = 0.07). BFVcSTA significantly increased outside of the skull after surgery (p = 0.01).
Flow direction of ipsilateral A1, Pcom, and M1 (Table2)
Compared to patients with a non-native pattern at A1 or Pcom, patients with a native pattern had higher BFViICA before and after surgery (pre-A1, native: 2.74±4.82 vs. non-native: 0.70±0.00, P < 0.001; post-A1, native: 2.15±4.15 vs. non-native: 0.44±0.12, P = 0.003; pre-Pcom, native: 2.78±5.13 vs. non-native: 0.96±0.12, P = 0.004; post-Pcom, native: 2.37±4.12 vs. non-native: 0.31±0.04, P < 0.001). As regards M1, all patients had native flow (i.e., antegrade or unclear) before and after surgery. Unclear pattern increased after surgery (from 7 to 12 patients).
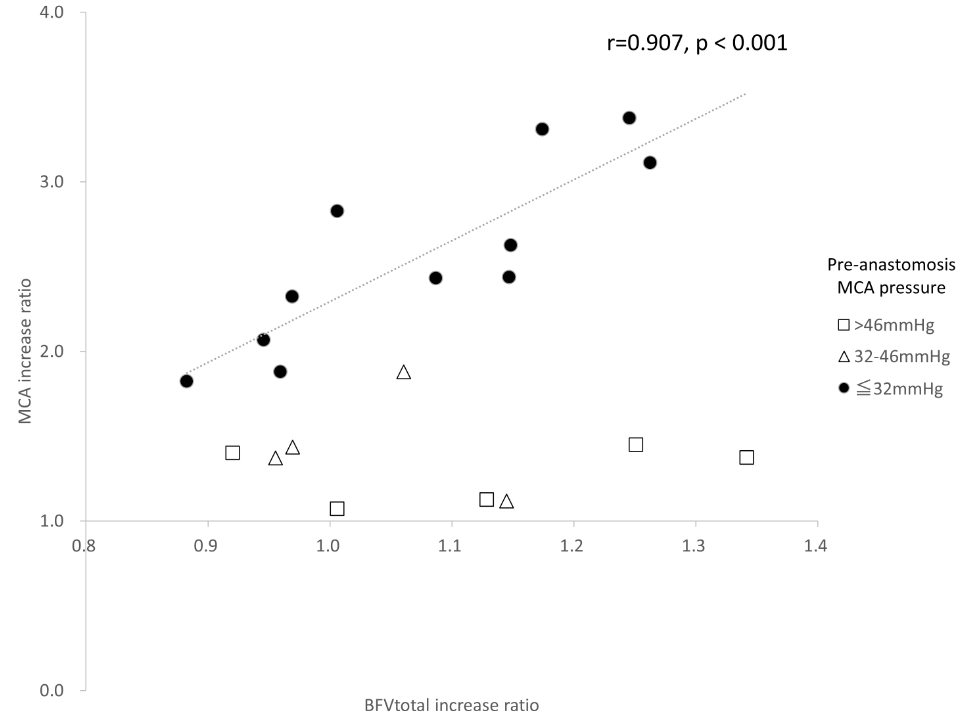
Intraoperative pressure (Table 2, 4 and figure 2)
The results of pressure monitoring are summarized in Table 2. Intraoperative MCA pressure and MCA/RA pressure ratio significantly increased after surgery (p < 0.001). We found a strong positive correlation between MCA pressure increase ratio and BFVtotal increase ratio in patients with pre-MCA pressure ≤ 32 mmHg (r = 0.907, p < 0.001) and a moderate positive correlation in patients with pre-MCA pressure ≤ 46 mmHg (r = 0.689, p = 0.004). Meanwhile, when we included all patients, no significant correlation was observed (p = 0.199) (Table 4, Figure 2). This result was not related to the distinction between ICS and MCS. We found a positive correlation between pre-BFViSTA and STA/RA pressure ratio (r = 0.592, p = 0.006).
ICS group vs. MCS group (Table 2 and 3)
Compared with 13 patients with MCS, ten patients with ICS had lower pre-BFViICA (p < 0.001), lower post-BFViICA (p < 0.001), higher pre-BFVcICA (p = 0.02), and higher post-BFVcICA (p = 0.01) (Table 2). Furthermore, the MCS group had a higher post/pre BFViSTA increase ratio (p = 0.006) and lower post/pre BFVBA increase ratio (p = 0.01) (Table 3).
Conclusion
The visual and quantitative assessment of 4D flow MRI revealed that intracranial blood flow changes complementarily after STA-MCA bypass surgery. The increase of BFV measured by 4D flow MRI had a strong correlation with that of intraoperative MCA blood pressure (r = 0.907) which indicates that 4D flow MRI can be used for the evaluation of treatment outcomes after surgery. Our results may indicate that the blood flow pattern of collateral flow before bypass surgery, and its redistribution after surgery, are different between patients with ICS and MCS.Acknowledgements
No acknowledgement found.References
[1] Matano F, Murai Y, Tanikawa R, Kamiyama H, Tateyama K, Tamaki T, et al. Intraoperative middle cerebral artery pressure measurements during superficial temporal artery to middle cerebral artery bypass procedures in patients with cerebral atherosclerotic disease. J Neurosurg. 2016;125:1367-1373
[2] Orita E, Murai Y, Sekine T, Takagi R, Amano Y, Ando T, et al. Four-dimensional flow mri analysis of cerebral blood flow before and after high-flow extracranial-intracranial bypass surgery with internal carotid artery ligation. Neurosurgery. 2019;85:58-64
[3] Sekine T, Takagi R, Amano Y, Murai Y, Orita E, Matsumura Y, et al. 4d flow mri assessment of extracranial-intracranial bypass: Qualitative and quantitative evaluation of the hemodynamics. Neuroradiology. 2016;58:237-244
[4] Ando T, Sekine T, Murai Y, Orita E, Takagi R, Amano Y, et al. Multiparametric flow analysis using four-dimensional flow magnetic resonance imaging can detect cerebral hemodynamic impairment in patients with internal carotid artery stenosis. Neuroradiology. 2020
[5] Astrup J, Siesjo BK, Symon L. Thresholds in cerebral ischemia - the ischemic penumbra. Stroke. 1981;12:723-725
Figures