2066
Associations of Cardiac Rhythm with left atrial and left atrial appendage hemodynamics measured with 4D flow in Atrial Fibrillation1Radiology, Northwestern University, Chicago, IL, United States, 2Biomedical Engineering, Northwestern University, Chicago, IL, United States, 3Cardiac Surgery, Northwestern University, Chicago, IL, United States, 4Cardiology, Northwestern University, Chicago, IL, United States
Synopsis
Atrial fibrillation (AF) is the most common cardiac arrhythmia, characterized by irregular heart rhythm which can lead to stroke due to thrombus formation in the left atrium (LA) or left atrial appendage (LAA). Reduced velocities and increased stasis measured with 4D flow MRI are risk metrics correlated with LA thrombus formation and potential predictors of stroke. This study analyzed the relationship between heart rate variability derived from a real time MRI acquisition and 4D flow hemodynamic risk metrics. LA peak velocity and stasis were significantly correlated with heart rate variability, suggesting a link between rhythm status and thrombus risk.
Introduction
Atrial fibrillation (AF) is the most common cardiac arrhythmia1 which can result in stroke due to thrombus formation in the left atrium (LA). Left atrial hemodynamics, including peak velocity and stasis, may correlate with risk for atrial thrombus formation and be useful for improving stroke prediction.2,3 4D flow MRI has been previously used to quantify LA flow, demonstrating increased stasis and decreased peak velocity in patients with AF.4,5 However, the impact of cardiac rhythm, or the level of heart rate variability, on 4D flow measured velocity and stasis has not been systematically investigated. The goal of this study was to analyze the relationship between cardiac rhythm and left atrial and left atrial appendage (LAA) peak velocity and stasis in patients with atrial fibrillation.Methods
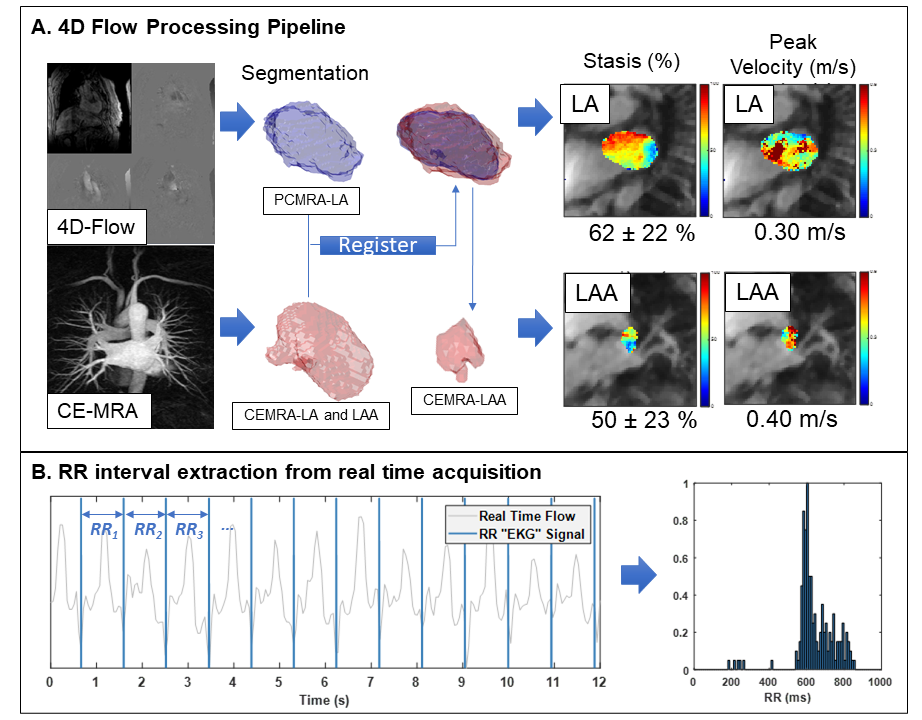
53 patients with AF underwent a pulmonary vein mapping MRI exam prior to an ablation procedure, including 4D flow (spatial resolution = 1.9-3.0 mm3, temporal resolution = 41-77 ms, venc = 50-100 cm/s, 1.5 and 3T MRI systems) and 3D contrast-enhanced (CE) MRA (spatial resolution = 1.3-1.8 mm3). A custom radial real time sequence (real time cine/real time phase contrast6 acquired in the LA) with continuous acquisition was also acquired and used for extracting RR interval information from the raw k-space data.4D flow MRI processing: Following pre-processing (phase offset correction, velocity anti-aliasing), a 3D phase contrast MRA (PC-MRA) was generated from the 4D flow data and used to generate a manual segmentation of the LA (Mimics, Materialise). The LA and LAA were also segmented from the high-resolution CE-MRA. The CE-MRA LA segmentation was registered with the 4D flow LA segmentation7 and applied to both LA and LAA to be used for flow quantification. LA and LAA stasis (% time velocity < 0.1 m/s over cardiac cycle for a voxel) and peak velocity (calculated as the mean of the top 5% of velocities) were calculated. (Figure 1A)
RR-interval Derivation: The scanner patient monitoring unit (PMU) records timestamps and trigger information and embeds them into the raw data of the real-time sequence. Since radial k-space data is continuously acquired, the PMU information served as a continuous record of RR-intervals collected during the same MRI exam. Histograms of RR-interval length were generated for each patient (Figure 1B) and the mean and standard deviation were obtained. Patients were classified into low and high heart rate variability (HRV) groups based on their RR coefficient of variation (CV=RR standard deviation/mean RR interval) using the CV test method reported by Tateno and Glass.8 Rhythm status during the exam was classified as arrhythmia/high HRV for a CV = 0.156-0.3248 (n=27), while a CV below this range was classified as low HRV/sinus rhythm (n=21). For the group comparison, patients with CV>0.324 (n=5) were excluded.
Results
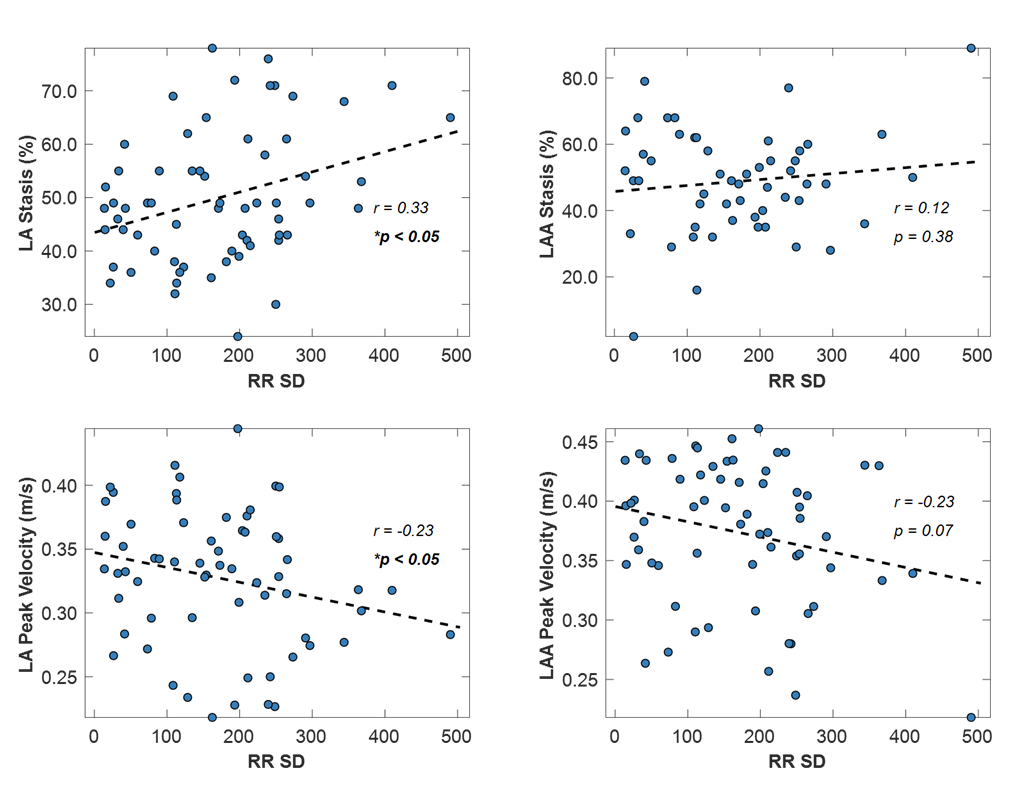
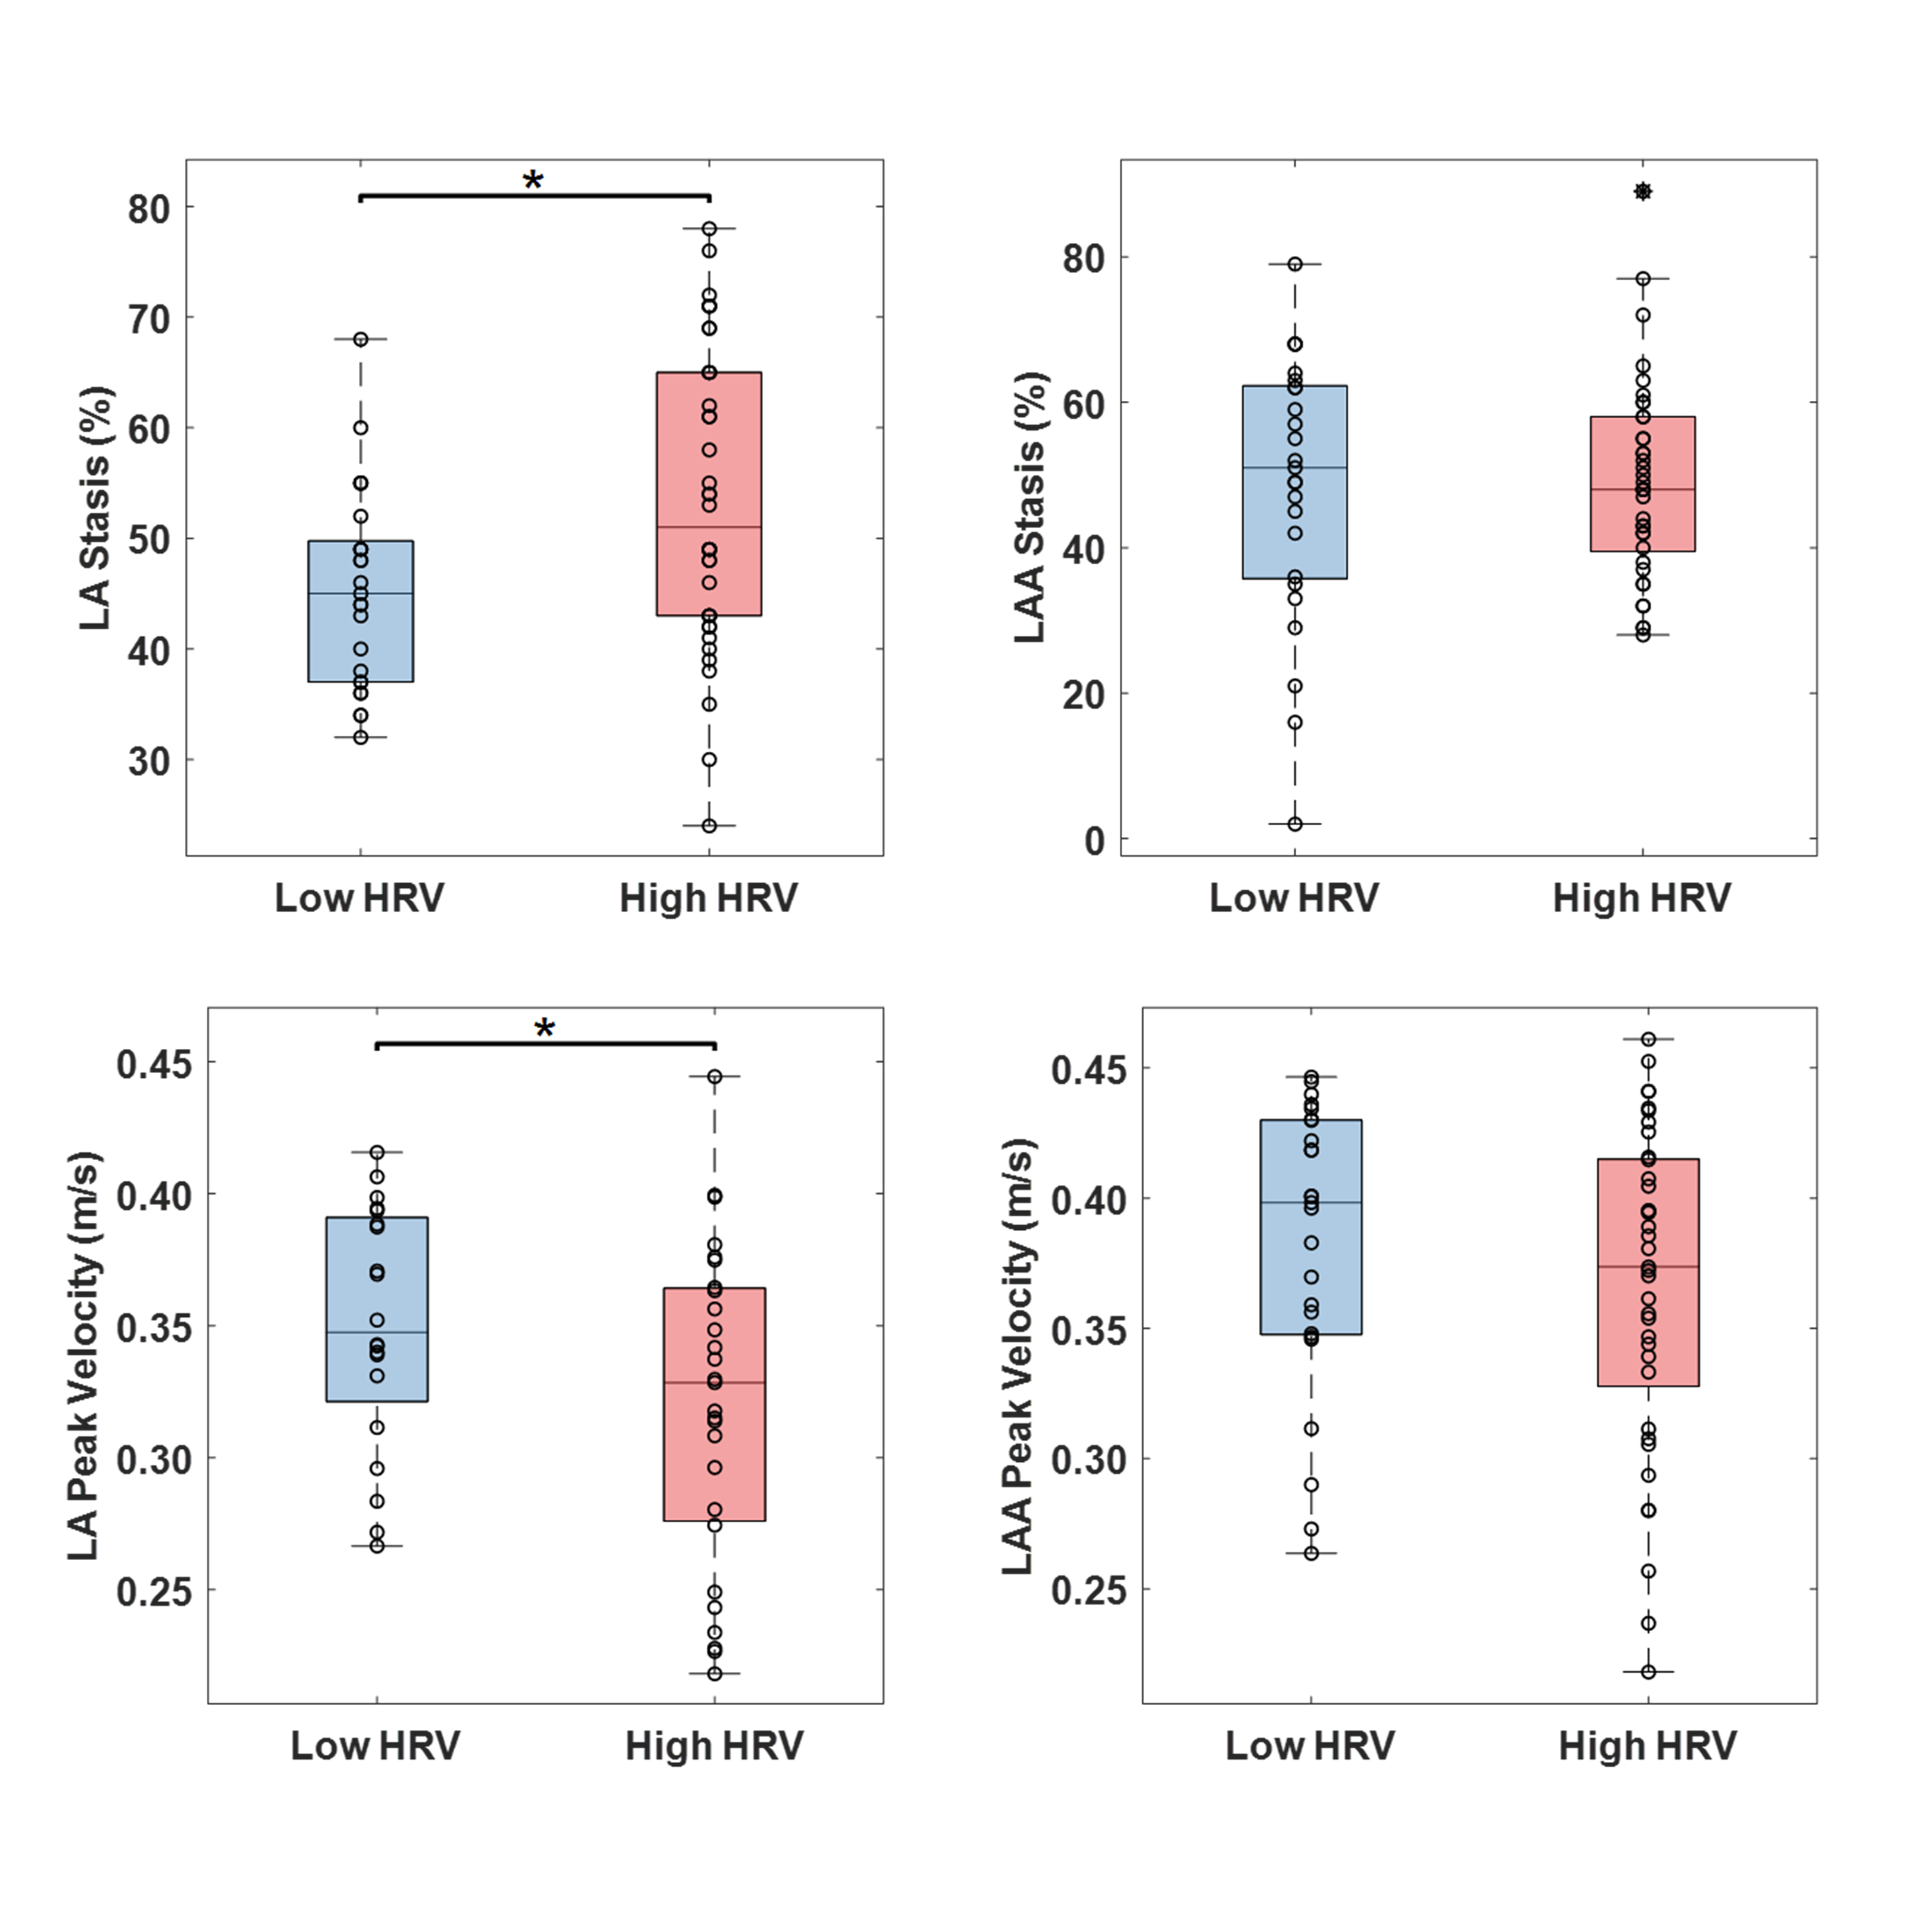
Figure 2 shows plots of LA stasis and peak velocity versus RR standard deviation. Both LA stasis (r=0.33, p<0.05) and LA peak velocity (r=-0.24, p<0.05) were correlated with RR standard deviation, a measure of RR variability. LAA stasis (r=0.12, p=0.38) and LAA peak velocity (r=-0.23, p=0.07) were not significantly correlated with RR variability. Between group comparisons of LA and LAA peak velocity and stasis are shown in Figure 3. LA stasis was significantly increased in the high HRV group compared to the low HRV group (t-test, p<0.05, high HRV: 52±14%, low HRV: 44±9%), and LA peak velocity was significantly decreased (t-test, p<0.05, high HRV: 32±6cm/s, low HRV: 35±5cm/s). Differences in LAA stasis and peak velocity between groups were non-significant.Discussion and Conclusions
The results presented show a trend towards slower LA velocities and elevated LA stasis with higher heart rate variability, suggesting a link between rhythm status and thrombosis risk. 4D flow is an averaged technique and does not capture beat-to-beat variations in flow metrics, however an overall increase in slow flow is observed as the RR-interval distribution disperses and variability increases. The present study did not consider potentially confounding factors associated with disease progression, such as LA volume or morphology. LAA velocity and stasis were not significantly correlated with HRV. This could be attributed to increased measurement noise and difficulty detecting the small LAA during segmentation (mitigated by using CE-MRA in the present study), or reflective of physiological differences between the LA and LAA hemodynamics with arrhythmia. Future work including an expanded patient cohort and follow-up (post ablation) MRI data will further investigate the relationship between rhythm status and hemodynamics in AF.Acknowledgements
No acknowledgement found.References
1. January CT, Wann LS, Alpert JS, Calkins H, Cigarroa JE, Cleveland JC Jr, et al. 2014 AHA/ACC/HRS guideline for the management of patients with atrial fibrillation. J Am Coll Cardiol. 2014; 64(21):2246–80.
2. Goldman ME, Pearce LA, Hart RG, Zabalgoitia M, Asinger RW, Safford R, Halperin JL. Pathophysiologic correlates of thromboembolism in nonvalvular atrial fibrillation: I. Reduced flow velocity in the left atrial appendage (The Stroke Prevention in Atrial Fibrillation [SPAF-III] study). J Am Soc Echocardiogr. 1999; 12:1080–1087.
3. Fatkin D, Kelly RP, Feneley MP. Relations between left atrial appendage blood flow velocity, spontaneous echocardiographic contrast and thromboembolic risk in vivo. J Am Coll Cardiol. 1994; 23:961–969.
4. Markl M, Lee DC, Ng J, Carr M, Carr J and Goldberger JJ. Left Atrial 4D Flow MRI: Stasis and Velocity Mapping in Patients with Atrial Fibrillation. Invest Radiol. 2016; 51:147.
5. Markl M, Lee DC, Furiasse N, et al. Left Atrial and Left Atrial Appendage 4D Blood Flow Dynamics in Atrial Fibrillation. Circ Cardiovasc Imaging. 2016; 9(9):e004984.
6. Haji-Valizadeh H, Feng L, Ma LE, Shen D, Block KT, Robinson JD, Markl M, Rigsby CK, Kim D. Highly accelerated, real-time phase-contrast MRI using radial k-space sampling and GROG-GRASP reconstruction: a feasibility study in pediatric patients with congenital heart disease. NMR Biomed 2020; 33(5):e4240.
7. Jenkinson M, Smith S. A global optimisation method for robust affine registration of brain images. Med Image Anal. 2001; 5(2):143-156.
8. Tateno and Glass. Automatic detection of atrial fibrillation using the coefficient of variation and density histograms of RR and ∆RR Intervals. Med. Biol. Eng. Comput. 2001; 39:664-671
Figures