2065
Assessment of sex differences in ventricular-vascular coupling of left ventricular and aortic flow derived from 4D Flow MRI in healthy adults1Radiology, University of Wisconsin-Madison, MADISON, WI, United States, 2Biomedical Engineering, University of Wisconsin-Madison, MADISON, WI, United States, 3Mechanical Engineering, University of Wisconsin-Madison, Madison, WI, United States
Synopsis
To gain insight into male-female differences in cardiovascular conditions, understanding healthy, sex differences is critical. We analyzed 20 healthy subjects with cardiac 4D flow MRI data (10 male and 10 female) to quantify LV and aortic flow, and ventricular vascular coupling (VVC) of KE and vorticity. The sex difference found in LV flow were not found in aortic flow. The VVC of LV-to-aortic flow was similar for men and women. The analysis methods and results of this study may be of further use in understanding ventricular vascular coupling of flow variables in various cardiovascular conditions.
Introduction
Males and females have been found to respond differently to cardiovascular disease (CVD)1-2. Prior studies3-4 have investigated cardiovascular sex differences in healthy to better understand sex differences in CVD. 4D Flow MRI is an increasingly used tool to study cardiac function by non-invasively measuring time-resolved velocity fields in the heart and large vessels5-7, and previous studies using 4D Flow MRI have shown kinetic energy (KE) and vortexes to be altered in a variety of CVDs8-12.The 4D Flow MRI literature has neglected that cardiovascular function is a combination of both the heart and vasculature’s status. The first conceptual framework of the cardiac and vascular interactions was formulated as ventricular vascular coupling (VVC)13. We apply the concept of VVC to define a novel metric 4D Flow MRI VVC based on the hypothesis that elevated kinetic energy in the left ventricle (LV) is not necessarily inefficient if LV KE is successfully transferred to aortic KE.
Methods
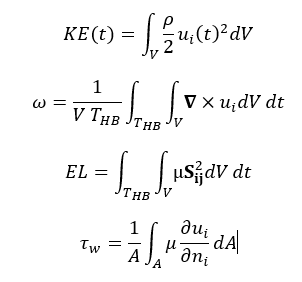
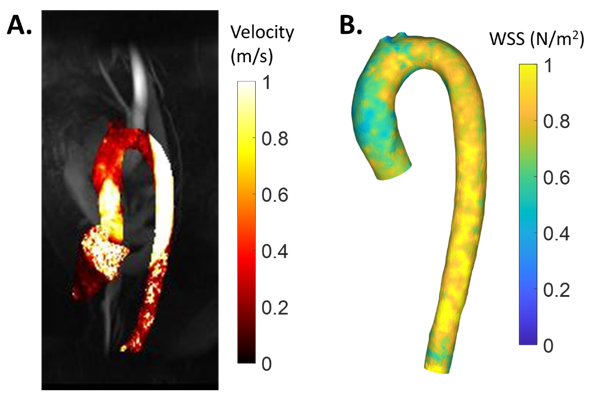
In this IRB-approved and HIPPA-compliant study, 20 subjects with no history of heart disease (10 male and 10 female) were recruited. MRI was performed on a 3.0T imaging system using bSSFP sequence and the 4D Flow MRI sequence PC-VIPR14. Ventricular volumes were calculated from bSSFP images, and the LV and aorta were segmented from time-averaged 4D Flow MRI, using the Mimics (Materialise, Leuven, Belgium).Kinetic energy at peak systole and peak diastole for the LV and peak systole for aorta, along with vorticity (ω), and viscous energy loss (EL) for both the LV and aorta were calculated from the equations shown in Figure 1. The results were then normalized by stroke volume and normalized by mask volume, in dimensionless form for the LV and aorta, respectively. VVC for both KE and vorticity was calculated by calculating the LV-to-aorta value ratio. Aorta wall shear stress (WSS) was calculated from triangulated surface meshes by taking the cross product of the velocity vector and the surface normal vector and then averaged over the aorta surface (Figure2). This equation is also shown in Figure 1. These results were also non-dimensionalized. Male and female groups were compared using the non-parametric Mann-Whitney U test.Results
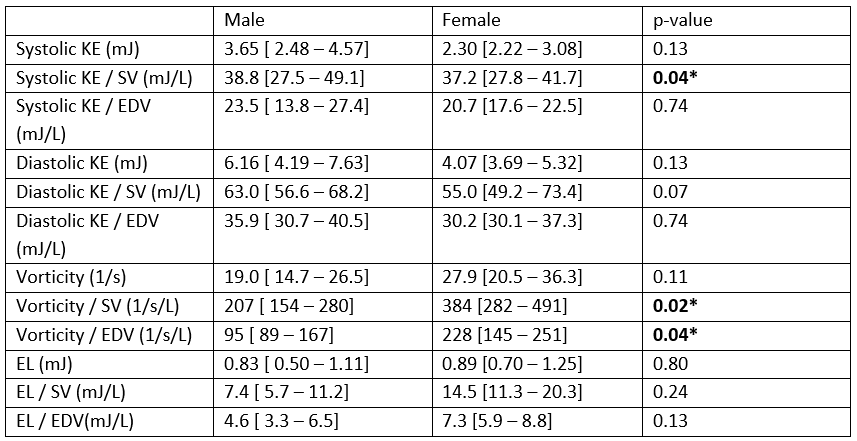
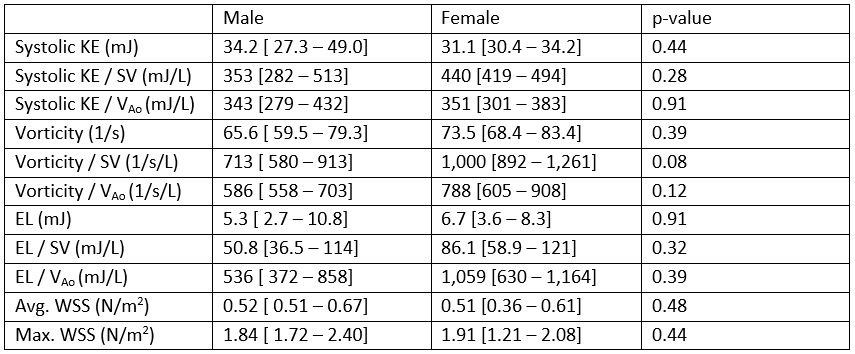
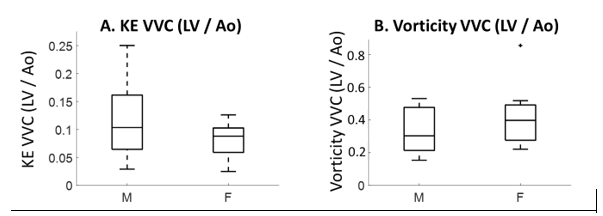
Systolic LV KE normalized by stroke volume was significantly larger in male participants (p=0.04), and diastolic LV KE normalized by stroke volume trended towards being greater in male participants (p=0.07). When LV KE was normalized by EDV, it was similar for both groups. Average LV vorticity when normalized SV and EDV was significantly larger in females (p=0.02 and p=0.04). LV EL trended towards being greater in female participants when normalized by EDV (p=0.13). Dimensionless LV flow parameters were similar between male and female participants (systolic p=0.81, diastolic p=0.42) (Table1). For aortic (Ao) flow, when normalized by either SV or Ao volume, Ao KE, EL, and WSS were all similar between both groups, while vorticity trended towards being greater in females (p=0.08 and p=0.12 respectively) (Table2). Differences in KE VVC and vorticity VVC were not found between male and female participants. KE and vorticity were consistently greater in the aorta giving KE VVC values less than 0.25 and vorticity VVC values less than 1.0 (Figure3).Discussion
By applying the concept of VVC to 4D Flow MRI, it was found that males have greater kinetic energy and females have greater vorticity in the left ventricle; aortic flow was similar between the two groups. No differences in VVC were found between male and female participants suggesting that both flow patterns equally transfer transported flow variables from LV flow to aortic flow. This dimensional analysis suggests that previously identified sex differences in LV flow15 were largely due to men having greater cardiac output and ventricular volumes than women.In our results, dimensional analysis accounted for differences in cardiac output and ventricular volume explaining the differences found in LV flow showing the utility of dimensional to accounts for the anatomic differences between healthy men and women when comparing healthy and diseased populations. The advantages of presenting results in dimensionless form, as shown in this study, including that the impacts of SV, EDV, and HR are accounted for in addition to being the proper way to normalize variables from a fluid dynamics perspective.
Our concept of 4D Flow MRI-based VVC is not attempting to non-invasively calculate the traditional VVC like other approaches based on ventricular volumes16. Instead, we applied a similar conceptual framework to develop a novel metric of the coupling of aorta flow and LV flow. The analysis methods and results of this study may be of further use in understanding ventricular vascular coupling of transported flow variables in healthy sex differences, healthy aging, and various CV conditions.
Conclusion
Male-female sex differences in LV flow were not found in aortic flow, and the coupling of LV-aortic flow was similar between men and women. Dimensional analysis to account for differences in cardiac output and ventricular volume explained the differences found in LV flow.Acknowledgements
We acknowledge GE Healthcare, which provides research support to the University of WisconsinReferences
[1] Aggarwal, N.R., Patel, H.N., Mehta, L.S., Sanghani, R.M., Lundberg, G.P., Lewis, S.J., Mendelson, M.A., Wood, M.J., Volgman, A.S., Mieres, J.H., 2018. Sex Differences in Ischemic Heart Disease: Advances, Obstacles, and Next Steps. Circ. Cardiovasc. Qual. Outcomes 11. https://doi.org/10.1161/CIRCOUTCOMES.117.004437
[2] Humphries, K.H., Izadnegahdar, M., Sedlak, T., Saw, J., Johnston, N., Schenck-Gustafsson, K., Shah, R.U., Regitz-Zagrosek, V., Grewal, J., Vaccarino, V., Wei, J., Bairey Merz, C.N., 2017. Sex differences in cardiovascular disease – Impact on care and outcomes. Front. Neuroendocrinol. https://doi.org/10.1016/j.yfrne.2017.04.001
[3] Andre, F., Steen, H., Matheis, P., Westkott, M., Breuninger, K., Sander, Y., Kammerer, R., Galuschky, C., Giannitsis, E., Korosoglou, G., Katus, H.A., Buss, S.J., 2015. Age- and gender-related normal left ventricular deformation assessed by cardiovascular magnetic resonance feature tracking. J. Cardiovasc. Magn. Reson. 17. https://doi.org/10.1186/s12968-015-0123-3
[4] Kolar, F., Ostadal, B., 2013. Sex differences in cardiovascular function. Acta Physiol. 207, 584–587. https://doi.org/10.1111/apha.12057
[5] Francois, C.J., Srinivasan, S., Landgraf, B.R., Niespodzany, E., Wieben, O., Frydrychowicz, A., 2011. Analysis of right heart flow patterns in repaired Tetralogy of Fallot with 4D flow-sensitive MRI. J. Cardiovasc. Magn. Reson. 13, 1–2. https://doi.org/10.1186/1532-429x-13-s1-p206
[6] Hirtler, D., Garcia, J., Barker, A.J., Geiger, J., 2016. Assessment of intracardiac flow and vorticity in the right heart of patients after repair of tetralogy of Fallot by flow-sensitive 4D MRI. Eur. Radiol. 26, 3598–3607. https://doi.org/10.1007/s00330-015-4186-1
[7] Stoll, V.M., Hess, A.T., Rodgers, C.T., Bissell, M.M., Dyverfeldt, P., Ebbers, T., Myerson, S.G., Carlhäll, C.J., Neubauer, S., 2019. Left Ventricular Flow Analysis. Circ. Cardiovasc. Imaging 12, e008130. https://doi.org/10.1161/CIRCIMAGING.118.008130
[8] N. Al-Wakeel, J. F. Fernandes, A. Amiri, H. Siniawski, L. Goubergrits, F. Berger, and T. Kuehne, “Hemodynamic and Energetic Aspects of the Left Ventricle in Patients With Mitral Regurgitation Before and After Mitral Valve Surgery.”
[9] Q. J. Han, W. R. T. Witschey, C. M. Fang-Yen, J. S. Arkles, A. J. Barker, P. R. Forfia, and Y. Han, “Altered Right Ventricular Kinetic Energy Work Density and Viscous Energy Dissipation in Patients with Pulmonary Arterial Hypertension: A Pilot Study Using 4D Flow MRI,” PLoS One, vol. 10, no. 9, p. e0138365, Sep. 2015.
[10] R. Chen, B.-W. Zhao, B. Wang, H.-L. Tang, P. Li, M. Pan, and L.-L. Xu, “Assessment of Left Ventricular Hemodynamics and Function of Patients with Uremia by Vortex Formation Using Vector Flow Mapping.”
[11] N. Fukuda, K. Itatani, K. Kimura, A. Ebihara, K. Negishi, K. Uno, K. Miyaji, M. Kurabayashi, and K. Takenaka, “Prolonged vortex formation during the ejection period in the left ventricle with low ejection fraction: A study by vector flow mapping,” J. Med. Ultrason., vol. 41, no. 3, pp. 301–310, 2014.
[12] Y. Hu, L. Shi, S. Parameswaran, S. Smirnov, and Z. He, “Left Ventricular Vortex Under Mitral Valve Edge-to-Edge Repair.,” Cardiovasc. Eng. Technol., vol. 1, no. 4, pp. 235–243, Dec. 2010.
[13] Sagawa, K., 1981. The end-systolic pressure-volume relation of the ventricle: Definition, modifications and clinical use. Circulation. https://doi.org/10.1161/01.CIR.63.6.1223
[14] Johnson, K.M., Lum, D.P., Turski, P.A., Block, W.F., Mistretta, C.A., Wieben, O., 2008. Improved 3D phase contrast MRI with off-resonance corrected dual echo VIPR. Magn. Reson. Med. 60, 1329–1336. https://doi.org/10.1002/mrm.21763[16] Sanz, J., García-Alvarez, A., Fernández-Friera, L., Nair, A., Mirelis, J.G., Sawit, S.T., Pinney, S., Fuster, V., 2012. Right ventriculo-arterial coupling in pulmonary hypertension: A magnetic resonance study. Heart 98, 238–243. https://doi.org/10.1136/heartjnl-2011-300462
[15] Rutkowski, D.R., Barton, G.P., François, C.J., Aggarwal, N., Roldán-Alzate, A., 2020. Sex Differences in Cardiac Flow Dynamics of Healthy Volunteers. Radiol. Cardiothorac. Imaging 2, e190058. https://doi.org/10.1148/ryct.2020190058
[16] Sanz,
J., García-Alvarez, A., Fernández-Friera, L., Nair, A., Mirelis, J.G., Sawit,
S.T., Pinney, S., Fuster, V., 2012. Right ventriculo-arterial coupling in
pulmonary hypertension: A magnetic resonance study. Heart 98, 238–243.
https://doi.org/10.1136/heartjnl-2011-300462
Figures