2061
Differentiation of spinal epidural hematoma and infection in vertebral decompression patients using Diffusion-Relaxation Matrix (DRM)1Radiology, Eastern Chiba Medical Center, Chiba, Japan, 2Philips Japan, Tokyo, Japan, 3Eastern Chiba Medical Center, Chiba, Japan
Synopsis
Postoperative complications such as vertebral decompression can lead to hematoma formation and infection. The differentiation of hematoma from infection as a postoperative follow-up is important in assessing future treatment options and the need for surgery. The aim of this study was to differentiate between spinal epidural hematoma, spinal epidural abscess and pyogenic spondylitis based on the ADC and T2 values obtained using DRM. The T2 and diffusion weighted T2 (ΔT2) values were significantly higher in abscesses than in hematomas, and even higher in pyogenic spondylitis.DRM allows to differentiate hematoma from infection.
Purpose
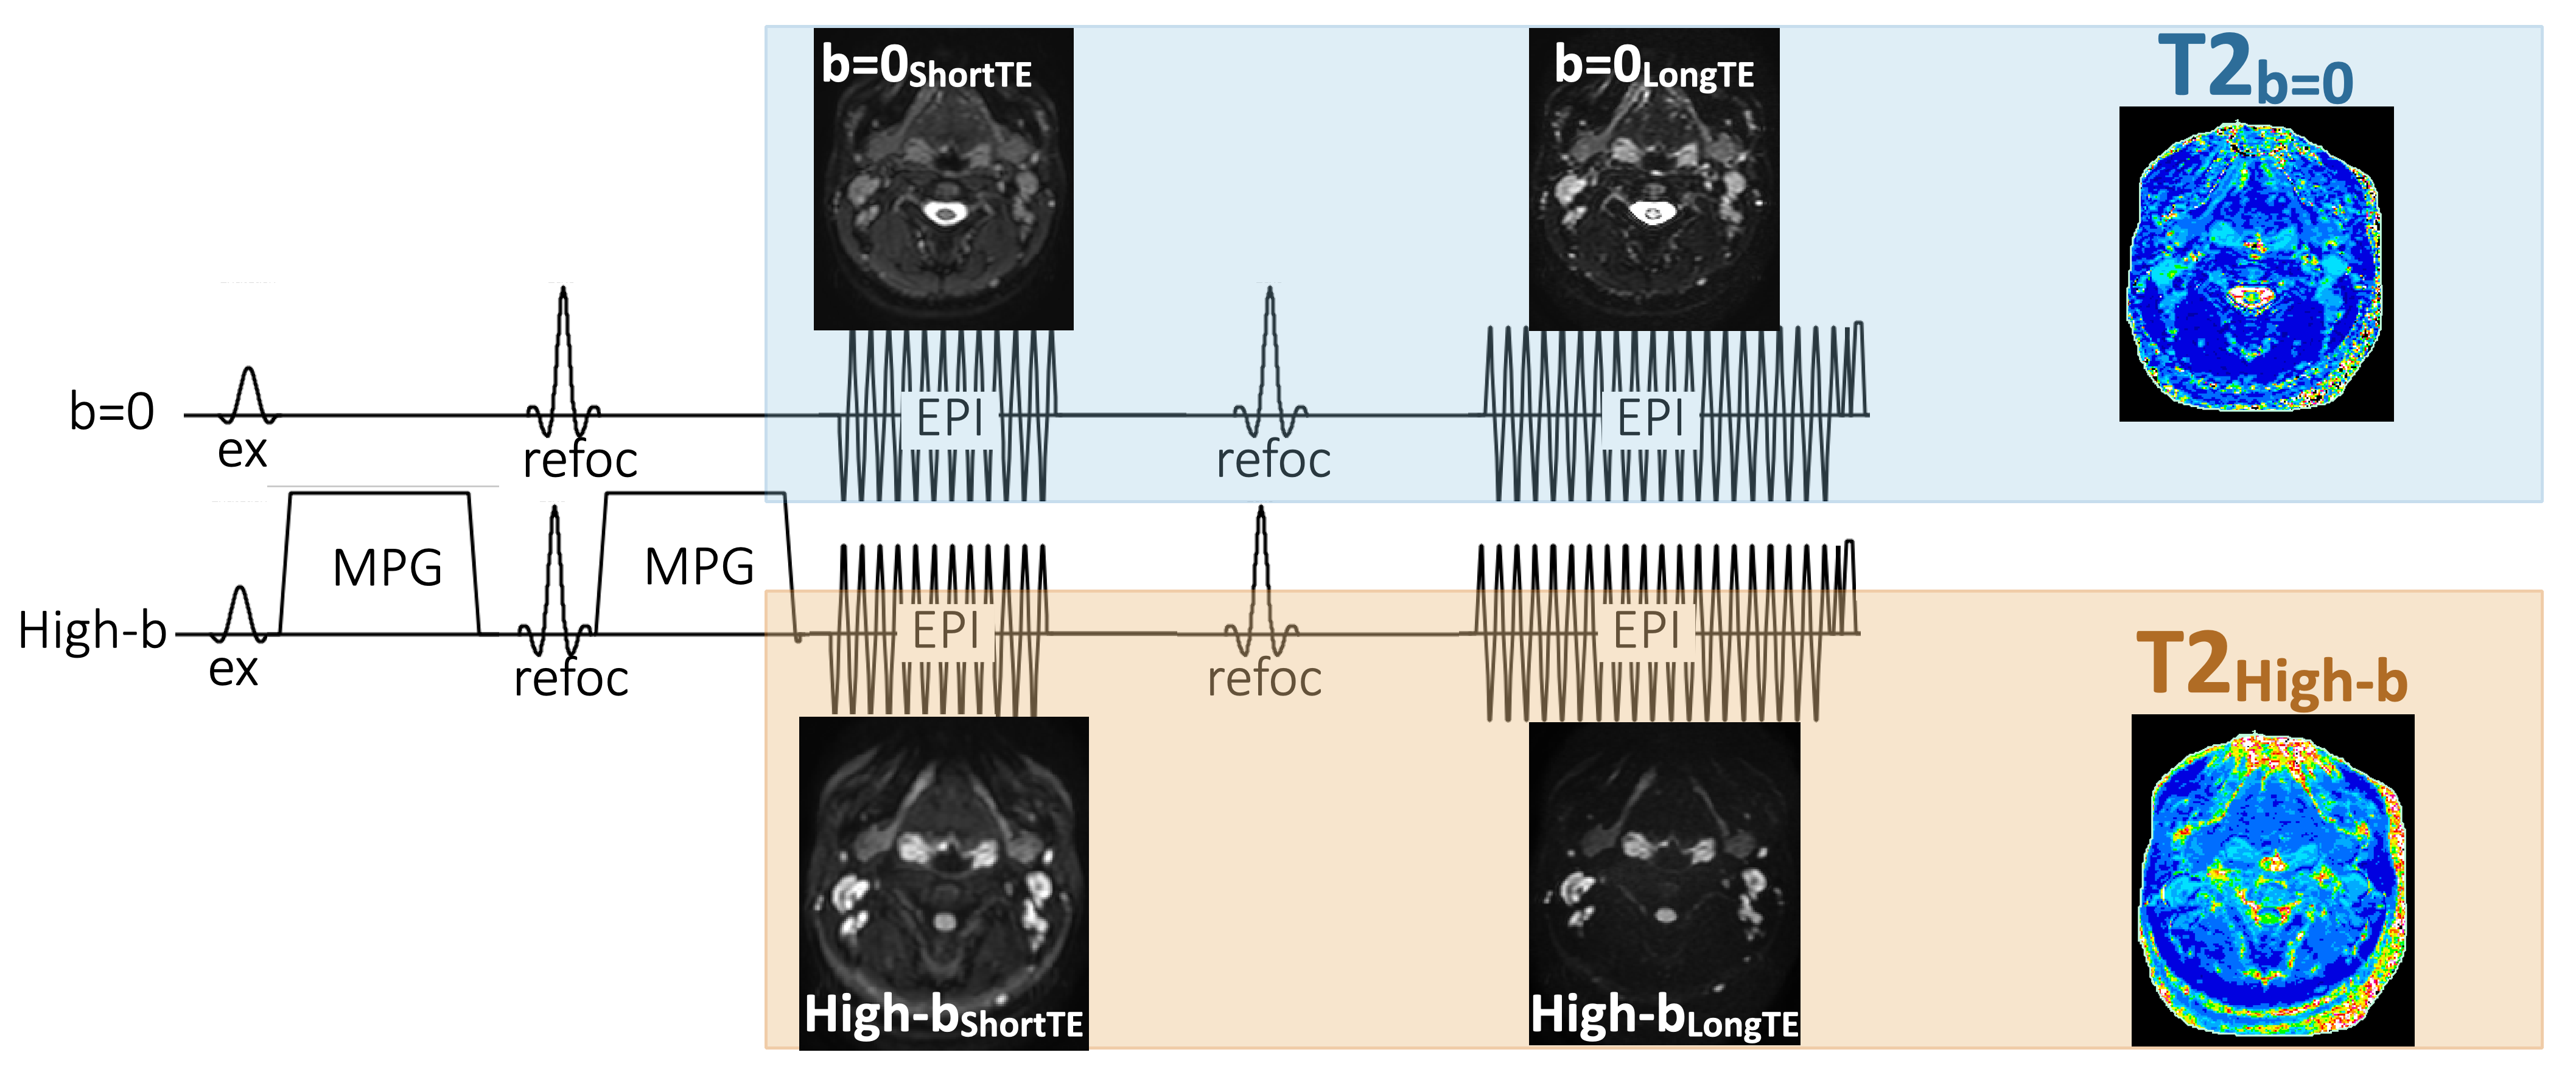
Postoperative complications such as vertebral decompression can lead to hematoma formation and infection. Spinal epidural hematoma (SEH) and spinal epidural abscess (SEA) and pyogenic spondylitis (PS) are the most common types of infection.1) SEA is a serious infection that requires rapid treatment and occasionally urgent surgical intervention.2)Therefore, differentiation of hematoma from infection as a postoperative follow-up is important in assessing the need for further treatment and surgery. In the present study, we used a diffusion-relaxation matrix (DRM) sequence (Fig.1), which allows setting of a dual echo without prolonged imaging time in single-shot EPI-DWI.3) The aim of this study was to evaluate the possibility of differentiating between SHE, SEA and PS using the ADC and T2 values obtained by DRM.Methods
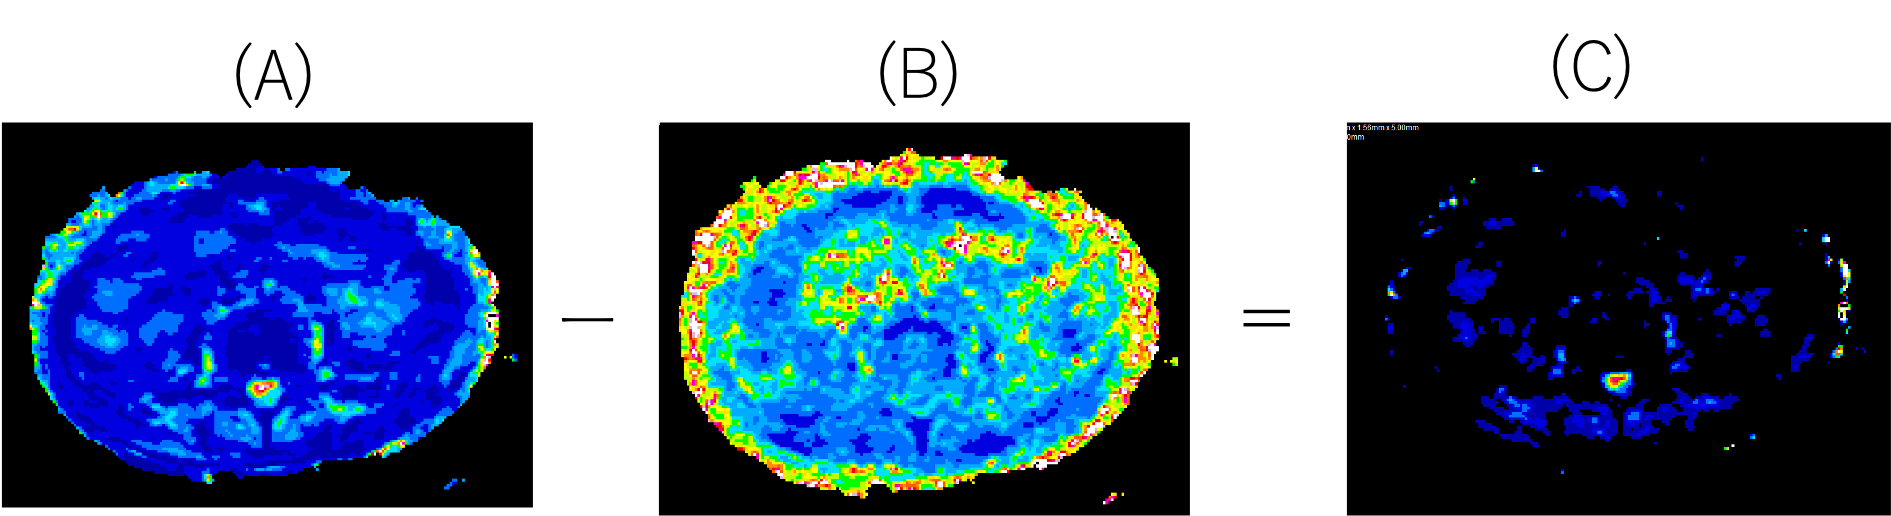
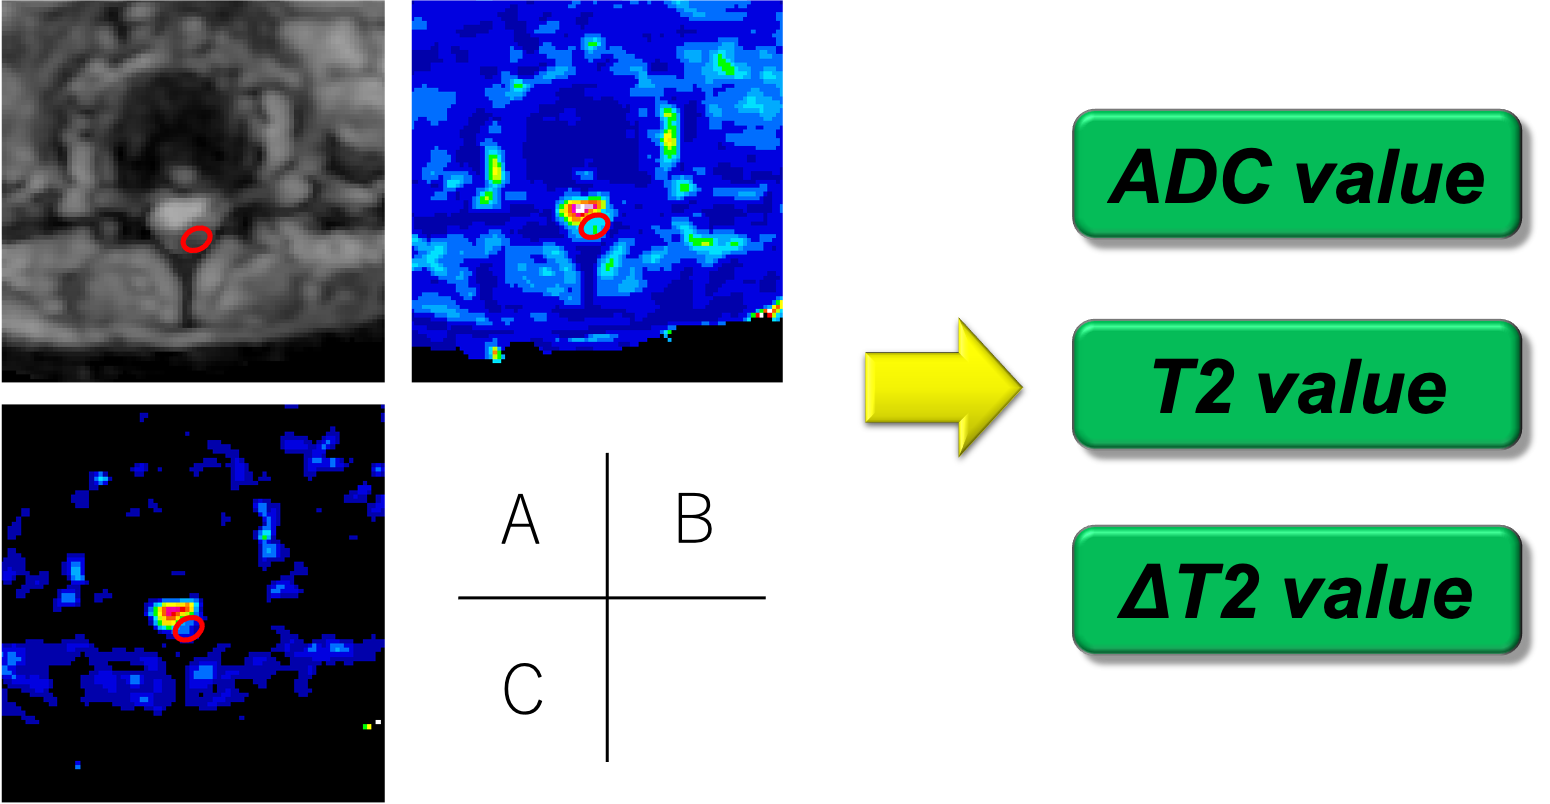
We used a 3.0T MRI (Ingenia CX; Philips Healthcare, Best, The Netherlands) for DRM imaging in a group of patients with SEH (5 patients), SEA (5 patients) and PS (5 patients). SEH patients underwent the examination from a few hours to 3 days (acute to subacute) after the onset of symptoms. The ADC map and T2 map were generated from the two TE (TE : 42, 120) images and two b-values (0, 1000) using dedicated software. The ΔT2 map was also created by differencing the T2 map (b-1000) from the T2 map (b-0) (Fig.2). ADC, T2 and ΔT2 values were calculated with ROIs placed in hematoma and abscess areas (Fig.3).Results
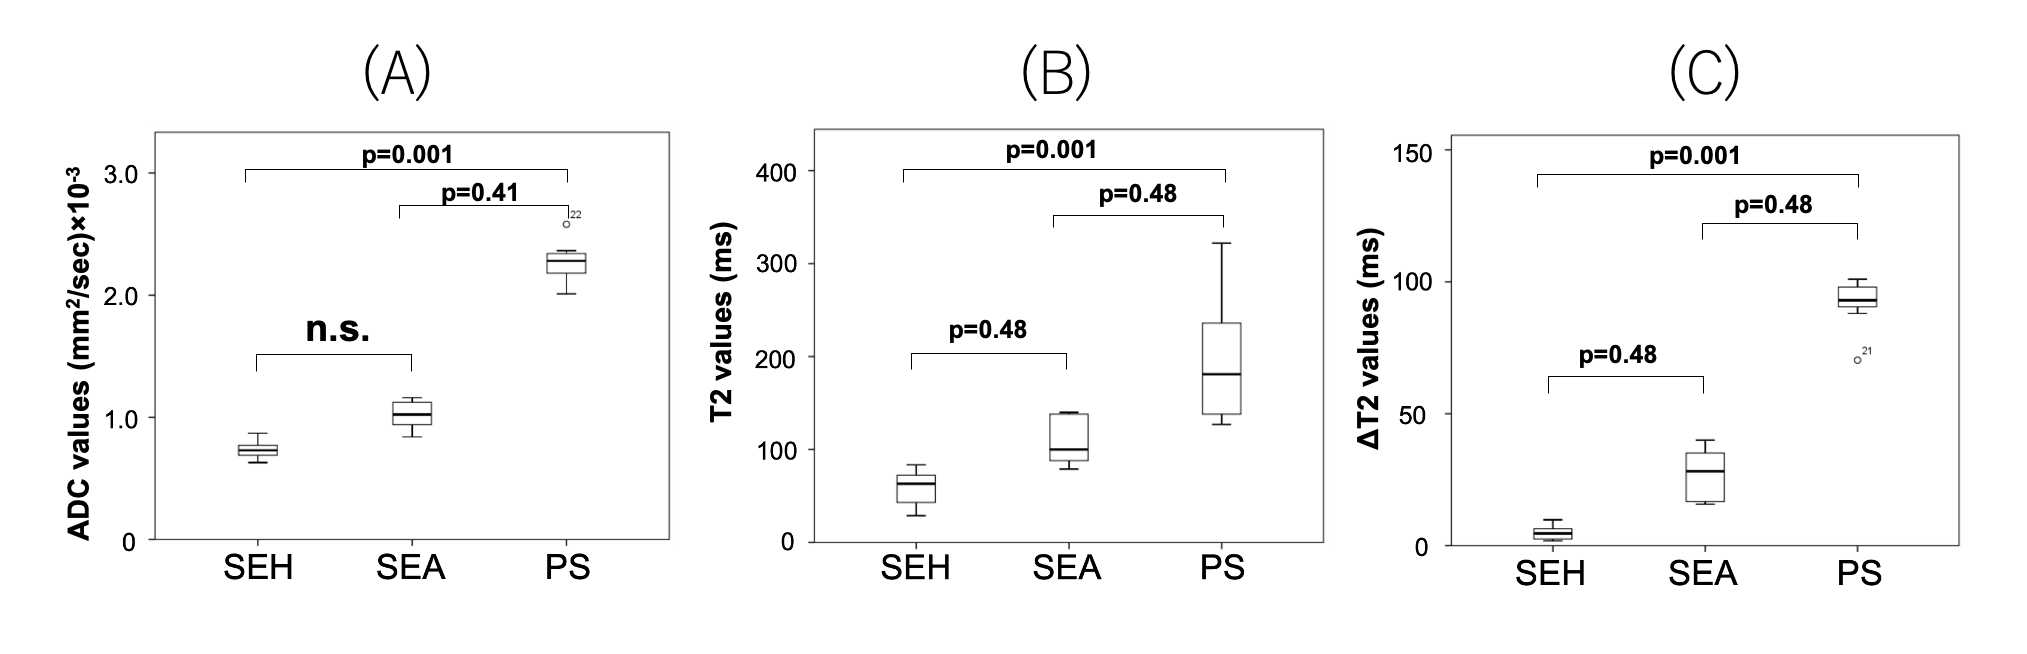
Although there was no significant difference in ADC values between the SEH and SEA areas, T2 values were significantly higher in the SEA than in the SEH, and even higher in PS. Moreover, ΔT2 values were significantly lower in SEH (2-8 ms) than in SEA (20-40 ms) (Fig.4). This is because the structure of the acute hematoma is less susceptible to diffusional limitation of water molecules. These findings suggest that T2 and ΔT2 values can be useful for differentiating SEH and SEA.Conclusion
DRM could be useful for differentiation of spinal epidural hematoma and infection in postoperative vertebral decompression patients by using its ADC, T2 and diffusion-weighed T2 (ΔT2) values.Acknowledgements
No acknowledgement found.References
1) Tsuchiya K, et al: Diffusion-weighted MRI of subdural and epidural empyemas: Neuroradiology 2003;45:220–223.
2) Anna Shifrin, et al: Paraspinal Edema Is the Most Sensitive Feature of Lumbar Spinal Epidural Abscess on Unenhanced MRI: AJR 2017; 209:176–181.
3) Noriyuki Fujima, et al: Diffusion weighted T2-mapping for the determination of tissue characteristics in patients with head and neck squamous cell carcinoma: ISMRM2018
Figures