2060
Evaluation of Multi-shot DTI Metrics at Non-Compressed Levels for the Diagnosis and Prognosis of Degenerative Cervical Myelopathy (DCM)1Center for Biomedical Imaging Research, Beijing, China, 2Electrical Engineering and Computer Sciences, University of California, Berkeley, Berkeley, CA, United States, 3Beijing Jishuitan Hospital, Beijing, China, 4University of Minnesota, Minnesota, Minnesota, MN, United States, 5GE Healthcare, MR Research China, Beijing, China
Synopsis
Degenerative cervical myelopathy (DCM) is a chronic disease of spinal cord. The sensitivity of conventional structural T1W and T2W MRI to the diagnosis of DCM is low. Diffusion tensor imaging (DTI) can provide quantitative assessments for pre- and post-surgery spinal cord functions. However, the prognostic value of DTI metrics at the level-of-most-compression (LMC) remains controversial. Additionally, it is difficult to differentiate the clinical utility of various tracts at LMC due to severe compressions and limited resolution. This retrospective cohort follow-up study aimed to investigate the correlation of DTI metrics with clinical assessment in different tracts at non-compressed C2 level.
Introduction
Degenerative cervical myelopathy (DCM) is the major cause of non-traumatic spine injury worldwide[1]. The diagnosis and evaluation of DCM currently depend on clinical behavioral assessments and conventional structural MRI[2,3]. However, the sensitivity of abnormal signals in structural images for early detection of DCM is low[4-6]. Moreover, the post-surgery prognosis value of the intramedullary abnormal signal is debatable[4,7]. Diffusion tensor imaging (DTI) provides quantitative information of microstructure including fractional anisotropy (FA) and diffusivities. Numerous studies have reported a significant correlation of DTI metrics with pre-or post-surgery clinical assessment[8,9]. However, the prognostic value of DTI metrics at the level of most compression (LMC) remains controversial[10]. Meanwhile, the clinical value of non-compressed levels and different tracts have not been investigated. Furthermore, the differentiation of various tracts at LMC is challenging due to stenosis and limited spatial resolution. This necessitates a follow-up study with improved resolution DTI which allows better ROI analysis. Therefore, In this study, a multi-shot EPI (MS-EPI) technique was adopted for pre-and post-surgery DTI along with clinical assessment using Japanese Orthopedic Association (JOA)[11,12] scores. Particularly, given the previously reported variations of DTI metrics across vertebral levels[13,14] and difficult ROI determination at LMC, measured DTI metrics at non-compressed C2 level were analyzed. Automatic atlas-based analysis was performed subsequent to separately investigating the diagnostic values of various tracts.Methods
Study designThis was a retrospective cohort study of patients with DCM before and after surgery. Patients were excluded in the presence of spinal trauma, history of neurological diseases, or surgery. 60 patients with DCM were included (38 males and 22 females), where the mean age was 59.44 (range 35-73 yrs) years. The most compressed level was C2/3 in 1 patient, C3/C4 in 11 patients, C4/5 in 22 patients, C5/6 in 25 patients, and C6/7 in 1 patient. Additionally, 24 patients showed T1 hypointensity signal at LMC while 44 patients showed T2 hyperintensity signal. Particularly, 42 patients received imaging assessment both before and after surgery (6 months) along with JOA gradings. For the control group, 14 males and 6 females were included with an average age of 57 (range 50-65 yrs) years.
Image acquisition
The scans were performed on a Philips 3.0T Ingenia MRI scanner (Philips, Best, The Netherlands) with a 16-channel Head/Neck coil. Sagittal and axial T2W TSE images were acquired as structural imaging. Diffusion data were acquired using an MS-EPI sequence on the axial view. Seventeen slices were scanned with a spatial coverage from C2 to C7. Detailed imaging parameters: FOV=180×180 mm2, resolution=1.0×1.0×4 mm3, 6 shots, NSA=1, b=0/ 1000 s/mm2, 15 diffusion directions, TE/TR=95.51/3763 ms. The total scan time was around 6 minutes.
Image processing and ROI analysis
The DTI images were processed in the Spinal Cord Toolbox (SCT)[15] including automatic segmentation, motion-correction, and registration to labeled PAM50 templates for the subsequent automatic ROI analysis. Aatlas-based analysis was performed after the extraction of DTI metrics. Here the following ROIs (using default labels in SCT) were selected for statistical analysis: the whole spinal cord (SC), whole white matter (WM), dorsal columns (DC), lateral funiculi (LF), ventral funiculi (VF) and whole gray matter (GM).
Statistical Analysis
An unpaired, double-tailed student t-test was used to assess the statistical significance difference in DTI metrics between the age-matched control group and patients. Measured DTI metrics at non-compressed C2 level were involved and analyzed. Additionally, correlations between each metric at C2 and JOA scores in multiple ROIs were assessed using the Spearman rank correlation coefficient. Two-tailed p<0.05 were considered significant.
Results
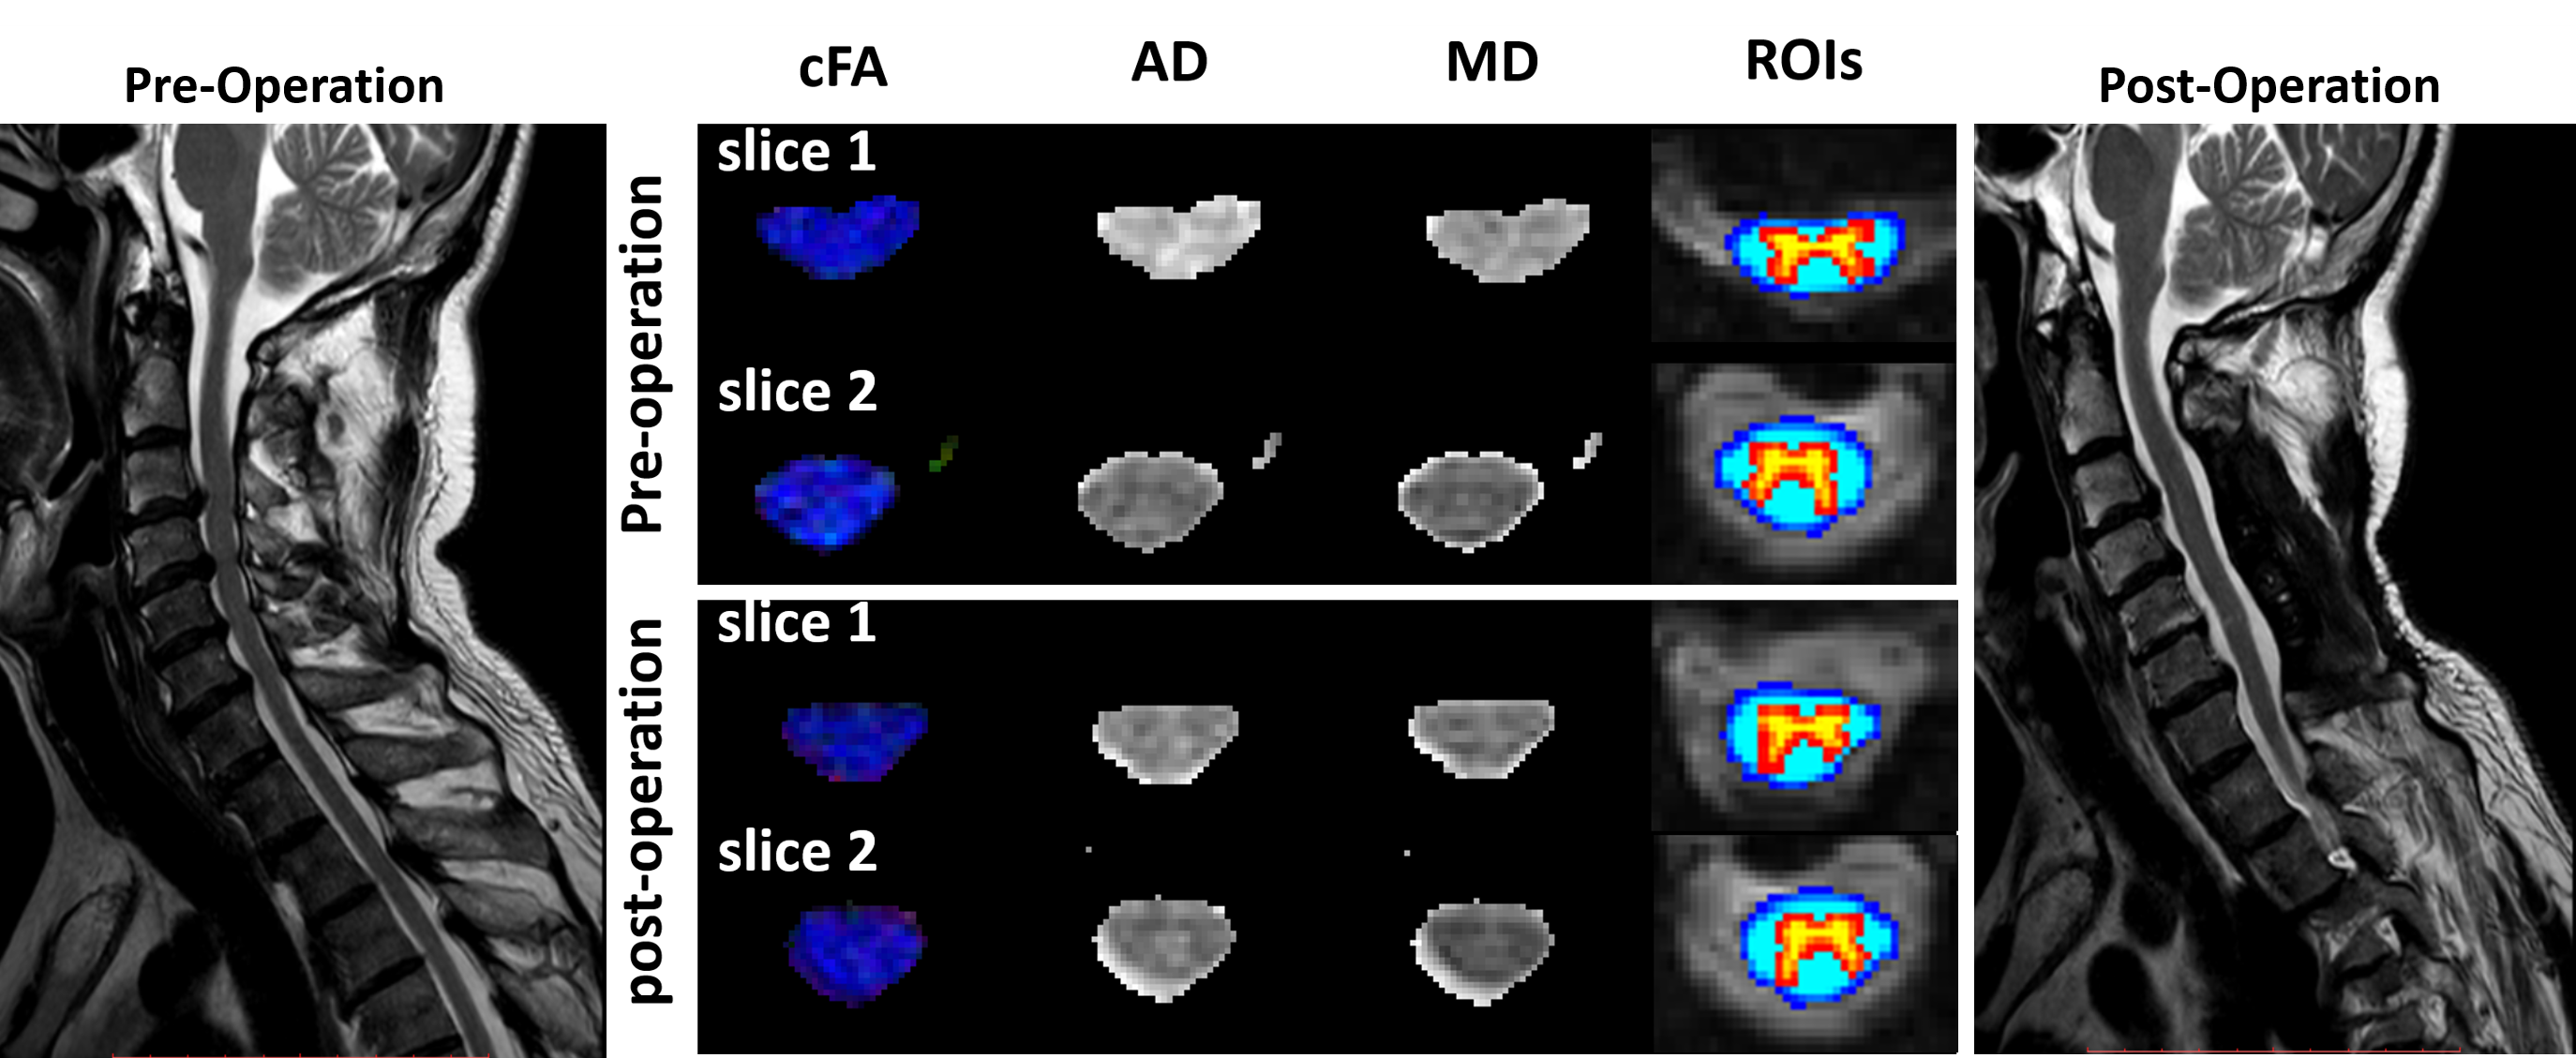
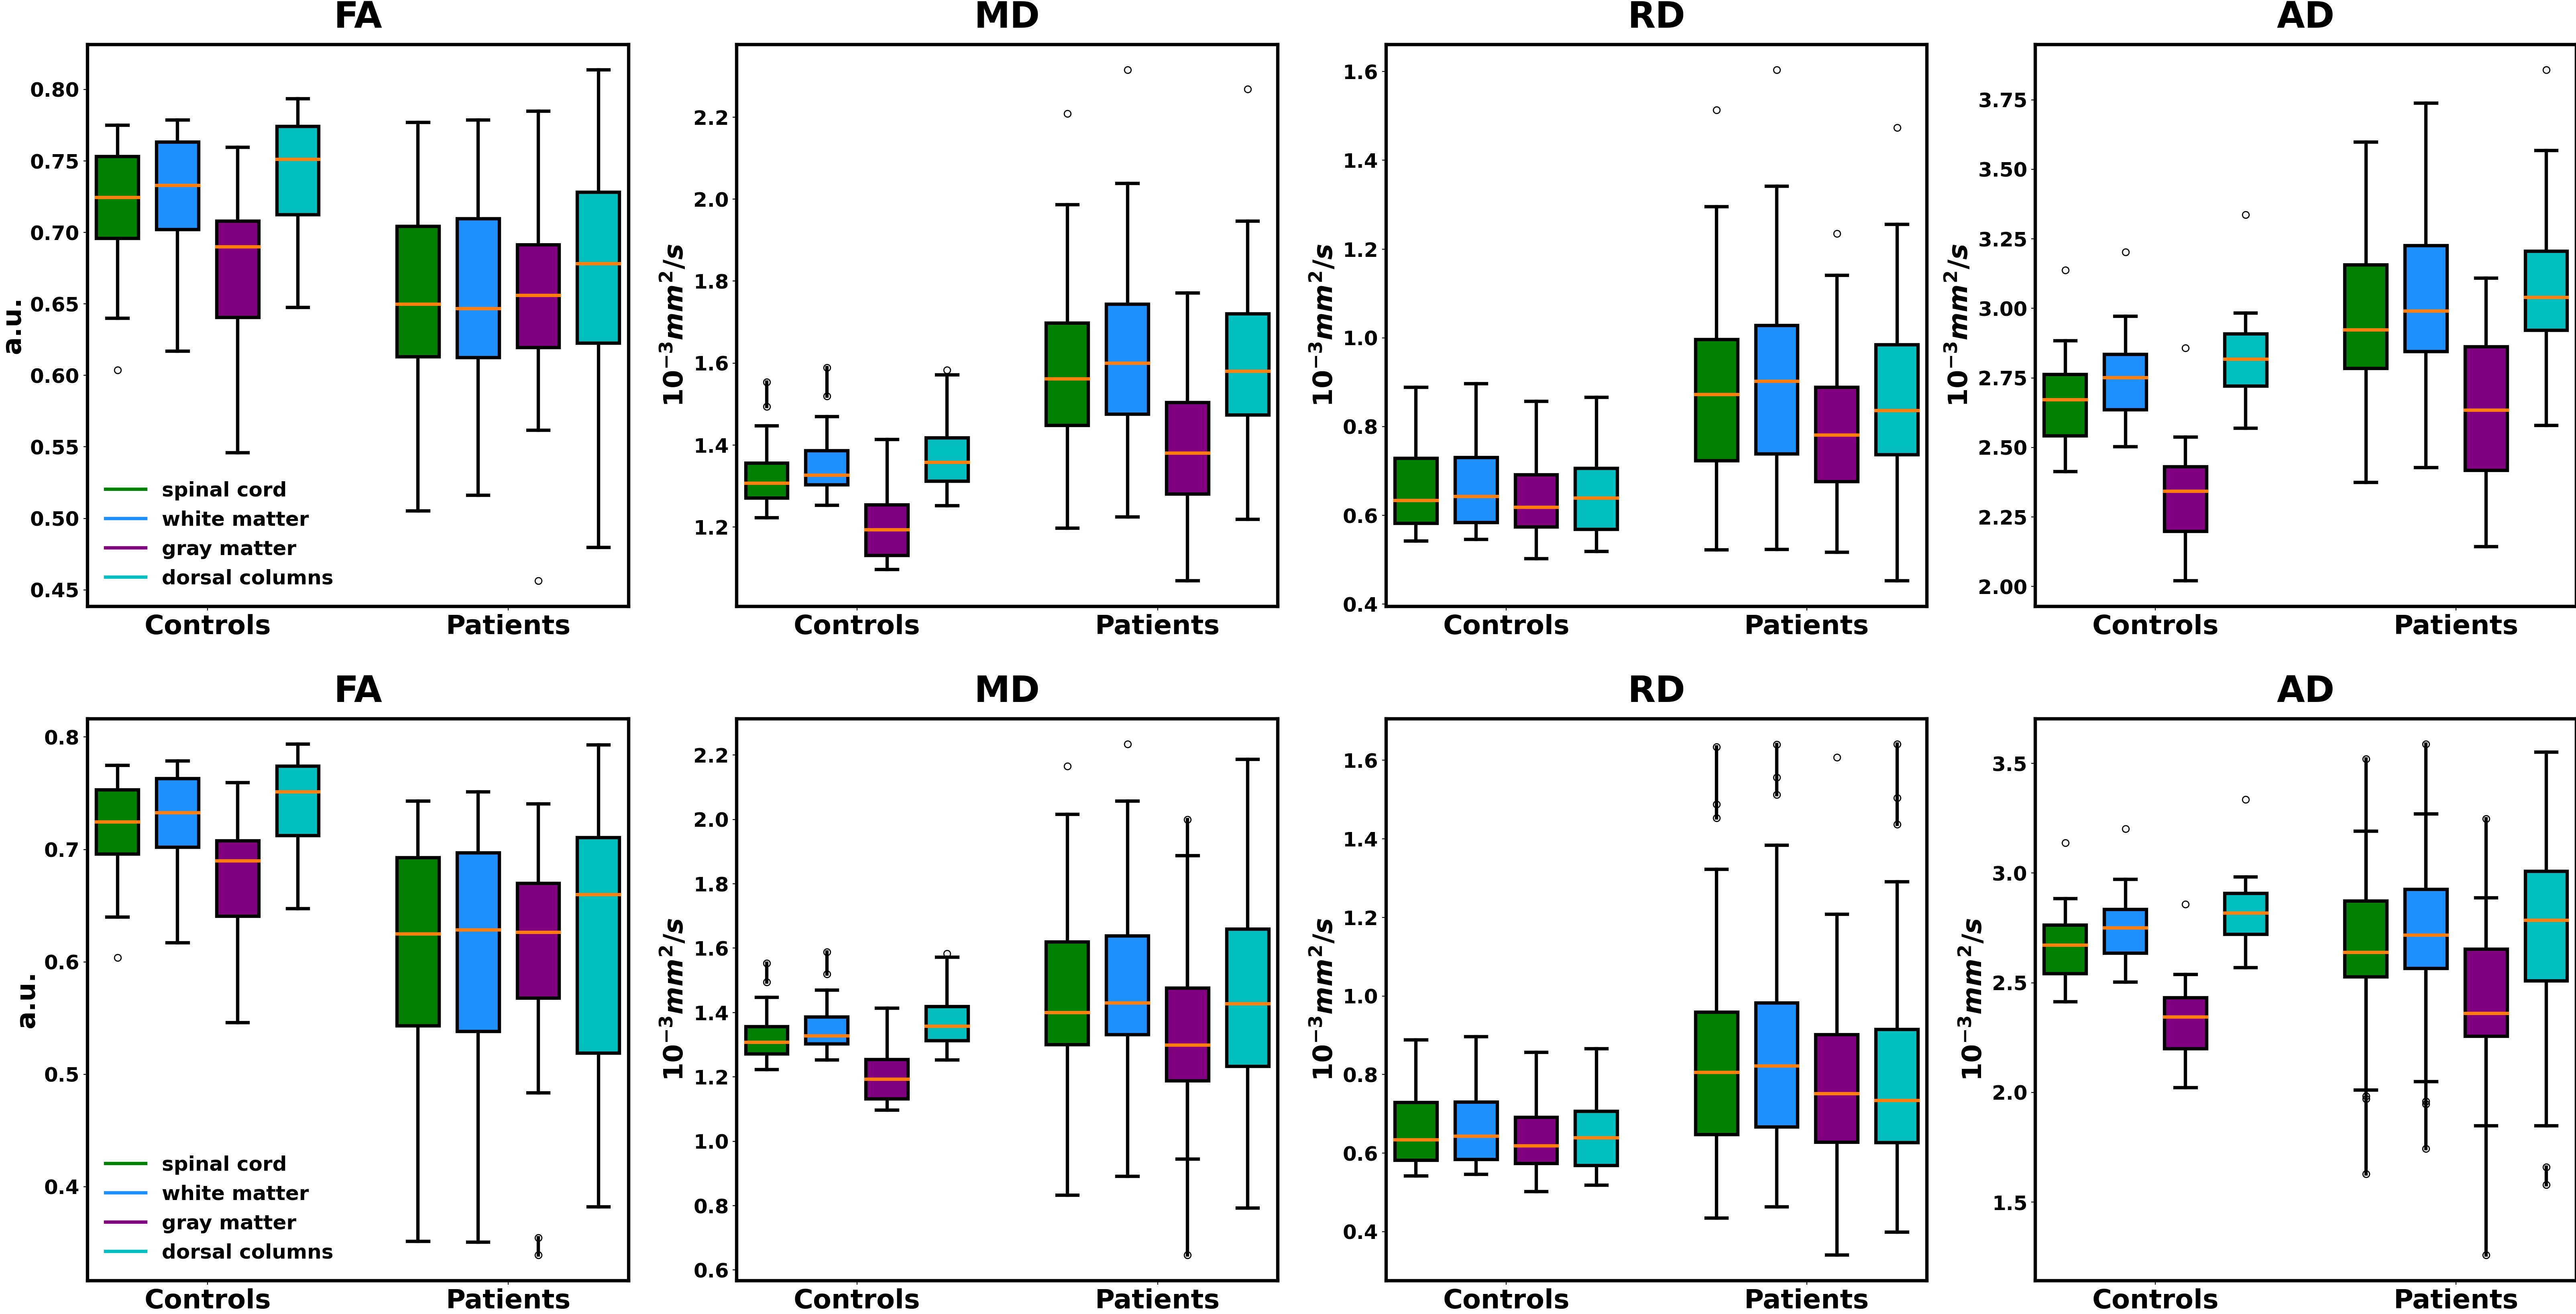
Pre-and post-surgery DTI metrics from one patient with positive surgical outcome (JOA recovery rate=100%) are shown in Figure 1. Particularly, slice No.2 represents a vertebral level without visible compression while slice No.1 represents a compressed level before surgery. The measured quantitative maps indicate that there is a tendency of decreasing FA and increasing diffusivity values at compressed levels.Figure 2 compared the pre-and post-surgery DTI metrics at C2 between patients and controls. Significant differences are observed in the whole spinal cord, WM, GM, and DC (p<0.001).
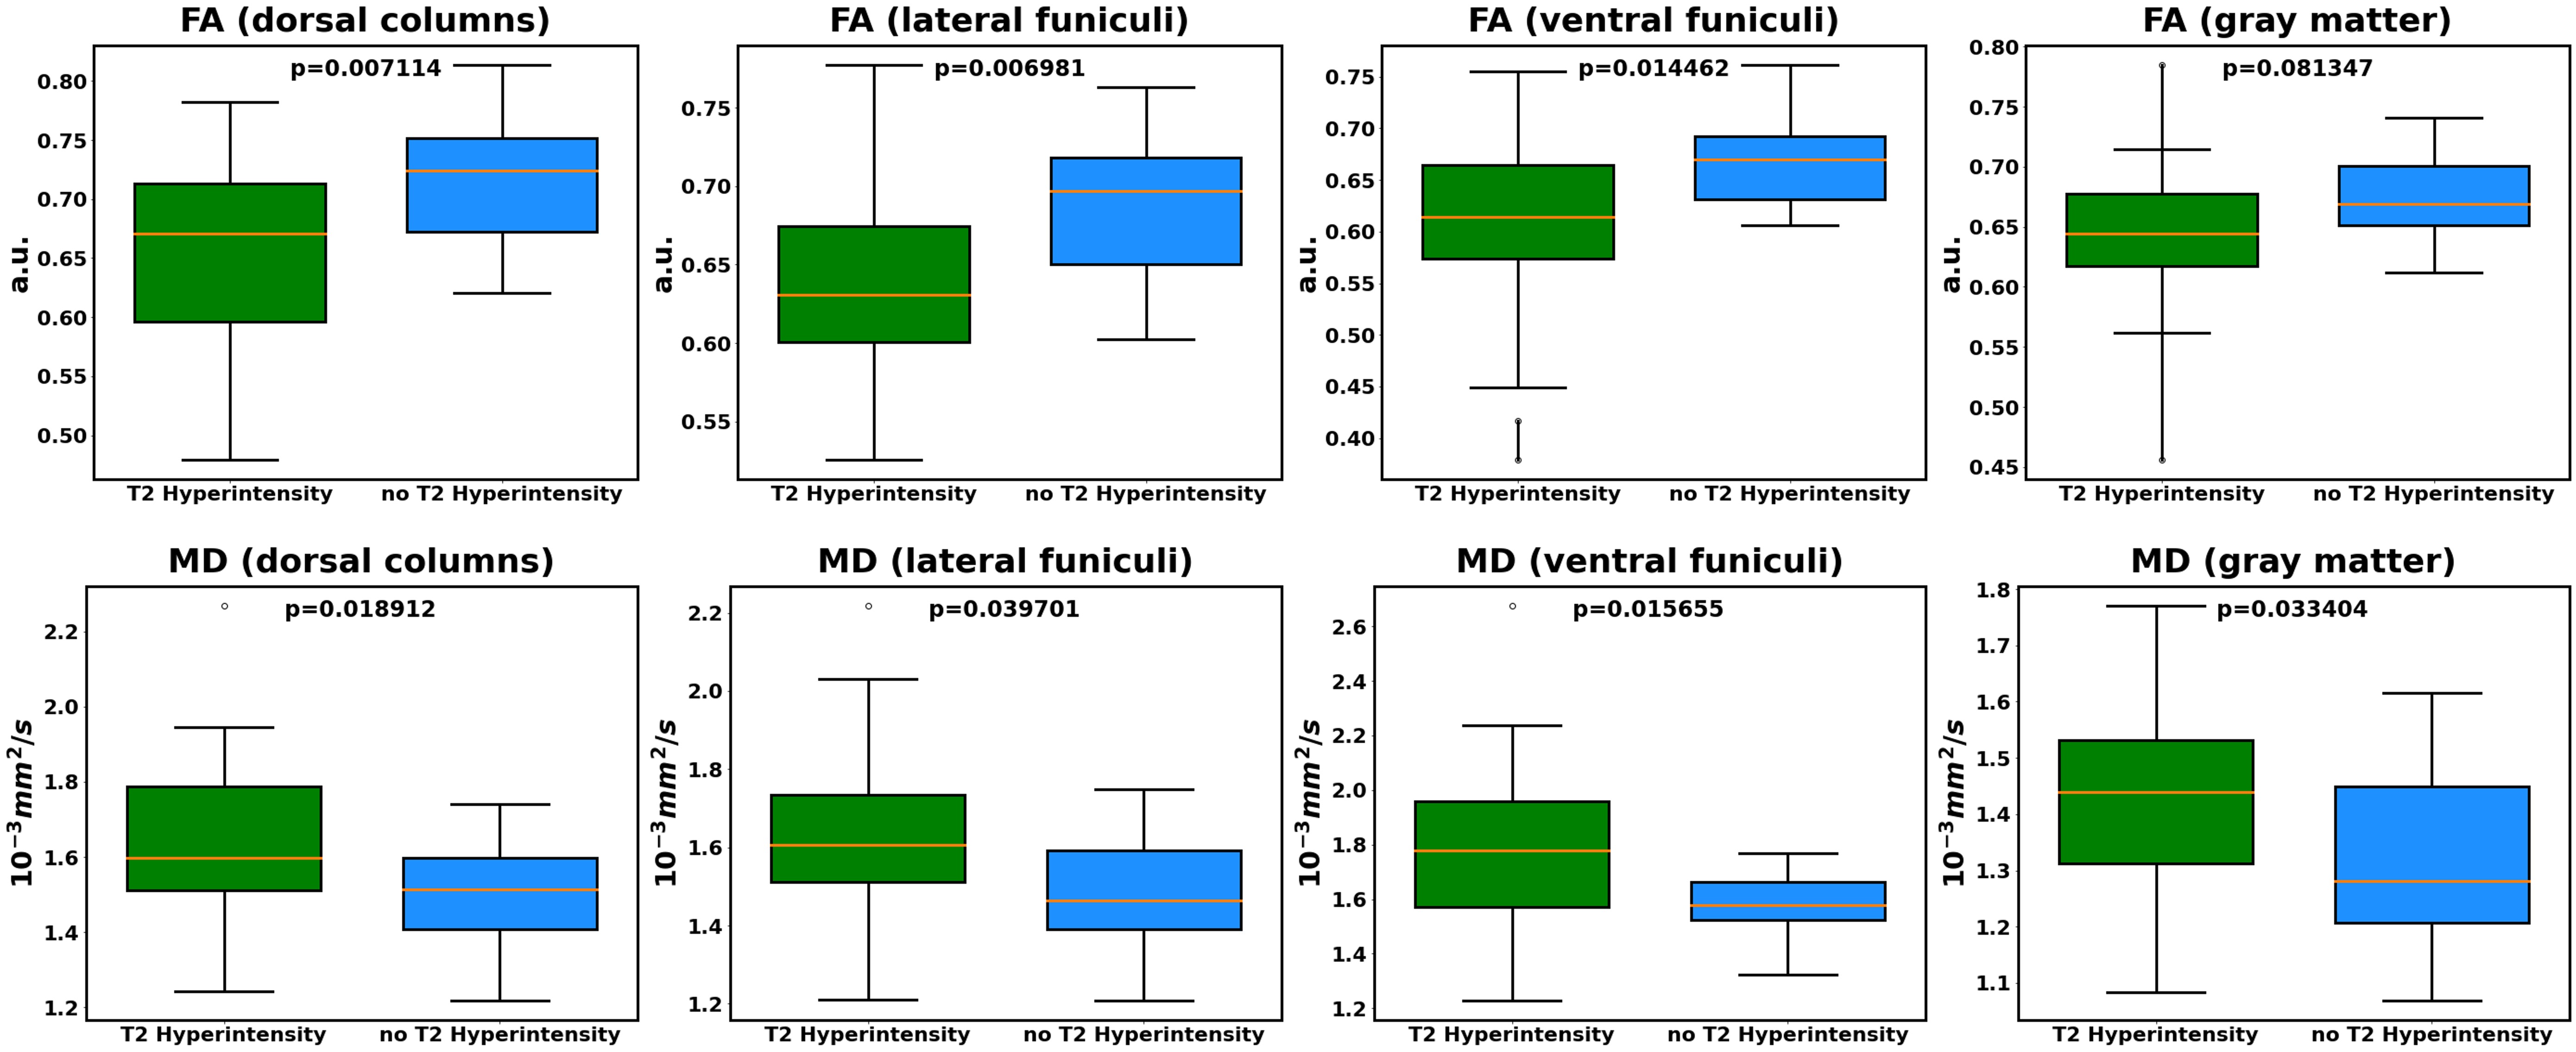
Figure 3 demonstrates the comparison of DTI metrics at C2 between T2 hyperintensity subgroup and no T2 hyperintensity subgroup. Significant differences were found in most comparisons (p<0.001).
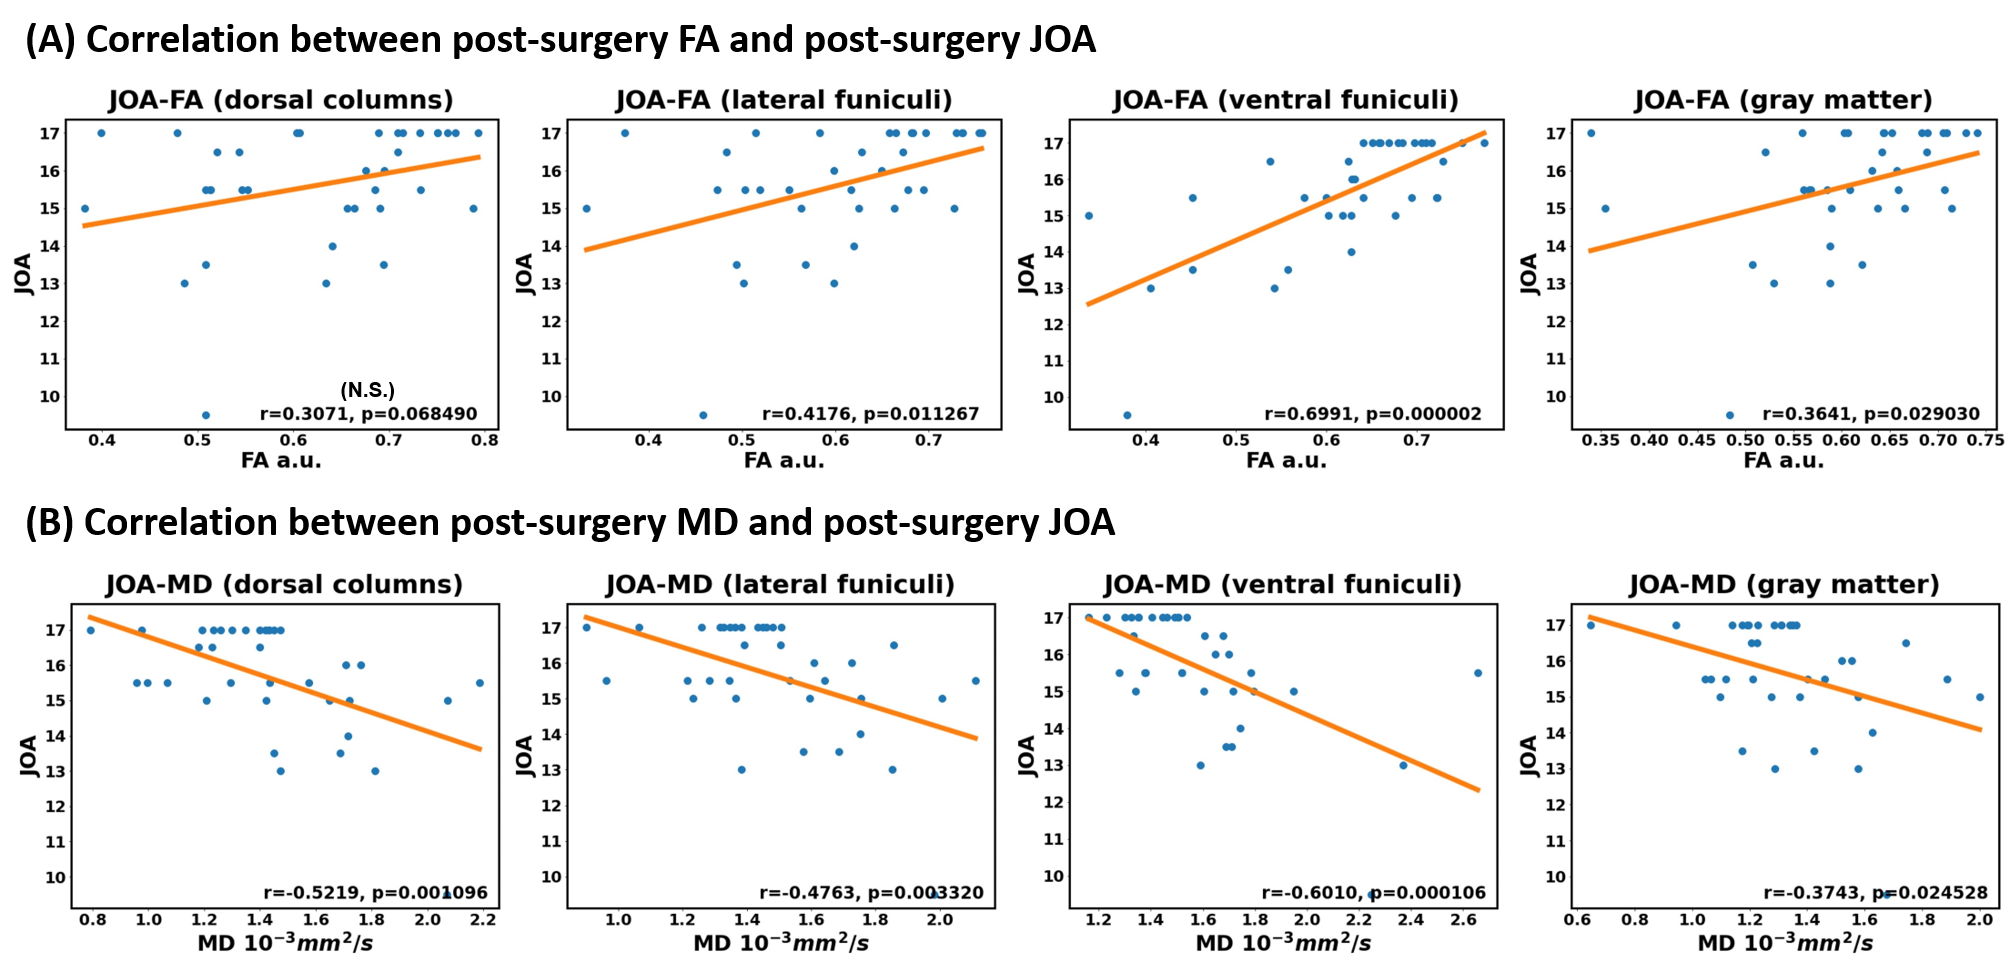
Figure 4 shows the correlation between post-surgery DTI metrics at C2 and post-surgery JOA. As is shown, FA and MD are moderately correlated with JOA in LF, VF, and GM. Particularly, the correlation in VF is stronger than that in other ROIs, which is consistent with the [16].
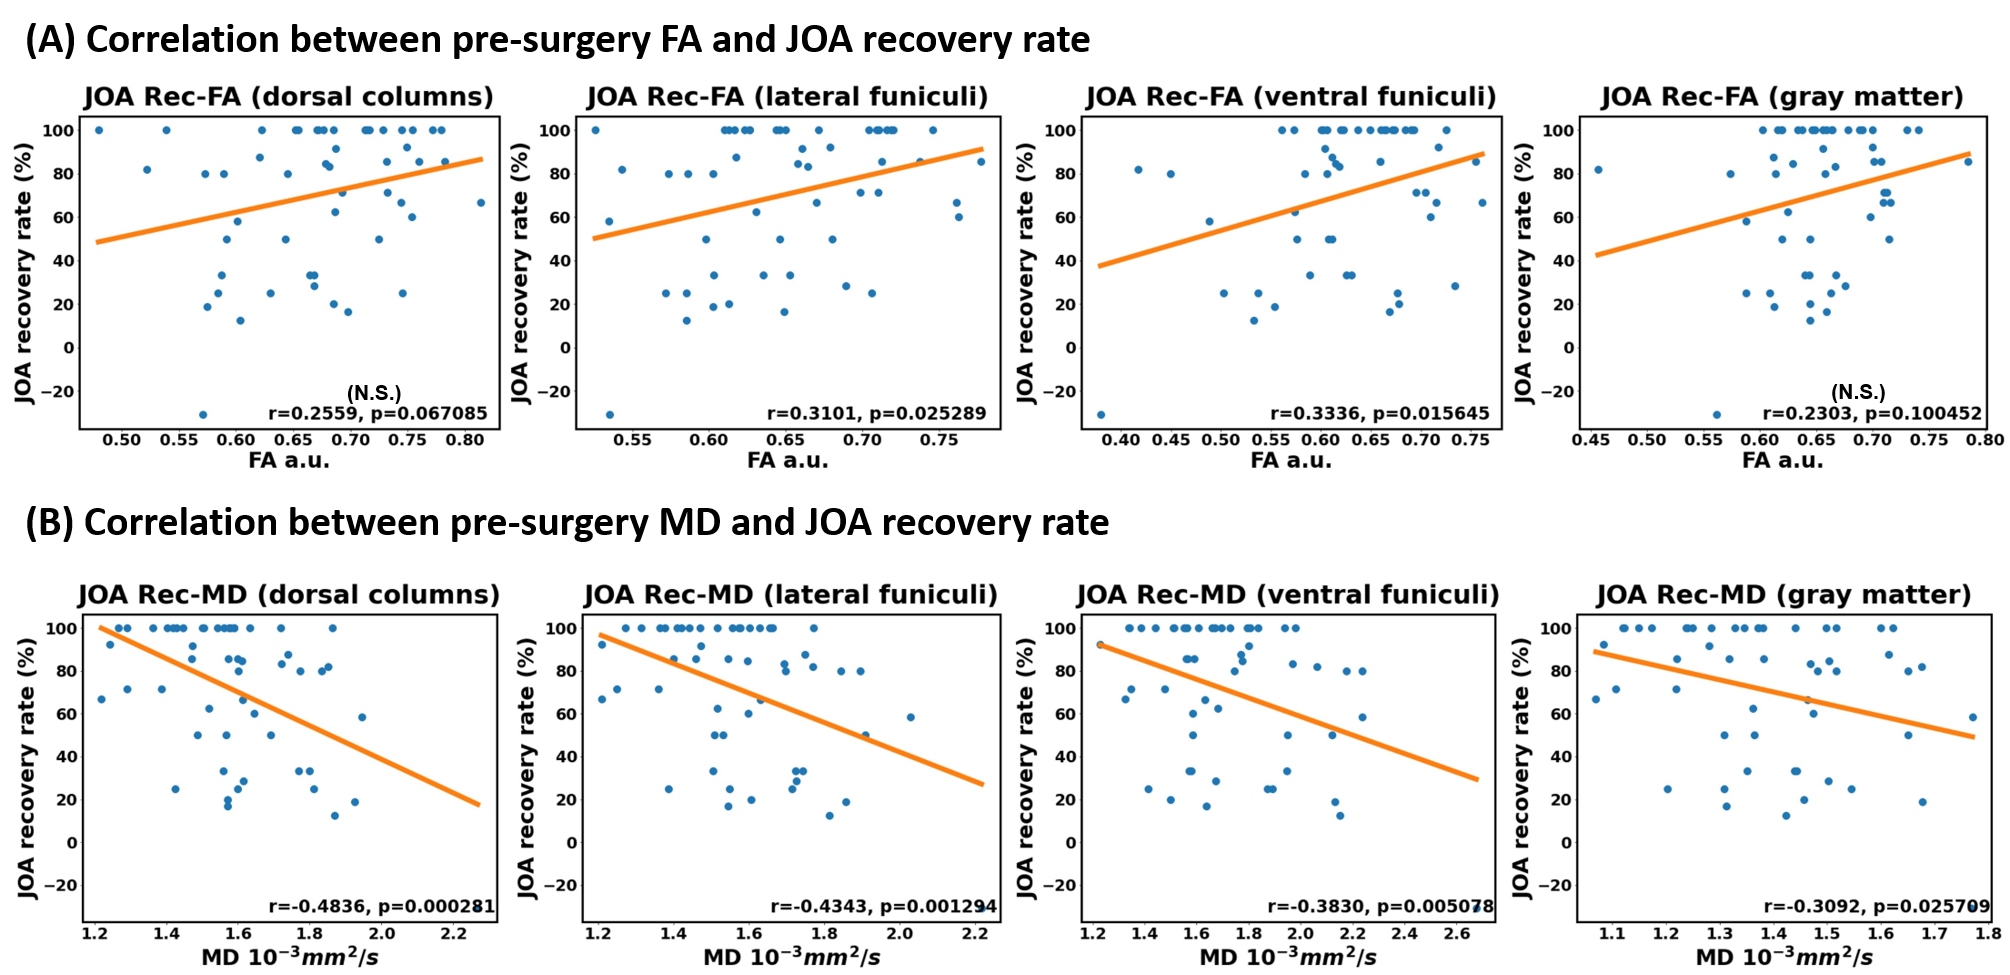
Figure 5 shows the correlation between pre-surgery DTI metrics at C2 and JOA recovery rate (JOA Rec) (defined in [17]). As is shown, FA is mildly correlated with JOA Rec in LF and VF while MD is correlated with JOA Rec in all tested ROIs. However, the general correlation is not that strong with that in Figure 4.
Discussion and Conclusion
This study indicated the potential prognostic value of DTI metrics at non-compressed C2 level in particular WM and GM tracts for DCM, such as VF and LF.Acknowledgements
We would like to appreciate the help from Dr. Julien Cohen-Adad.References
1. Tetreault L, Goldstein CL, Arnold P, Harrop J, Fehlings MG. Degenerative Cervical Myelopathy: A Spectrum of Related Disorders Affecting the Aging Spine. Neurosurgery 2015;77 Suppl 4(4):S51.
2. Okais N, Moussa R, Hage P. Value of increased MRI signal intensity in cervical arthrosis in myelopathies. Neuro-Chirurgie 1997;43(5):285.
3. Muhle C, Metzner J, Weinert DM, Falliner A, Resnick D. Classification system based on kinematic MR imaging in cervical spondylitic myelopathy. Ajnr Am J Neuroradiol 1998;19(9):1763-1771.
4. Matsumoto M, Toyama Y, Ishikawa M, Chiba K, Suzuki N, Fujimura Y. Increased signal intensity of the spinal cord on magnetic resonance images in cervical compressive myelopathy. Does it predict the outcome of conservative treatment? Spine 2000;25(6):677-682.
5. Takahashi M, Yamashita Y, Sakamoto Y, Kojima R. Chronic cervical cord compression: clinical significance of increased signal intensity on MR images. Radiology 1989;173(1):219-224.
6. Ayhan, Demir, Mario, et al. Diffusion-weighted MR imaging with apparent diffusion coefficient and apparent diffusion tensor maps in cervical spondylotic myelopathy. Radiology 2003.
7. Karpova A, Arun R, Kalsi-Ryan S, Massicotte EM, Kopjar B, Fehlings MG. Do quantitative magnetic resonance imaging parameters correlate with the clinical presentation and functional outcomes after surgery in cervical spondylotic myelopathy? A prospective multicenter study. Spine 2014;39(18):1488.
8. Rajasekaran S, Yerramshetty JS, Chittode VS, Kanna RM, Balamurali G, Shetty AP. The Assessment of Neuronal Status in Normal and Cervical Spondylotic Myelopathy Using Diffusion Tensor Imaging. Spine 2014;39(15):1183-1189.
9. Ma X, Han X, Jiang W, et al. A Follow-up Study of Postoperative DCM Patients Using Diffusion MRI with DTI and NODDI. Spine 2018:1.
10. Chun, Yi, Wen, et al. Is diffusion anisotropy a biomarker for disease severity and surgical prognosis of cervical spondylotic myelopathy? Radiology 2014.
11. Yonenobu K, Abumi K, Nagata K, Taketomi E, Ueyama K. Interobserver and intraobserver reliability of the japanese orthopaedic association scoring system for evaluation of cervical compression myelopathy. Spine 2001;26(17):1890-1894.
12. Hirabayashi K, Miyakawa J, Satomi K, Maruyama T, Wakano K. Operative Results and Postoperative Progression of Ossification Among Patients With Ossification of Cervical Posterior Longitudinal Ligament. Spine 1981;6.
13. Chan TY, Li X, Mak KC, Cheung PY, Luk DK, Hu Y. Normal values of cervical spinal cord diffusion tensor in young and middle-aged healthy Chinese. European spine journal : official publication of the European Spine Society, the European Spinal Deformity Society, and the European Section of the Cervical Spine Research Society 2015;24(12):2991-2998.
14. Xu J, Shimony JS, Klawiter EC, et al. Improved in vivo diffusion tensor imaging of human cervical spinal cord. Neuroimage 2013.
15. De Leener B, Lévy S, Dupont SM, et al. SCT: Spinal Cord Toolbox, an open-source software for processing spinal cord MRI data. Neuroimage 2017;145:24-43.
16. Wang K, Chen Z, Zhang F, Song Q, Shen H. Evaluation of DTI Parameter Ratios and Diffusion Tensor Tractography Grading in the Diagnosis and Prognosis Prediction of Cervical Spondylotic Myelopathy. Spine 2017;42(4):1.
17. Hirabayashi K, Miyakawa J, Satomi K, Maruyama T, Wakano K. Operative results and postoperative progression of ossification among patients with ossification of cervical posterior longitudinal ligament. Spine 1981;6(4):354-364.
Figures