2057
Clinical correlations of DTI and volumetric metrics in people with multiple sclerosis
Abdulaziz Alshehri1,2, Oun Al-iedani1,2, Jameen Arm1,2, Neda Gholizadeh1, Thibo Billiet3, Rodney Lea2, Jeannette Lechner-Scott1,2,4, and Saadallah Ramadan1,2
1University of Newcastle, Newcastle, Australia, 2Hunter Medical Research Institute, Newcastle, Australia, 3Icometrix, Leuven, Australia, 4John Hunter Hospital, Newcastle, Australia
1University of Newcastle, Newcastle, Australia, 2Hunter Medical Research Institute, Newcastle, Australia, 3Icometrix, Leuven, Australia, 4John Hunter Hospital, Newcastle, Australia
Synopsis
This study is to evaluate DTI parameters in RRMS patients with age and sex-matched HCs, and to correlate these DTI metrics values in total-brain white matter (TBWM) and white matter lesion (WML) in comparison to white matter-related volumetric measures with clinical symptoms showing the differentiation and significant P-values. DTI parameters showed a stronger correlation with clinical parameters than white matter-related volumetric measurements in RRMS. Importantly, more DTI parameters (16 metrics) with stronger clinical correlations were obtained than volume measurements (5 metrics).
Introduction
MRI is the most common technique to monitor MS patients, but T2 FLAIR intensities only poorly explain some of the clinical symptoms observed 1, 2. Advanced MRI imaging techniques, such as diffusion tensor imaging (DTI) could potentially be used to describe some of the deficits by studying water diffusion in disrupted tracts with parameters like fractional anisotropy (FA) and mean, axial and radial diffusivities (MD, AD, RD)3, 4. This quantitative method (DTI) allows the evaluation of microstructural integrity of myelin sheath of brain white matter 5. The volume of white matter in the brain is one of the most effective predictors of future disability 6. This study is to evaluate DTI parameters in relapsing-remitting MS (RRMS) patients with age and sex-matched healthy controls (HCs), and to correlate these DTI metrics values in total-brain white matter (TBWM) and white matter lesion (WML) in comparison to white matter-related volumetric measures with clinical symptoms showing the differentiation and significant P-values.Methods
This observational open-label study involved 37 RRMS patients aged between 20 to 55 years and 19 age and sex-matched HC participants (Table 1). All MRI were undertaken on a 3 Tesla MRI scanner (Prisma, Siemens Healthcare, Germany) equipped with a 64-channel head and neck coil. A 3D T1 MP-RAGE was used for anatomical reference, and a T2-FLAIR sequence was acquired for assessment of lesion load. The DTI protocol consisted of an echo-planar imaging sequence with 70 axial slices with diffusion weighting b=3000 s/mm2 acquired along 64 non-collinear gradient directions and 3 diffusion-free (b=0) image volumes with a reversed-phase encoding direction (PA and AP). The diffusion data were processed as described elsewhere 7. Then, DWI datasets were co-registered to the respective T1 datasets to be able to use segmentations from the T1 image (Figure 1). The DTI tensors were estimated, and FA, MD, RD, and AD were calculated. All resulting images were then analysed using whole-brain analysis. T-tests were evaluated to investigate the significant difference between MS and HCs groups. A one-way ANOVA was conducted to verify the effect of the group with covariates age and sex. Pearson’s correlations were used for DTI metrics, volume measures and clinical correlations. All whole-brain statistics were conducted in SPSS.Results
Compared to HC, a statistically significant increase in MD (+3.6%), RD (+4.8%), AD (+2.7%) and a decrease in FA (-4.3%) for TBWM in RRMS patients were observed (p<0.01), with larger changes in WML (Table 2). FA in TBWM correlated positively with attention, fluency, memory and tARCS. MD and RD in WML and AD in TBWM correlated moderately with EDSS (Table 3 and Figure 2). Volumetric segmentation indicated a decrease in the total brain volume (TBV), GM and WM (-5%) with a reciprocal increase in CSF (+26%) in RRMS. Importantly, DTI parameters showed a stronger correlation with clinical parameters than white matter-related volumetric measurements in RRMS. For HC, a greater number of strong correlations can be observed between DTI metrics and clinical parameters, where no evidence of correlations between white matter-related volumetric data and clinical parameters (p>0.05) was detected. Importantly, more DTI parameters (16 metrics) with stronger clinical correlations were obtained than volume measurements (5 metrics) (Table 3).Discussion
In this study, we found the DTI metrics are more sensitive to microstructural changes in TBWM as well as WML. The major findings of this study demonstrate that there is marked reduction of FA values in TBWM and significantly increased of MD, AD and RD values in RRMS. As expected, DTI metrics showed a similar trend with larger and more statistically significant group differences in WML relative to HCs. In line with other studies, we also observed higher diffusivities and lower FA in WML than in TBWM which may represent variable degrees of destruction and microstructural changes that may reflect various disease processes in MS patients such as neurodegeneration, axonal loss and gliosis 8, 9. Although we found a reduction in FA values in TBWM which is non-specific for demyelination, it can be assumed that the increase in MD and RD, which may represent variable degrees of disease activity, could be driven by the low FA values 10, 11. Moreover, we found a moderate correlation between RDTBWM, MDTBWM, ADWML and EDSS but not with FA which is likely not severely affected in the early phase of the disease and has a lack of specificity with disease processes 12, 13. Cognitive decline is one of the important clinical features of disease progression in MS 14. We found a positive correlation between FA and tARCS in RRMS. Among other cognitive domains, poor memory and information processing speed are the two common deficits observed in MS patients. We noted a moderate negative correlation between memory and RDTBWM, MDTBWM, while FA correlated positively with memory in RRMS.Conclusion
Quantitative DTI parameters not only differentiate between RRMS patients and HCs, but are also correlated with disability and mental health of RRMS patients. The overall results in our study suggest that DTI is a sensitive tool in the evaluation of subtle and inconspicuous disease processes within the total brain white matter that is otherwise undetectable with structural MRI.Acknowledgements
Funding for this study provided by Novartis Pharmaceuticals Australia. The authors thank the patients and controls who participated in this study and the Imaging Centre of the University of Newcastle and Hunter Medical Research Institute.References
1. Lubetzki, C., et al., Demyelination in multiple sclerosis, in Handbook of clinical neurology. 2014, Elsevier. p. 89-99. 2. Neema, M., et al. (2007),'MRI in multiple sclerosis: what’s inside the toolbox?', Neurotherapeutics. Vol., (4): p. 602-617. 3. Curran, K.M., et al., Quantitative DTI measures, in Diffusion Tensor Imaging. 2016, Springer. p. 65-87. 4. Nucifora, P.G., et al. (2007),'Diffusion-tensor MR imaging and tractography: exploring brain microstructure and connectivity', Radiology. Vol., (2): p. 367-384. 5. Klotz, L., et al. (2019),'Risks and risk management in modern multiple sclerosis immunotherapeutic treatment', Therapeutic Advances in Neurological Disorders. Vol.: p. 1756286419836571. 6. Filippi, M., et al. (2016),'MRI criteria for the diagnosis of multiple sclerosis: MAGNIMS consensus guidelines', Lancet Neurol. Vol., (3): p. 292-303. 7. Soares, J., et al. (2013),'A hitchhiker's guide to diffusion tensor imaging', Frontiers in neuroscience. Vol.: p. 31. 8. Hagiwara, A., et al. (2019),'White Matter Abnormalities in Multiple Sclerosis Evaluated by Quantitative Synthetic MRI, Diffusion Tensor Imaging, and Neurite Orientation Dispersion and Density Imaging', American Journal of Neuroradiology. Vol. 9. Guo, A.C., et al. (2002),'Multiple Sclerosis: Diffusion Tensor MR Imaging for Evaluation of Normal-appearing White Matter', Radiology. Vol., (3): p. 729-736. 10. Werring, D.J., et al. (1999),'Diffusion tensor imaging of lesions and normal-appearing white matter in multiple sclerosis', Neurology. Vol., (8): p. 1626-1626. 11. Filippi, M., et al. (2000),'A quantitative study of water diffusion in multiple sclerosis lesions and normal-appearing white matter using echo-planar imaging', Arch Neurol. Vol., (7): p. 1017-21. 12. Sbardella, E., et al. (2013),'DTI Measurements in Multiple Sclerosis: Evaluation of Brain Damage and Clinical Implications', Multiple Sclerosis International. Vol.: p. 11. 13. Tóth, E., et al. (2018),'The contribution of various MRI parameters to clinical and cognitive disability in multiple sclerosis', Frontiers in neurology. Vol.: p. 1172. 14. Ferreira, M.L.B. (2010),'Cognitive deficits in multiple sclerosis: a systematic review', Arquivos de neuro-psiquiatria. Vol., (4): p. 632-641.Figures
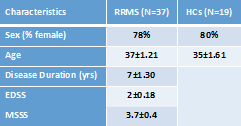
Table 1. Demographic and some clinical parameters of
study cohorts of RRMS and HCs groups.
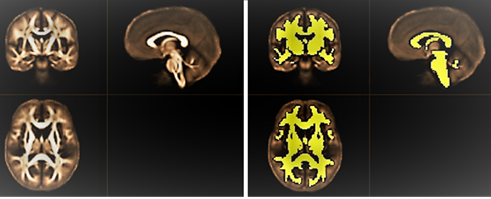
Figure
1. Left: Population-specific FA-template for the group under study. Right:
white matter mask overlaid on mean FA map.
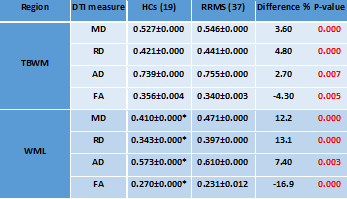
Table 2. Mean values of DTI parameters for the TBWM and WML
segmentation for RRMS patients compared to HCs showing the differences and
significant P-values. MD, RD and AD are in 10-3 mm2/s,
except FA which is unit-less. * WML metric values in HCs were computed by
co-registration of WML mask from MS onto HC T2-FLAIR.
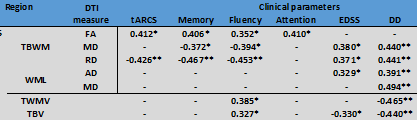
Table 3. Pearson’s correlation between DTI metrics and
selected volumetrics with clinical parameters in RRMS. Only statistically
significant correlations are listed. *p-value
≤ 0.05, **p-value ≤ 0.01.
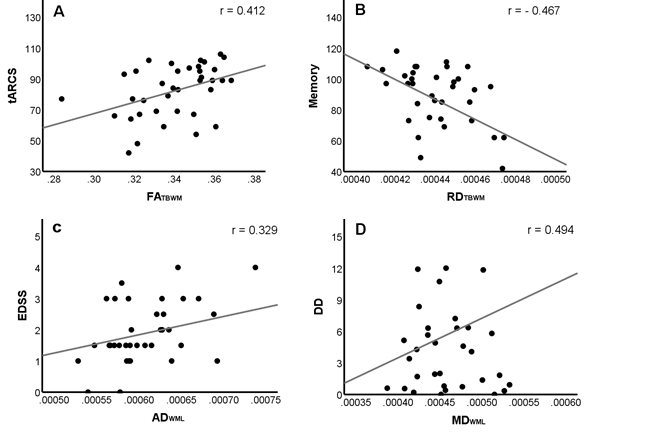
Figure 2. Scatter
plots showing some significant correlations: A) FATBWM with tARCS
(r=0.412), B) RDTBWM with Memory (r=-0.467), C) ADWML
with EDSS (r=0.329) and D) MDWML with DD (r=0.494).