2056
Altered Functional Connection and Neuroinflammation in Fibromyalgia Using Independent Component Analysis and Diffusion Kurtosis MRI
JIA-WEI Liang1, Tang-Jun Li2, Yao-Wen Liang3, Ting-Chun Lin3, Yi-Chen Lin3, Jiunn-Horng Kang2,4, You-Yin Chen3,5, and Yu-Chun Lo5
1Department of Biomedical Optoelectronic, Taipei Medical University, Taipei, Taiwan, 2College of Medicine, Taipei Medical University, Taipei, Taiwan, 3Department of Biomedical Engineering, National Yang Ming University, Taipei, Taiwan, 4Department of Physical Medicine & Rehabilitation, Taipei Medical University, Taipei, Taiwan, 5Ph.D. Program for Neural Regenerative Medicine, Taipei Medical University, Taipei, Taiwan
1Department of Biomedical Optoelectronic, Taipei Medical University, Taipei, Taiwan, 2College of Medicine, Taipei Medical University, Taipei, Taiwan, 3Department of Biomedical Engineering, National Yang Ming University, Taipei, Taiwan, 4Department of Physical Medicine & Rehabilitation, Taipei Medical University, Taipei, Taiwan, 5Ph.D. Program for Neural Regenerative Medicine, Taipei Medical University, Taipei, Taiwan
Synopsis
Recently, neuroinflammation was proposed as an important role in fibromyalgia. However, the correlation between neuroinflammation and functional connection in fibromyalgia patients remained unclear. Fibromyalgia patients and healthy control participants were recruited to investigate the mechanism of fibromyalgia. Independent component analysis, diffusion kurtosis MRI and cortical thickness estimation were applied in this study. The finding implied that neuroinflammation and structural change of brain were associated with the abnormal functional connection in fibromyalgia.
Introduction
Fibromyalgia (FM) is the cause of pain disorders in the central nervous system. Most patients will experience headaches, chronic fatigue, hospitalization, and other local pain syndromes1. There were several brain circuits have been proposed to affect the FM patients specially the pain-related circuits2-4. Previous studies have shown that neuroinflammation was often observed in FM patients, which the pro-inflammatory peptides were released from the peripheral nerve endings of C fiber and caused neuroinflammation5, 6. Additionally, there were increasing evidences indicated that neuroinflammation was accompanied by structural changes and caused brain function alternation5, 7-9. Therefore, researchers investigated the cortical thickness and white matter integrity alternation in FM patients, and the result showed significant difference in insula and corpus callosum3, 10. However, the correlation among neuroinflammation, functional connection and structural change were still unclear. In this study, we applied independent component analysis (ICA), a data-driven method, to analyze the resting-state fMRI (rs-fMRI) data. T1-weighted images and diffusion kurtosis MRI were used to estimate cortical thickness and status of neuroinflammation in FM, respectively. We hypothesize that changes in structural connections caused by neuroinflammation are related to abnormal functional connections in FMMethods
Twenty-two patients with FM (1 male and 21 females; mean age: 50.2 ± 10.6 years old) and twenty-one healthy controls (HC) (2 males and 19 females; mean age: 54 ± 8.4 years old) were recruited in this study. Demographics of participants included sex, age, BMI and education status showed no significant difference between FM and HC. The patients of FM were recruited from the department of physical medicine and rehabilitation of Taipei Medical University Hospital. Whole brain images were acquired from a 3 Tesla Siemens MRI (Siemens MAGNETOM Prisma, Munich, Germany). T1-weighted imaging was acquired using a 3D magnetization-prepared rapid gradient echo sequence (TR / TE = 2,000 / 2.3 ms, FOV = 240 × 240 mm2, acquisition matrix = 256 × 256). Functional MRI (fMRI) were performed using echo-planner imaging (EPI) (TR / TE = 2,720 / 24 ms, FOV = 192 × 192 mm2, acquisition matrix = 64 × 64). Besides, diffusion kurtosis images (DKI) were acquired through the double-shot spin-echo EPI (TR / TE = 5,700 / 84 ms, FOV = 221.97 × 221.97 mm2, acquisition matrix = 82 × 82). FSL (FMRIB Software Library, https://fsl.fmrib.ox.ac.uk/fsl/fslwiki) was used for the preprocess the fMRI images, included skull stripping, motion correction and DKI was coregistered to the first acquired images on all diffusion weighted images for motion correction. And LPCA (Local principal component analysis) and eddy current correction were also conducted before image reconstruction. MELODIC ICA, program of FSL, was performed to extract the brain circuit maps, and dual regression was applied to compare the dominated clusters in FM patients and HC. To analyze the structure alternation, DKI data was analysis with in-house software using Matlab (Matlab 2020, The MathWorks Inc., Natick, MA, USA)11, and averaged MK was calculated by identified ROIs. Moreover, T1-weighted images were analyzed with FreeSurfer (https://surfer.nmr.mgh.harvard.edu) to estimate cortical thickness. Mann-Whitney U-test was performed to compare the difference between the HC and FM with the significant level set at p < 0.05 for DKI parameters and cortical thickness.Results
The default mode network (DMN), executive attention network (EAN) and antinociceptive network was identified after ICA (Figure 1a). The functional connectivity of FM patients was significantly higher than HC in all three identified brain circuits (Figure 1b). The neuroinflammation was evaluated by DKI program, the selected ROIs were show in Figure 2a-c. Average MK showed significant decrease in the regions of dorsolateral prefrontal cortex (DLPFC), corpus callosum, anterior corona radiata (ACR), fornix, insula, superior parietal lobule and rostral anterior cingulate cortex (rACC) (Figure 2d). FM patients presented decrease MK in the whole brain MK map (Figure 2e), suggested the microstructure changed in the FM patients. Furthermore, FM patients showed decrease of cortical thickness in ventral posterior cingulate cortex (PCC) and isthmus cingulate cortex, while the increase of cortical thickness was observed in rACC (Figure 3).Discussion
Abnormal functional connectivity in the DMN, EAN and antinociceptive networks was observed in the FM patients. These networks were considered as the main networks to modulate pain perception and descending control of pain12-14. Additionally, we found white matter integrity altered in DLPFC, corpus callosum, anterior corona radiata, fornix, insula, superior parietal lobule and rACC implying occurrence of neuroinflammation in FM15. Moreover, alternation of cortical thickness accompanied with decrease MK, which were associated with astrocytosis and microgliosis 16.Acknowledgements
This work is financially supported by Ministry of Science and Technology of Taiwan under Contract numbers of MOST 109-2221-E-010-004-MY2, 109-2314-B-303-016, and 108-2321-B-010-008-MY2. We also are grateful for support from the Higher Education Sprout Project of the National Chiao Tung University, Headquarters of University Advancement at the National Cheng Kung University.References
- Clauw, D.J., Fibromyalgia: a clinical review. Jama, 2014. 311(15): p. 1547-1555.
- Jensen, K.B., et al., Patients with fibromyalgia display less functional connectivity in the brain's pain inhibitory network. Molecular pain, 2012. 8: p. 1744-8069-8-32.
- Ichesco, E., et al., Altered resting state connectivity of the insular cortex in individuals with fibromyalgia. The Journal of Pain, 2014. 15(8): p. 815-826. e1.
- Uddin, L.Q., et al., Structure and function of the human insula. Journal of clinical neurophysiology: official publication of the American Electroencephalographic Society, 2017. 34(4): p. 300.
- Littlejohn, G., Neurogenic neuroinflammation in fibromyalgia and complex regional pain syndrome. Nature Reviews Rheumatology, 2015. 11(11): p. 639.
- Albrecht, D.S., et al., Brain glial activation in fibromyalgia–A multi-site positron emission tomography investigation. Brain, behavior, and immunity, 2019. 75: p. 72-83.
- Lutz, J., et al., White and gray matter abnormalities in the brain of patients with fibromyalgia: A diffusion‐tensor and volumetric imaging study. Arthritis & Rheumatism: Official Journal of the American College of Rheumatology, 2008. 58(12): p. 3960-3969.
- Yu, B., Microstructural abnormalities in gray matter of patients with postherpetic neuralgia: a diffusional kurtosis imaging study. Pain Physician, 2016. 19(4): p. E601-E611.
- Feraco, P., et al., Neurochemical Correlates of Brain Atrophy in Fibromyalgia Syndrome: A Magnetic Resonance Spectroscopy and Cortical Thickness Study. Brain Sciences, 2020. 10(6): p. 395.
- Kim, D.J., et al., Altered White matter integrity in the corpus callosum in fibromyalgia patients identified by tract‐based spatial statistical analysis. Arthritis & Rheumatology, 2014. 66(11): p. 3190-3199.
- Chiang, C.W., et al., Effects of signal averaging, gradient encoding scheme, and spatial resolution on diffusion kurtosis imaging: An empirical study using 7T MRI. Journal of Magnetic Resonance Imaging, 2019. 50(5): p. 1593-1603.
- Alshelh, Z., et al., Disruption of default mode network dynamics in acute and chronic pain states. Neuroimage Clin, 2018. 17: p. 222-231.
- Napadow, V., et al., Intrinsic brain connectivity in fibromyalgia is associated with chronic pain intensity. Arthritis & Rheumatism, 2010. 62(8): p. 2545-2555.
- Fenton, B.W., Limbic associated pelvic pain: a hypothesis to explain the diagnostic relationships and features of patients with chronic pelvic pain. Medical Hypotheses, 2007. 69(2): p. 282-286.
- Zhuo, J., et al., Diffusion kurtosis as an in vivo imaging marker for reactive astrogliosis in traumatic brain injury. Neuroimage, 2012. 59(1): p. 467-477.
- Guglielmetti, C., et al., Diffusion kurtosis imaging probes cortical alterations and white matter pathology following cuprizone induced demyelination and spontaneous remyelination. Neuroimage, 2016. 125: p. 363-377.
Figures
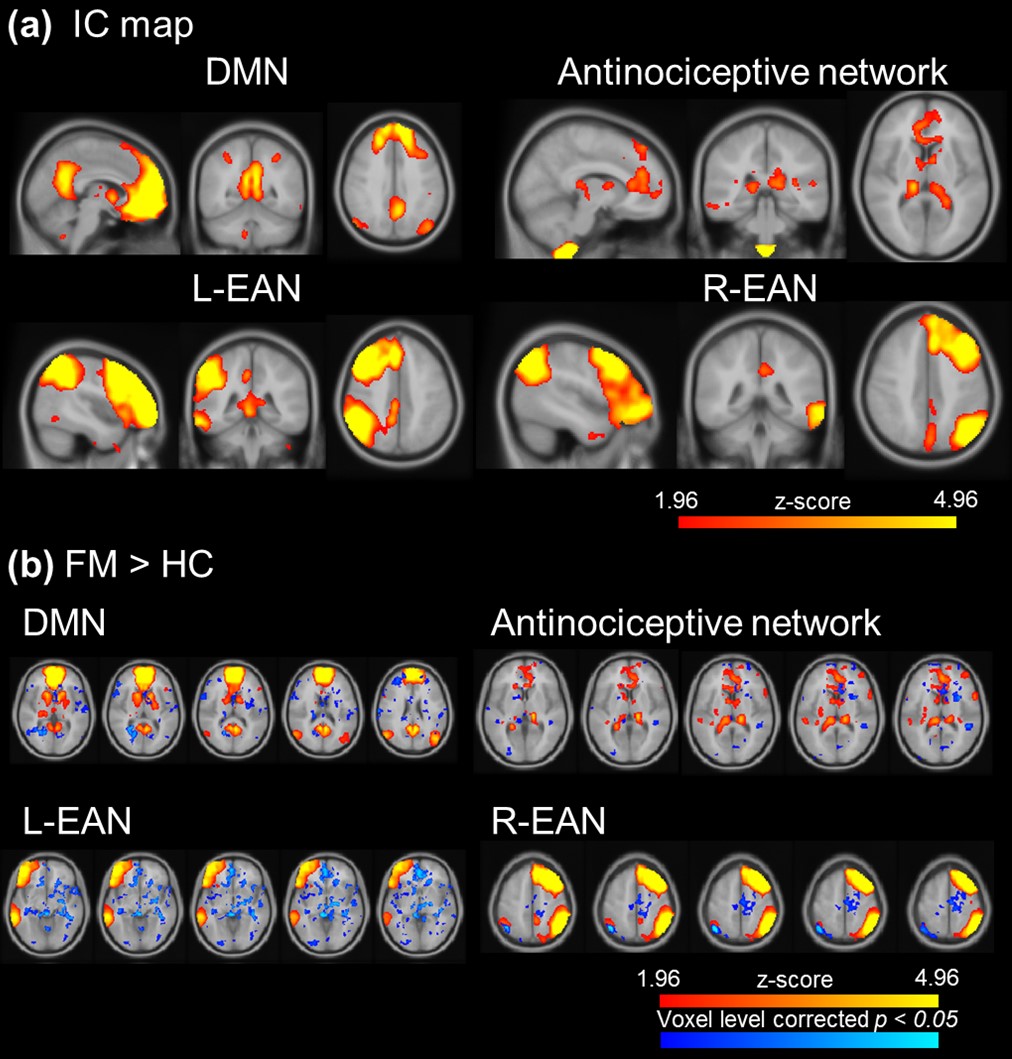
Figure 1. The
visualization of ICA after dual regression. (a) The IC map of DMN, antinociceptive network
and left and right EAN. (b) FM showed significant higher activation
in DMN, antinociceptive network and EAN.
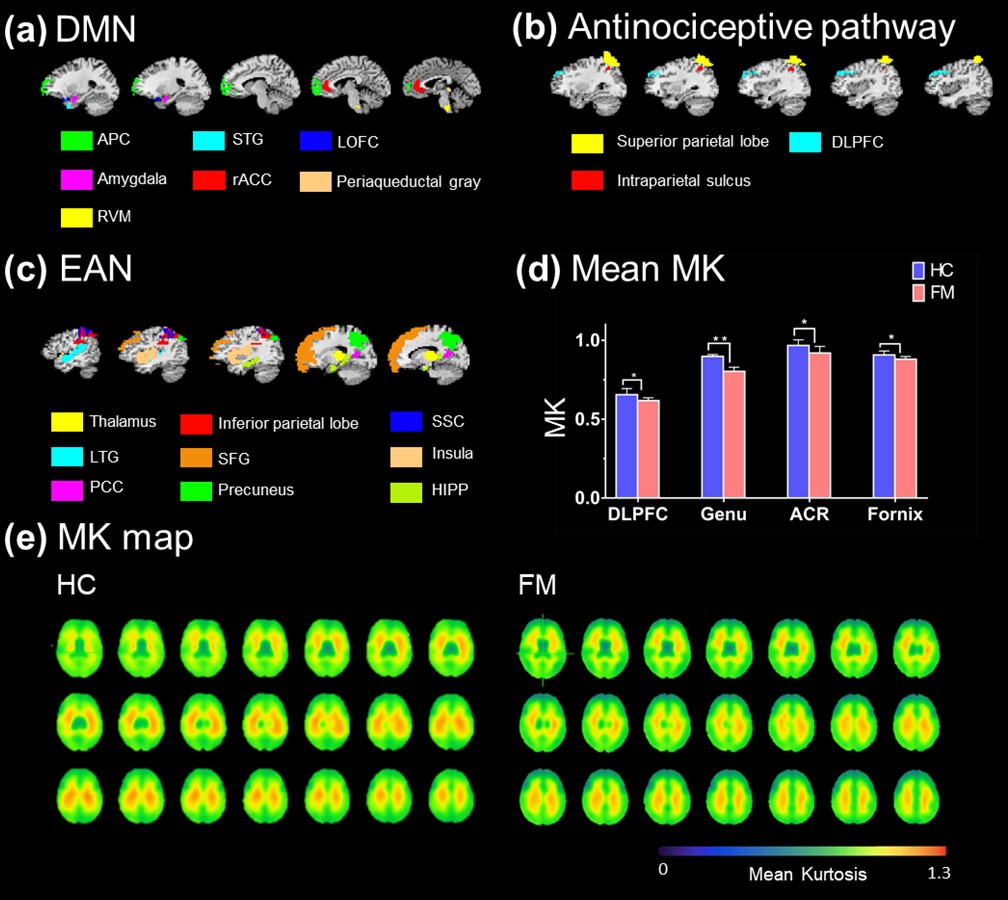
Figure 2. (a) (b) (c) The ROIs were selected form
DMN, antinociceptive pathway and EAN, respectively. (d) Comparison of DKI
parameters showed the significant
differences between HC and FM. In FM, decrease MK values shown in DLPFC
(HC: 0.655 ± 0.00386, FM: 0.617 ± 0.0178 [*p = 0.032]), ACR (control: 0.967 ± 0.036, FM: 0.919 ± 0.042 [**p = 0.007]), fornix (control: 0.907 ±
0.036, FM: 0.88 ± 0.016 [*p
= 0.037]) and genu of corpus callosum (HC: 0.897 ± 0.012, FM: 0.803 ± 0.017 [*p = 0.042]. (e) The MK map of whole
brain shows that decrease MK values.
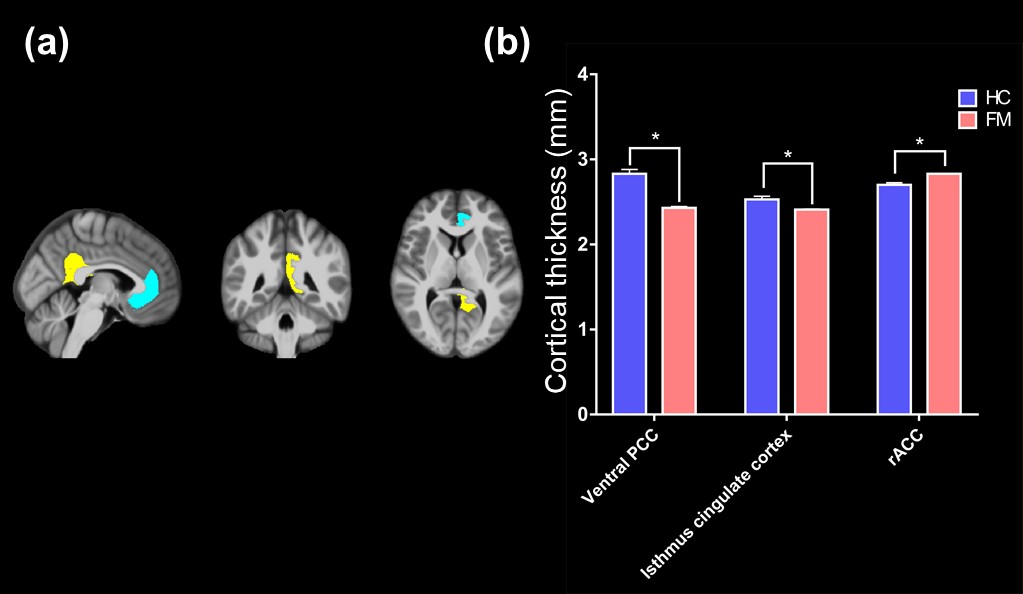
Figure 3. (a) The
visualization of significant decrease cortical thickness between HC and FM. (b)
Decrease cortical thickness showed in ventral PCC (HC: 2.83 ±
0.051, FM: 2.53
± 0.0147 [*p =
0.023]), isthmus cingulate cortex (HC: 2.53, FM: ± 0.0367 [*p = 0.038])
and rACC (HC: 0.2865 ± 0.0092, FM: 2.7 ± 0.0258 [***p = 0.044]) of
FM.