2054
Characterizing Temporal Pole Microstructure with Diffusion Kurtosis Imaging in Temporal Lobe Epilepsy1Imaging Research Laboratories, Robarts Research Institute, London, ON, Canada, 2School of Biomedical Engineering, Western University, London, ON, Canada, 3Department of Medical Biophysics, Western University, London, ON, Canada, 4Department of Medical Imaging, Western University, London, ON, Canada, 5Department of CNS, Western University, London, ON, Canada
Synopsis
The role of the temporal pole (TP) in nonlesional temporal lobe epilepsy (‘MRI-’) has been underappreciated. Better understanding of the possible white matter (WM) microstructural changes within the TP in MRI- is important for informing resective surgery. The purpose of this study was to evaluate the use of diffusion kurtosis imaging (DKI), to detect abnormalities at specific regions along WM fibre bundles proximal to the TP in MRI- and lesional TLE (‘MRI+’). DKI was able to detect possible microstructural changes near TP in both MRI+ and MRI- subjects not clearly visible using diffusion tensor imaging metrics.
Purpose
The involvement of the temporal pole (TP) at seizure onset in nonlesional temporal lobe epilepsy (‘MRI-’) has been underappreciated1. Better understanding of the WM microstructural properties of the TP in MRI- patients might improve resective surgery planning. Diffusion kurtosis imaging (DKI) allows quantification of diffusion in complex tissue environments2 and potentially more sensitive to diffusion anomalies compared to the more common diffusion tensor imaging (DTI) in TLE patients3. However, the benefit of DKI for detecting subtle alterations in the TP’s microstructure in TLE, and MRI- in particular, has yet to be established. The current work aimed to evaluate the sensitivity of DKI to detect anomalous at specific regions along the inferior longitudinal (ILF) and uncinate fasciculus (Unc) fiber bundles proximal to the TP in lesional MRI TLE (‘MRI+’) and MRI- patients.Methods
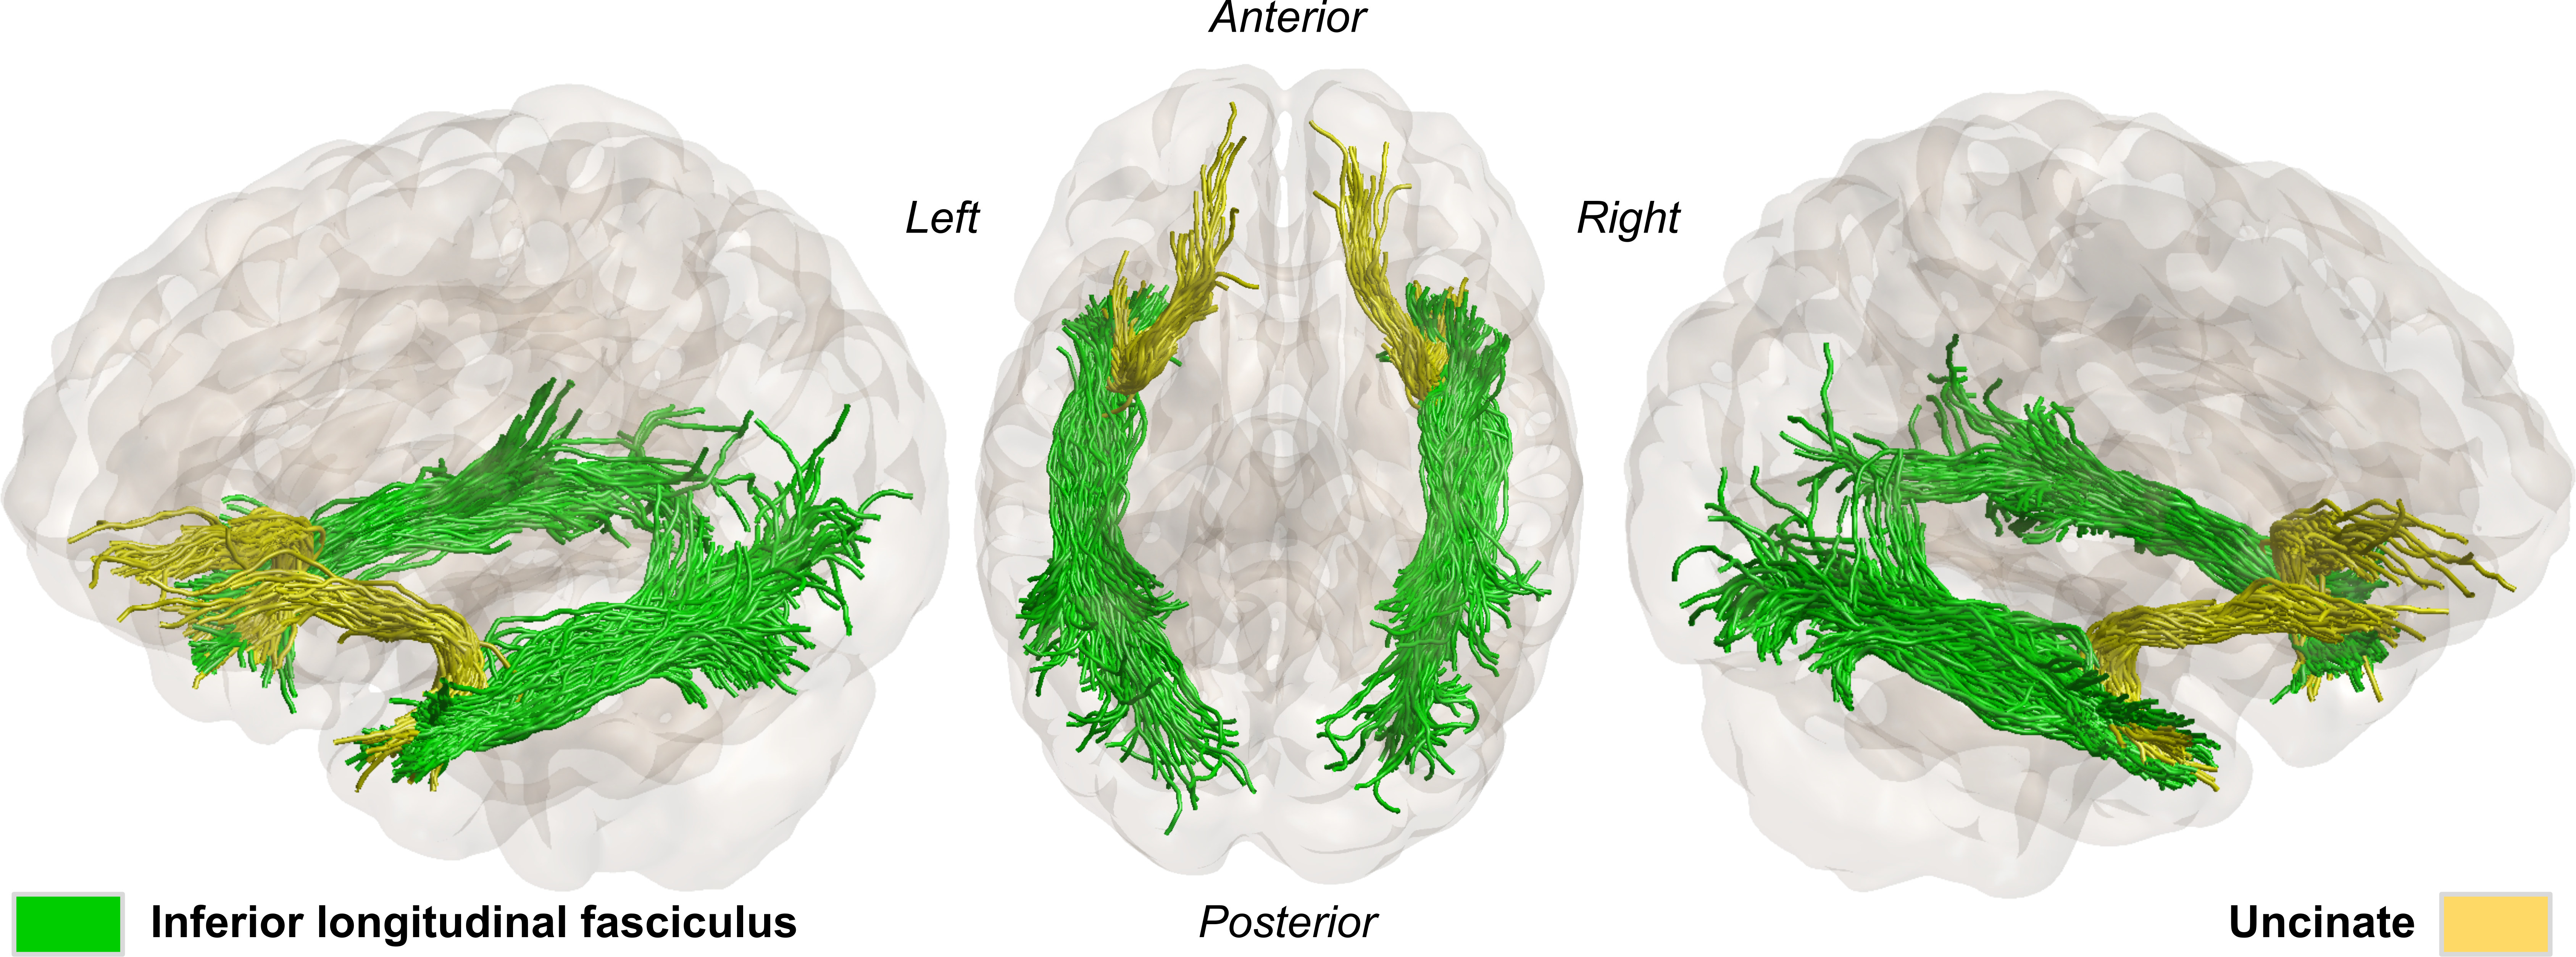
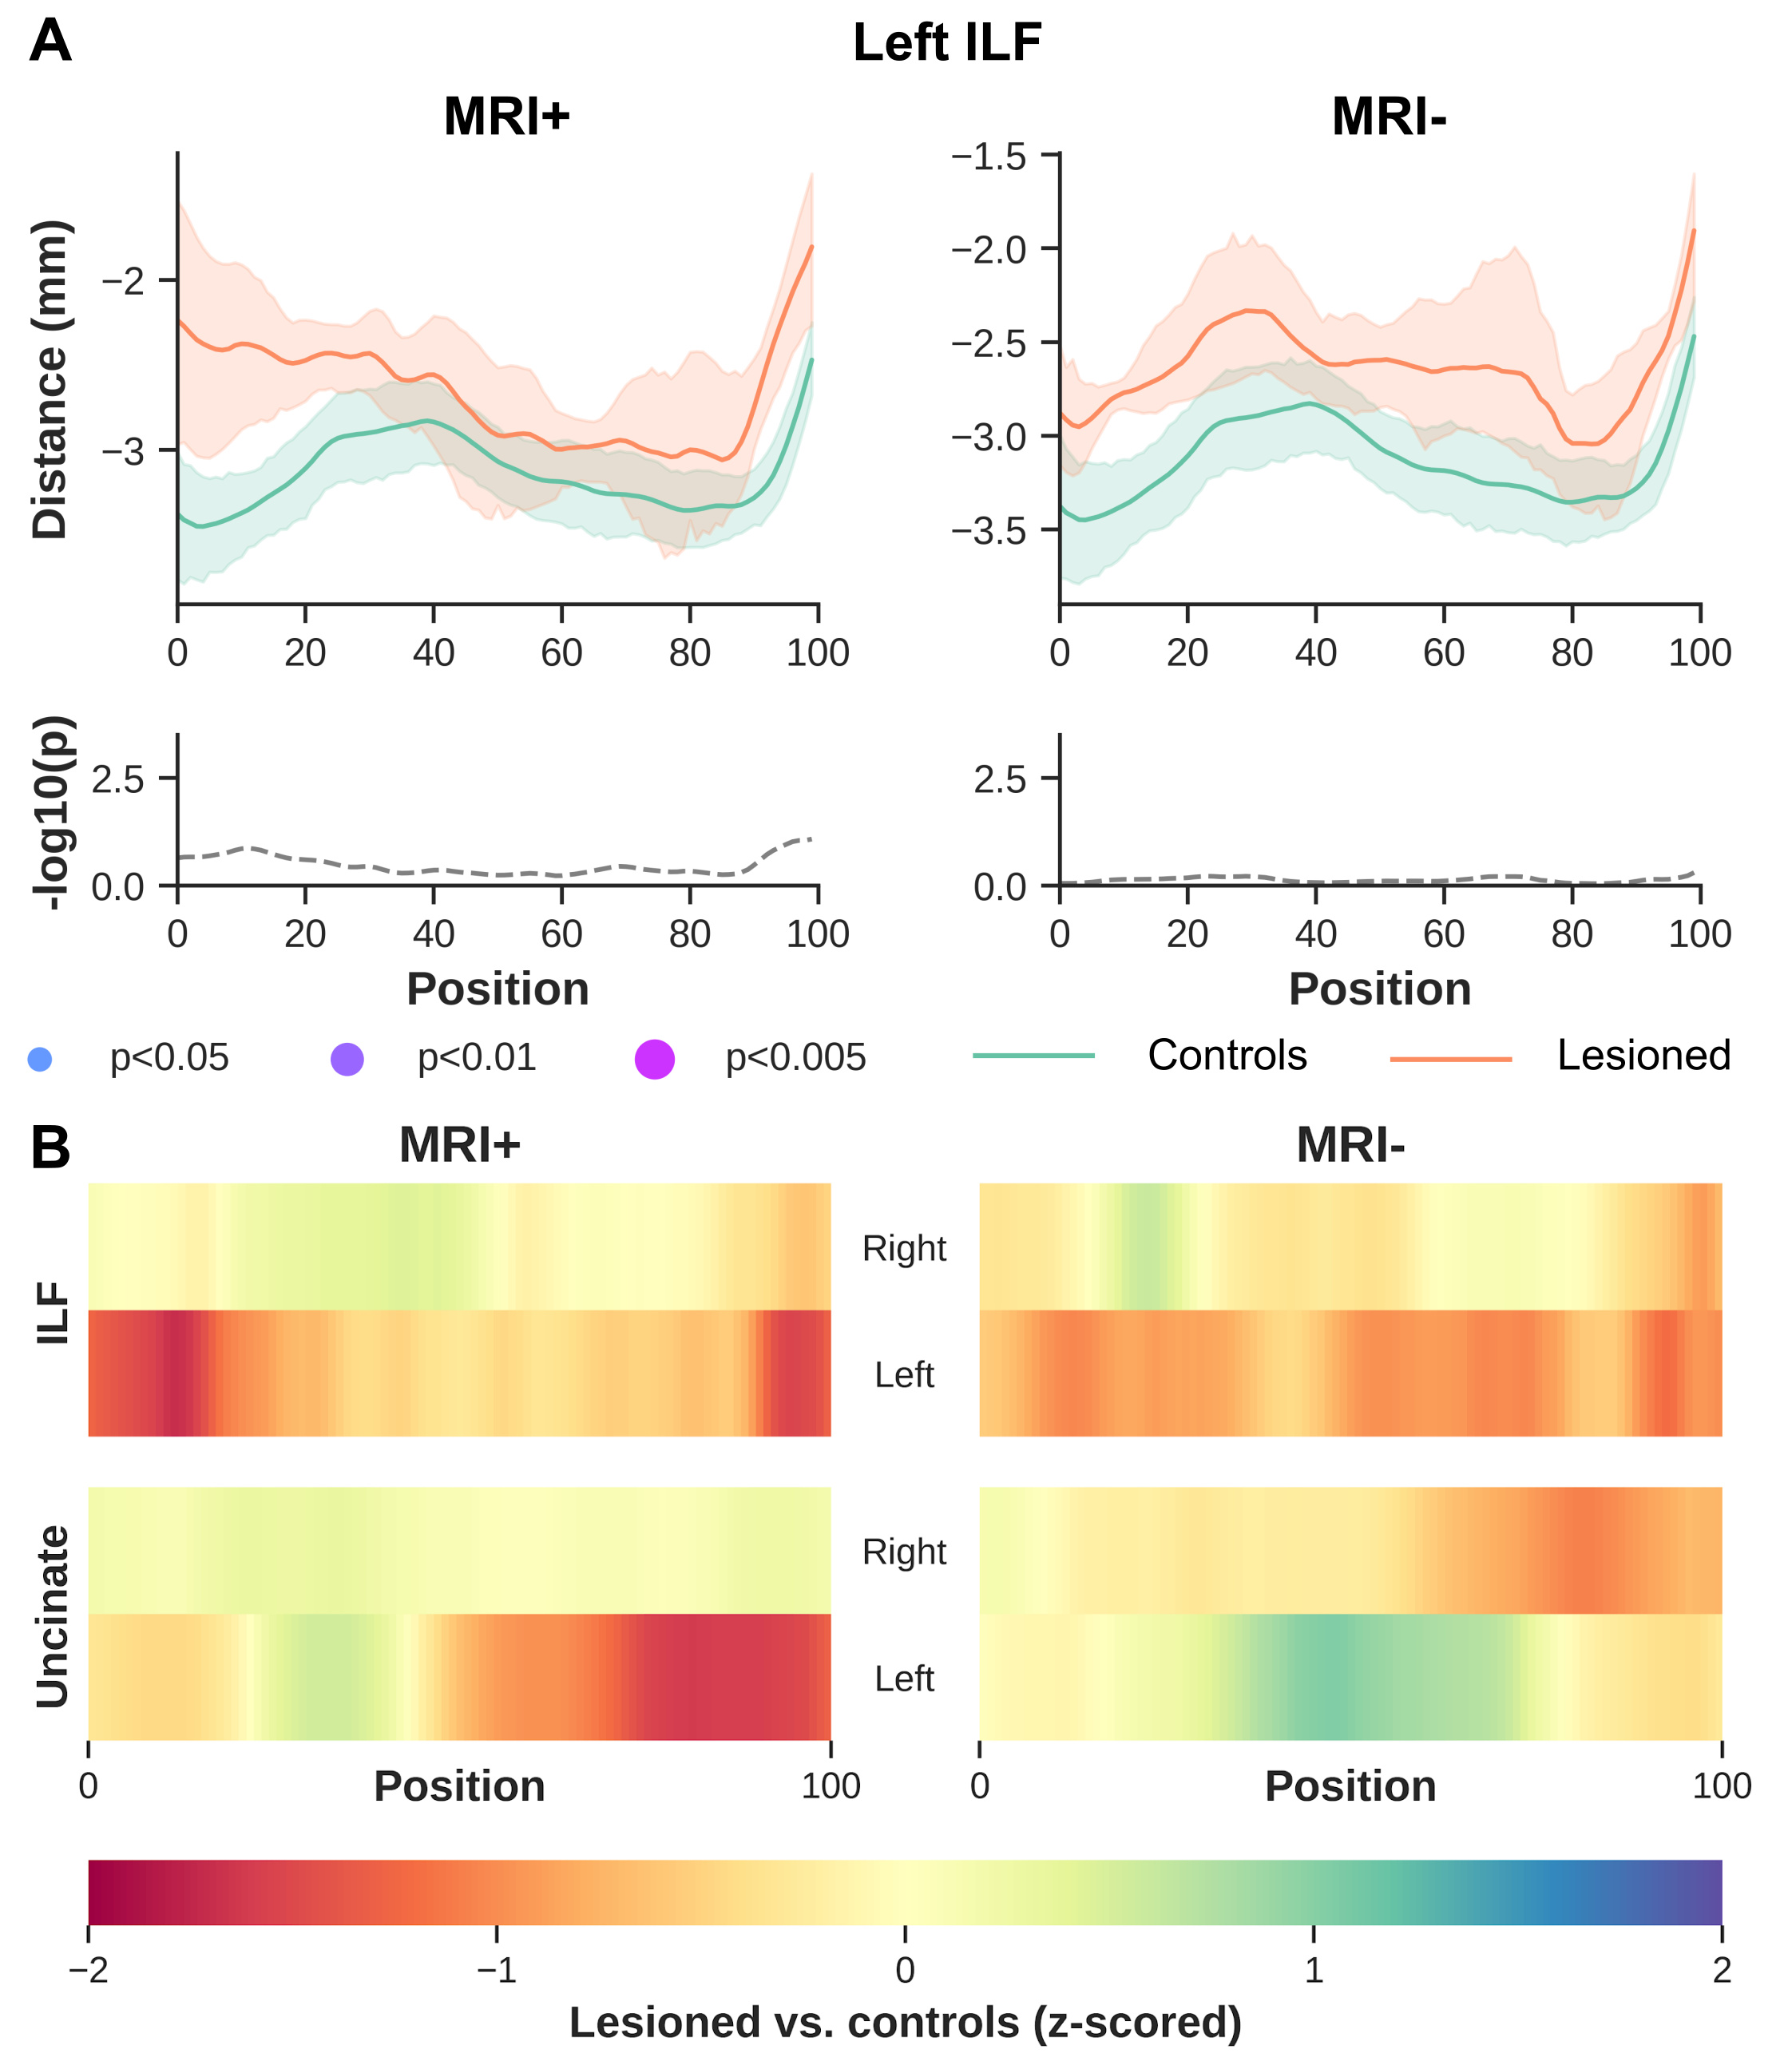
A total of twenty-four TLE subjects and twenty-one healthy controls were recruited for this study. MRI+ patients (n=14) showed mesial temporal sclerosis in the left (n=5) or right hemisphere (n=9). MRI- patients (n=10) showed no abnormalities on MRI but electroclinical findings indicated 4 left, 5 right and 1 uncertain temporal seizure onset zones.All subjects were scanned using a 3T MRI system with a 32-channel head coil. Structural images were acquired using a MPRAGE sequence with TR/TE/TI=5000/2.98/700ms, FOV=256x256mm2, slice thickness=1mm. In addition, a multiband echo-planar imaging (EPI) sequence was used to acquire diffusion-weighted images (DWI) with b=0, 1300, 2600 s/mm2, 130 diffusion-encoding directions acquired in left-right, right-left phase encoding directions, TR/TE=2800/66.80ms, FOV=224x224mm2 and slice thickness=2mm. The acquired DWIs were corrected for EPI readout and eddy current distortion using FSL’s topup and eddy functions4. Correction of Gibbs’ ringing artifact was performed by determining optimal sub-voxel shifts within the neighborhood of sharp edges in the image5, while noise reduction was achieved by separating the signal from the noise in the image via local noise estimation (MRTrix3’s dwidenoise). Mean kurtosis (MK); radial kurtosis (RK); axial kurtosis (AK); kurtosis fractional anisotropy (Kfa), mean diffusivity (MD) and FA, were obtained using the diffusion kurtosis estimator tool v2.6. In addition, we estimated axonal water fraction (AWF) as a surrogate marker for axonal loss6. Fiber orientation function (FOD) were separately calculated for the three tissue types (i.e., WM, gray matter (GM) and cerebrospinal fluid) based on the multi-shell multi-tissue constrained spherical deconvolution (CSD) method within the dwi2fod function. To allow for group comparison, a WM FOD template was generated using the population_template function to warp FODs and DKI maps into a common analysis space. Automated fiber quantification (AFQ)7 was used to quantify DKI measurements along the ILF and Unc after tractography using anatomically constrained tractography (ACT)8. We used the FODs generated with CSD to accommodate for complex fiber configuration as input to ACT. In addition, manually created ROIs and GM-WM boundary masks generated from the subjects’ T1’s using 5ttgen fsl were used for seeding tractography and enabling the extraction of bundles of interest (Fig.1). Resulting WM bundles were then refined using their respective probability maps. After which DKI measurements were sampled across 100 equidistant points along the bundles. To verify that diffusion profiling was restricted to WM tissue, we calculated the signed distance to the WM-GM boundary for each WM voxel. As a result, negative values indicate proper sampling. For group-wise statistical analyses, each patient group was separated according to the side of lesion for MRI+ and the side of seizure focus for MRI- subjects and their AFQ results used as input to the Permutation Analysis of Linear Models (PALM) toolbox.
Results
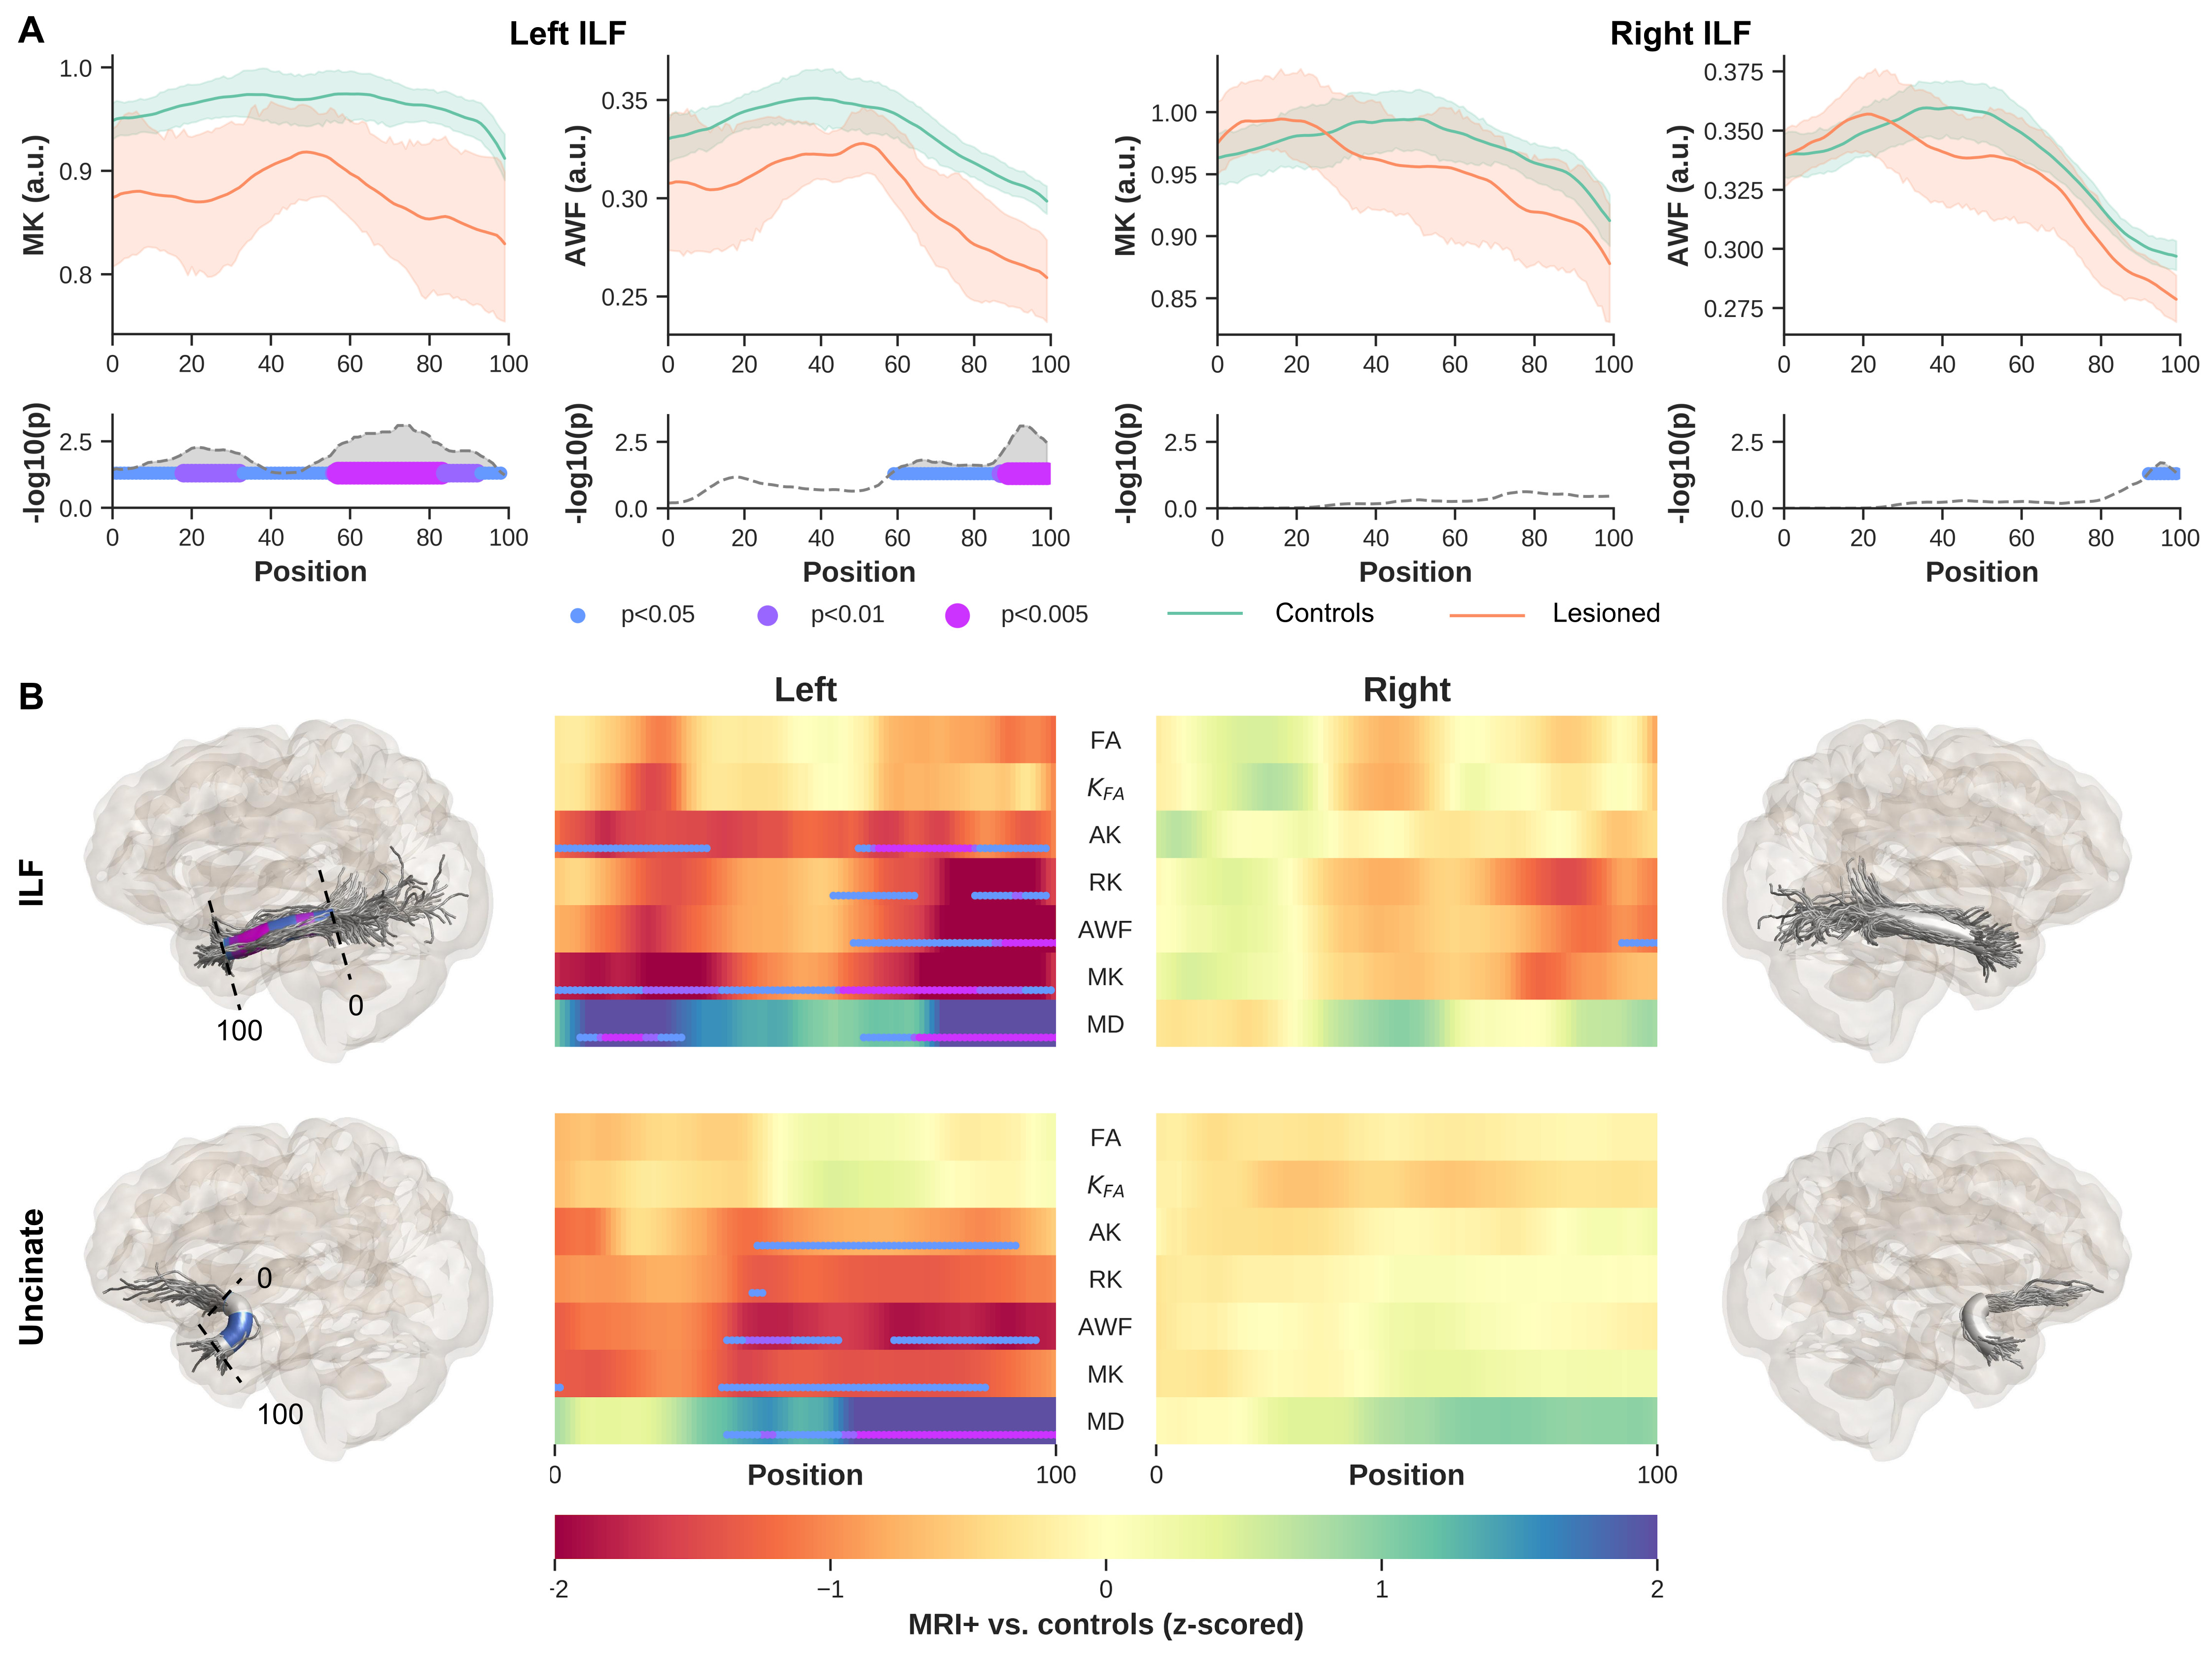
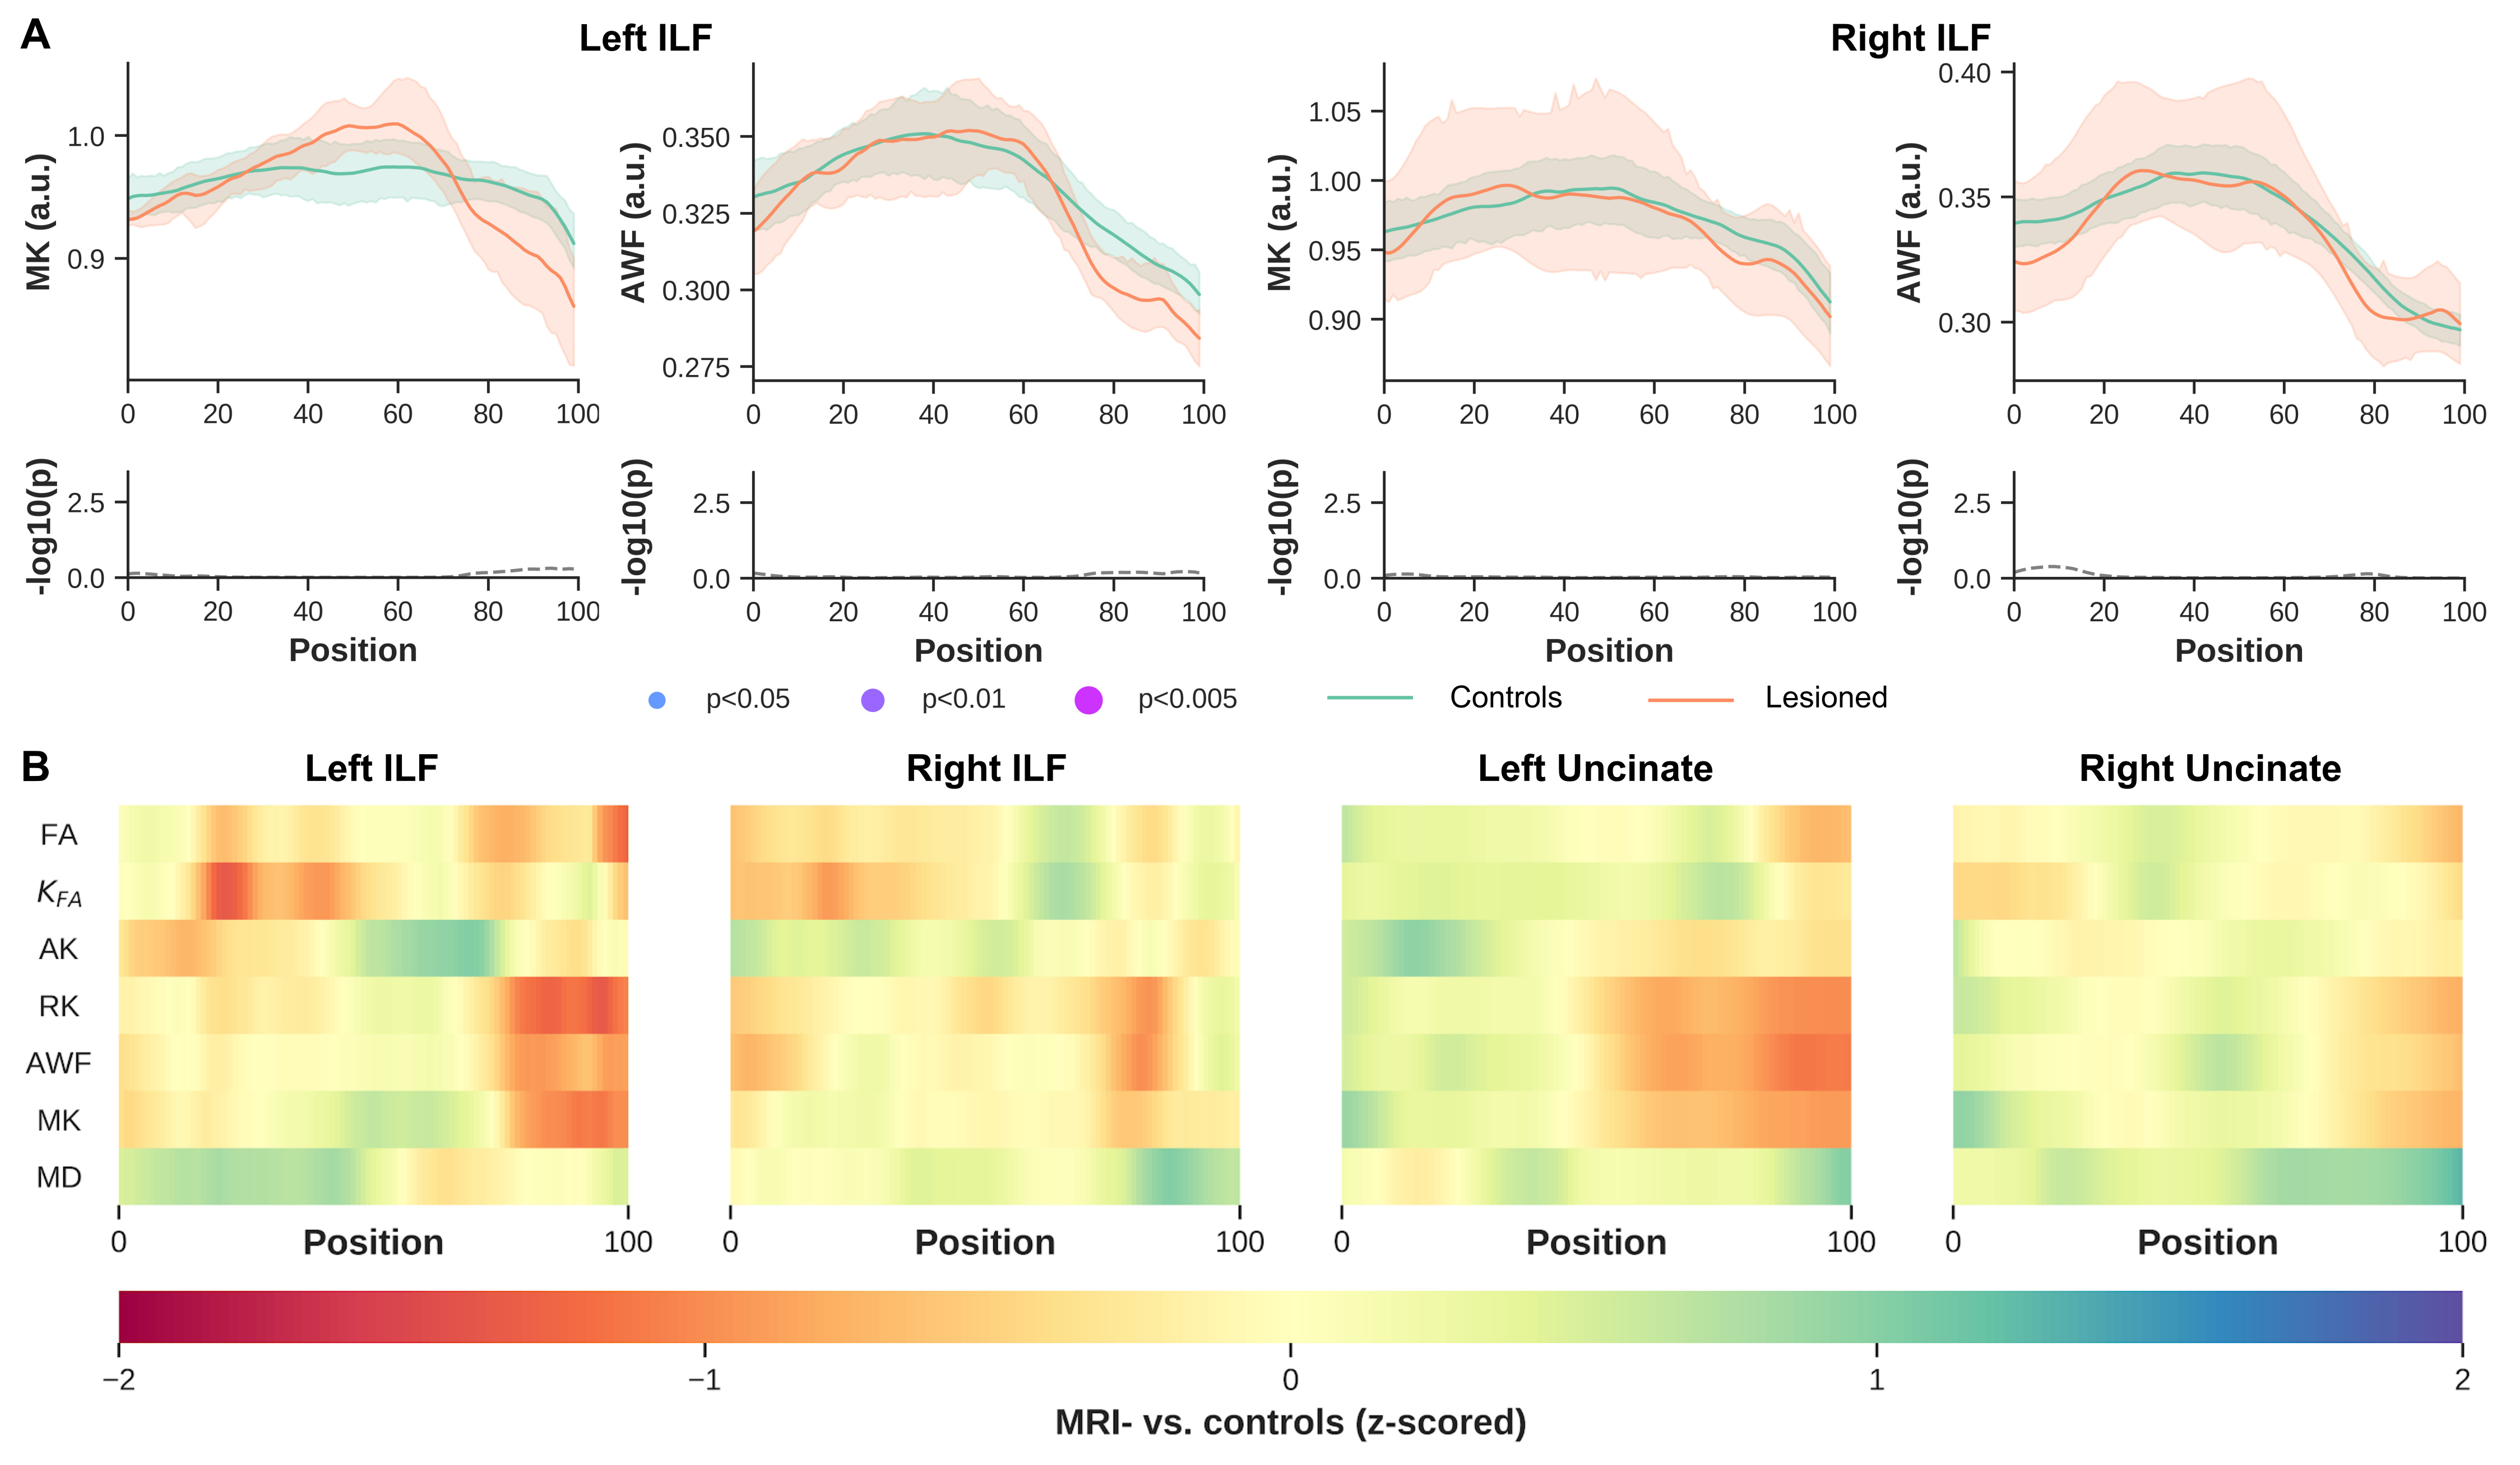
Significant differences were observed between MRI+ and controls (p<0.005, FWER-corrected), towards the most anterior (i.e., position 100) of the left ILF for MK, RK, AWK and MD (Fig.2). A comparable pattern was observed in Unc for the left MRI+ patients. Weak or no significant differences were detected in the right hemisphere for the MRI+ group. Noticeable differences compared to controls were also observed mostly towards the TP for MK, RK and AWK in the MRI- group (Fig.3). Although, the verification of WM profiling results indicated all sampling of DKI parameters were exclusively within the WM (i.e., negative distance), there were consistent differences between the two patient groups and the controls as shown in Fig.4.Discussion
Current results indicate microstructural alteration in the fiber bundles near the TP. The DKI metrics show noticeable changes across the two groups (Fig.2 and Fig.3), while MD changes were not apparent in the MRI- group. This suggests that DKI could serve as a complementary approach to detect subtle changes in the WM fiber bundles proximal to the TP. In addition, the boundary differences (Fig.4) could be related to the blurring of GM-WM attributed to various causes (e.g. developmental cortical abnormalities, gliosis or myelin alterations)9. Identifying abnormalities at specific locations along the ILF and Unc prior to surgery in TLE, particularly MRI- subjects could be used to guide the procedure by more completely identifying the region to be resected, potentially resulting in improved outcomes.Acknowledgements
This work was supported by Canadian Institutes of Health Research (CIHR) Foundation, Natural Sciences and Engineering Research Council (NSERC) Discovery, the Canada First Research Excellence Fund and Brain Canada. Author Roy AM Haast was supported by a BrainsCAN postdoctoral fellowship for this work.References
1. Chabardès, S. et al. The temporopolar cortex plays a pivotal role in temporal lobe seizures. Brain 128, 1818–1831 (2005).
2. Jensen, J. H., Helpern, J. A., Ramani, A., Lu, H. & Kaczynski, K. Diffusional kurtosis imaging: the quantification of non-gaussian water diffusion by means of magnetic resonance imaging. Magn. Reson. Med. 53, 1432–1440 (2005).
3. Bonilha, L. et al. Altered microstructure in temporal lobe epilepsy: a diffusional kurtosis imaging study. AJNR Am. J. Neuroradiol. 36, 719–724 (2015).
4. Andersson, J. L. R., Skare, S. & Ashburner, J. How to correct susceptibility distortions in spin-echo echo-planar images: application to diffusion tensor imaging. Neuroimage 20, 870–888 (2003).
5. Kellner, E., Dhital, B., Kiselev, V. G. & Reisert, M. Gibbs-ringing artifact removal based on local subvoxel-shifts. Magn. Reson. Med. 76, 1574–1581 (2016).
6. McKinnon, E. T. et al. Types of naming errors in chronic post-stroke aphasia are dissociated by dual stream axonal loss. Sci. Rep. 8, 14352 (2018).
7. Yeatman, J. D., Dougherty, R. F., Myall, N. J., Wandell, B. A. & Feldman, H. M. Tract profiles of white matter properties: automating fiber-tract quantification. PLoS One 7, e49790 (2012).
8. Smith, R. E., Tournier, J.-D., Calamante, F. & Connelly, A. Anatomically-constrained tractography: improved diffusion MRI streamlines tractography through effective use of anatomical information. Neuroimage 62, 1924–1938 (2012).
9. Garbelli, R. et al. Blurring in patients with temporal lobe epilepsy: clinical, high-field imaging and ultrastructural study. Brain 135, 2337–2349 (2012).
Figures