2051
Investigating cortical microstructure in preterm-born adolescents using three-tissue compositional analysis1Developmental Imaging, Murdoch Children's Research Institute, Melbourne, Australia, 2Victorian Infant Brain Studies (VIBeS), Murdoch Children's Research Institute, Melbourne, Australia, 3Department of Neuroscience, Central Clinical School, Monash University, Melbourne, Australia, 4Monash Biomedical Imaging, Monash University, Melbourne, Australia, 5Newborn Research, The Royal Women's Hospital, Melbourne, Australia, 6Department of Obstetrics and Gynaecology, The University of Melbourne, Melbourne, Australia, 7Department of Paediatrics, The University of Melbourne, Melbourne, Australia, 8Turner Institute for Brain and Mental Health and School of Psychological Sciences, Monash University, Melbourne, Australia
Synopsis
While many studies have used diffusion MRI to investigate white matter microstructure, fewer studies have investigated cortical grey matter microstructure. We investigated cortical microstructural tissue and fluid composition using diffusion tissue signal fractions from Single-Shell 3-Tissue Constrained Spherical Deconvolution, in a cohort of preterm-born children at 13 years of age (n=130). Compared with term-born controls (n=45), we identified several cortical regions exhibiting a relative shift from a grey matter-like composition towards a more fluid-like composition, potentially reflecting reduced cell density and increased free-water content. This illustrates the utility of 3-tissue compositional analysis for studying cortical microstructure in neurodevelopment.
Introduction
Many studies have used diffusion MRI (dMRI) to investigate brain white matter (WM) microstructure[1]. In contrast, there has been a relative dearth of studies on microstructure of the cortical grey matter (GM). Existing prior studies of cortical microstructure were generally based on the diffusion tensor imaging (DTI) model[2-4]. The introduction of multi-tissue signal representations, such as Single-Shell 3-Tissue Constrained Spherical Deconvolution (SS3T-CSD)[5], has enabled estimation of WM fibre orientation distributions (FODs), along with GM and cerebrospinal fluid (CSF) signal compartments. More recently, SS3T-CSD has been used to study pathological brain tissue microstructure, in terms of the relative "WM-like", "GM-like" and fluid-like composition of the diffusion signal[6,7]. In this work, we aimed to investigate cortical microstructural composition using SS3T-CSD in a cohort of typically and atypically developing (preterm-born) children at 13 years of age. Given the major transformations occurring in the cortex during the perinatal period[8], developmentally vulnerable preterm-born children may exhibit alterations to cortical microstructural organisation.Methods
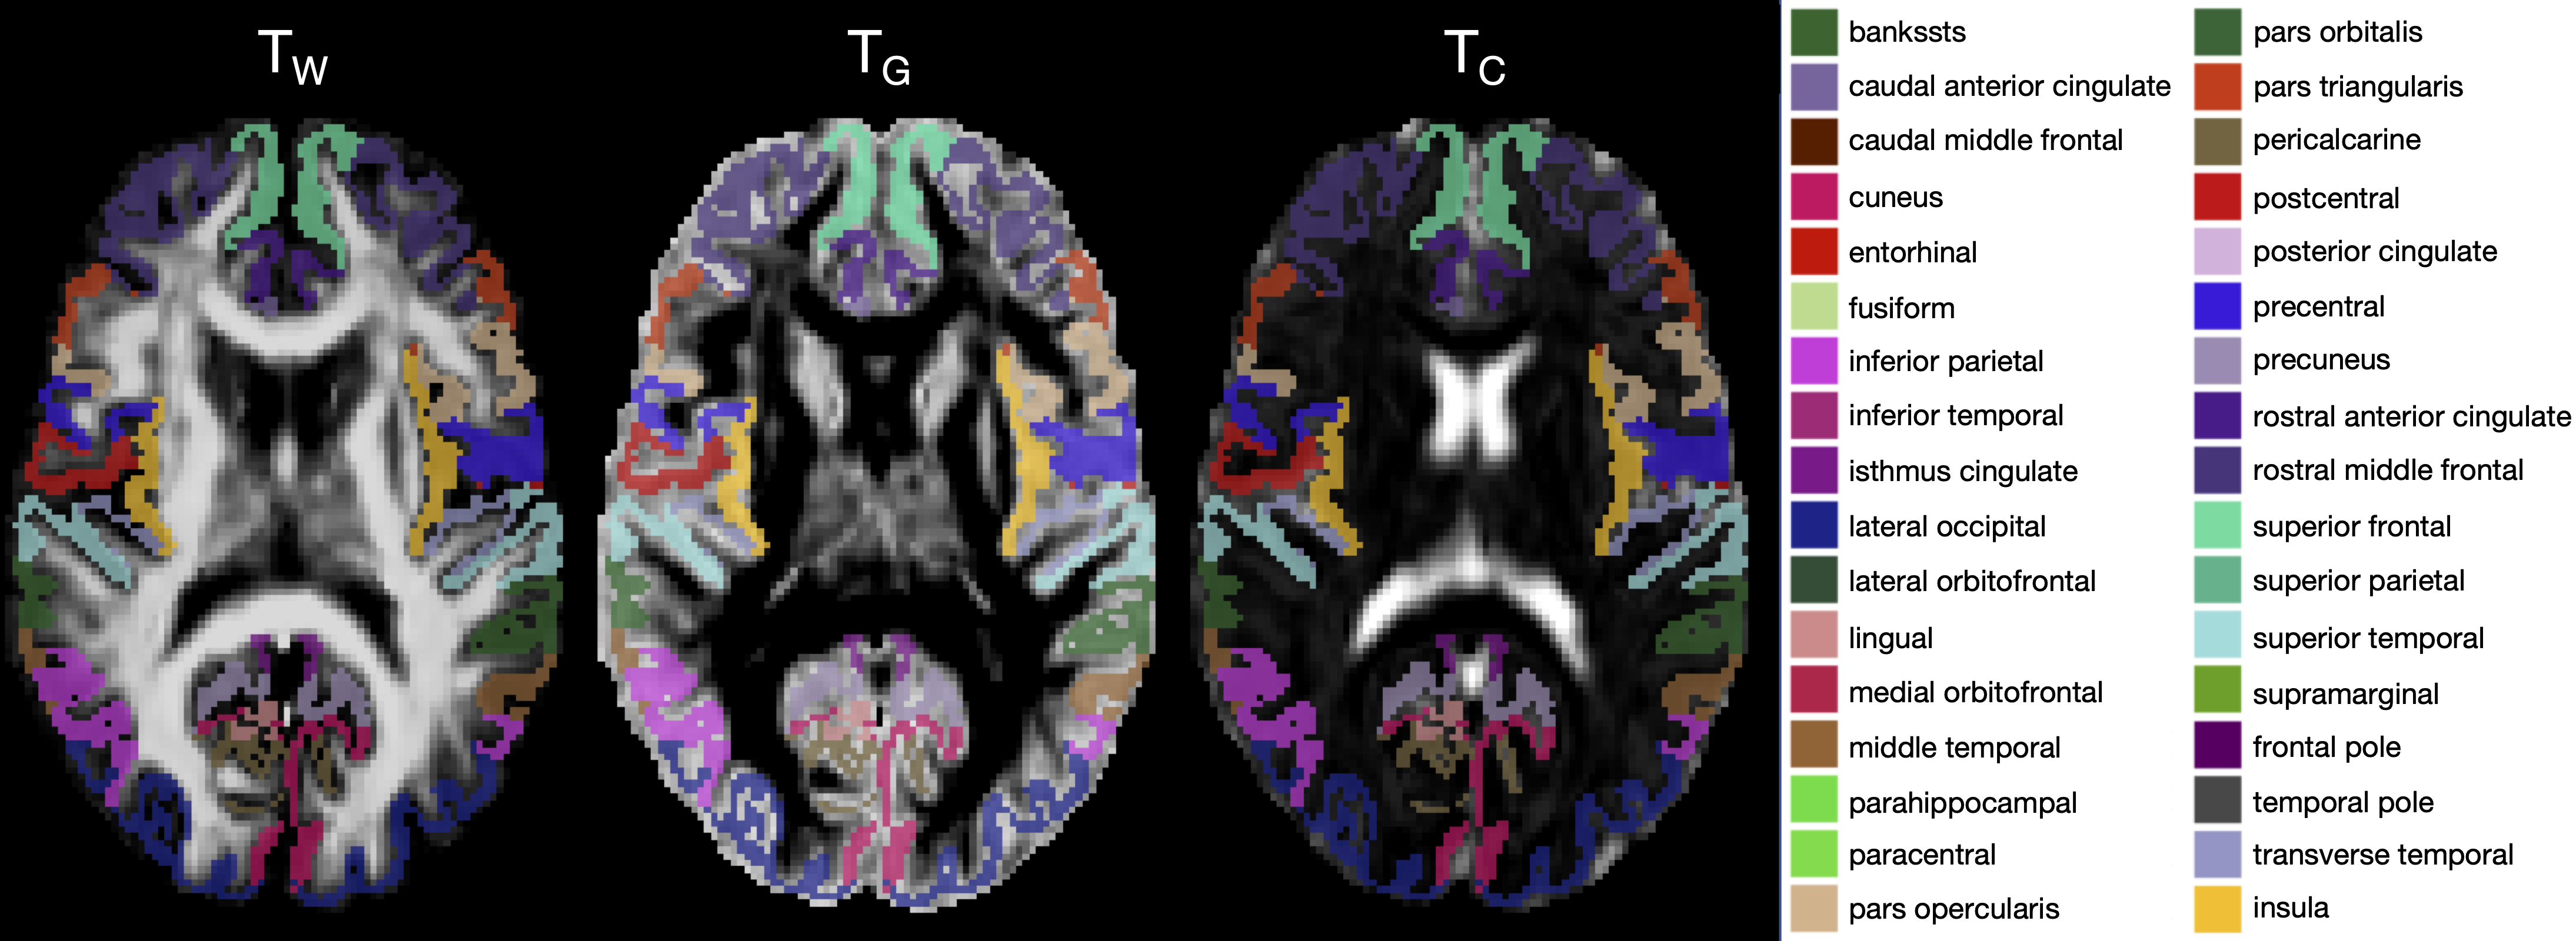
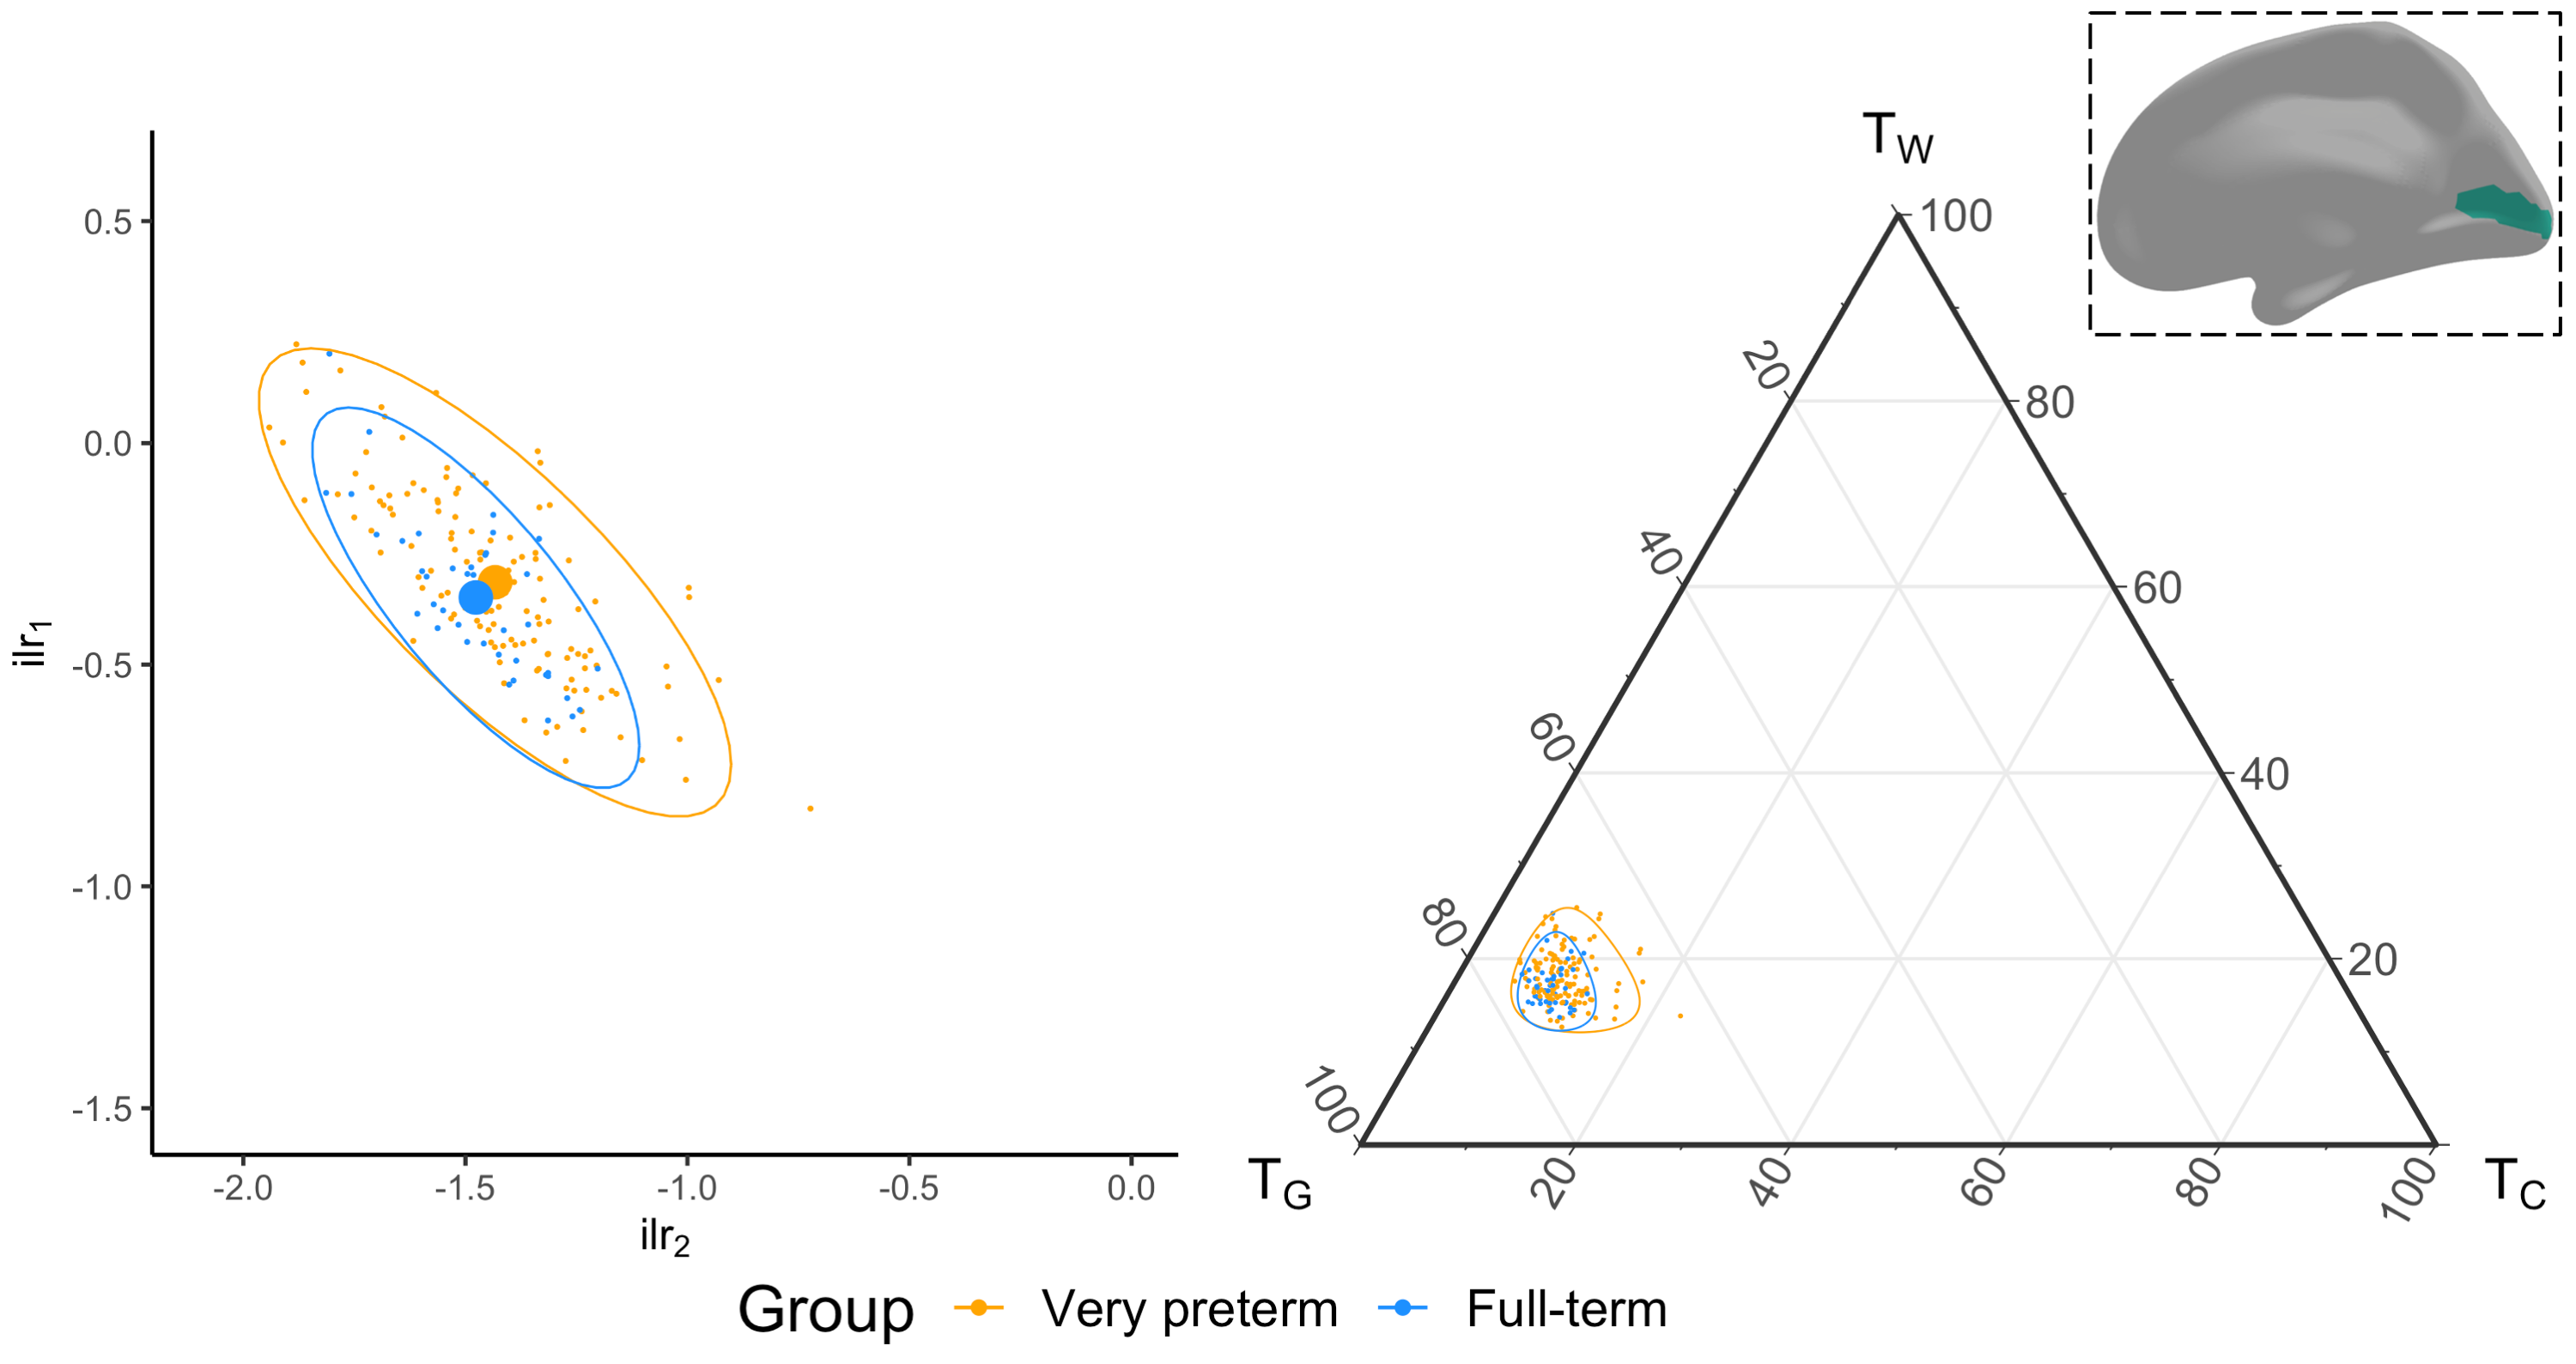
We acquired dMRI data on a Siemens 3T scanner, with 60 gradient directions, b=2800s/mm², 4 b=0s/mm² images and 2.4 mm isotropic voxels. Images were acquired for a group of n=130 preterm-born children (born <30 weeks' gestation; M (SD) age at scan 13.3 (0.4) years; 54% males) and n=45 typically developing, term-born children (born ≥37 weeks' gestation; M (SD) age at scan 13.3 (0.5) years; 49% males). T1-weighted anatomical images were also acquired for all participants with 0.9 mm isotropic voxels. The dMRI data were processed predominantly using MRtrix3[9], MRtrix3Tissue (https://3Tissue.github.io, a fork of MRtrix3) and FSL[10]. Images were corrected for Gibbs-ringing artefacts[11], and motion and distortions[12-16]. 3-tissue response functions were estimated[17] and averaged across participants. Images were upsampled to 1.5 mm isotropic voxels, before performing SS3T-CSD[5]. The resulting WM, GM and CSF signal compartments were normalised by the total sum of all three, generating the 3-tissue signal fractions: respectively TW, TG and TC[6,7,18]. T1-weighted images were linearly registered to the dMRI data and processed using FreeSurfer[19]. Region-averaged TW, TG and TC values were sampled from 34 cortical regions per hemisphere defined using the Desikan-Killiany atlas (Figure 1)[20]. Next, we calculated a pair of isometric log-ratios (ilr1 and ilr2) from the average TW, TG and TC values for each region. Briefly, the ilr transform is designed to account for the interdependence and boundedness of the 3 signal fractions (i.e., TW + TG + TC = 1 and all bounded between 0 and 1)[6,7]. This then allows us to compare the ilr transformed values between both subject groups using multivariate analyses (MANCOVAs)[6,7]. From this, we obtained an FDR-corrected p-value per region, indicating whether the 3-tissue composition "as a whole" differs between the groups in that region. For regions that differed significantly (p<0.05, FDR-corrected, adjusted for age and sex) between groups, the direction and size of the effect, i.e., the TW, TG and TC values themselves, were visualised using ternary plots.Results
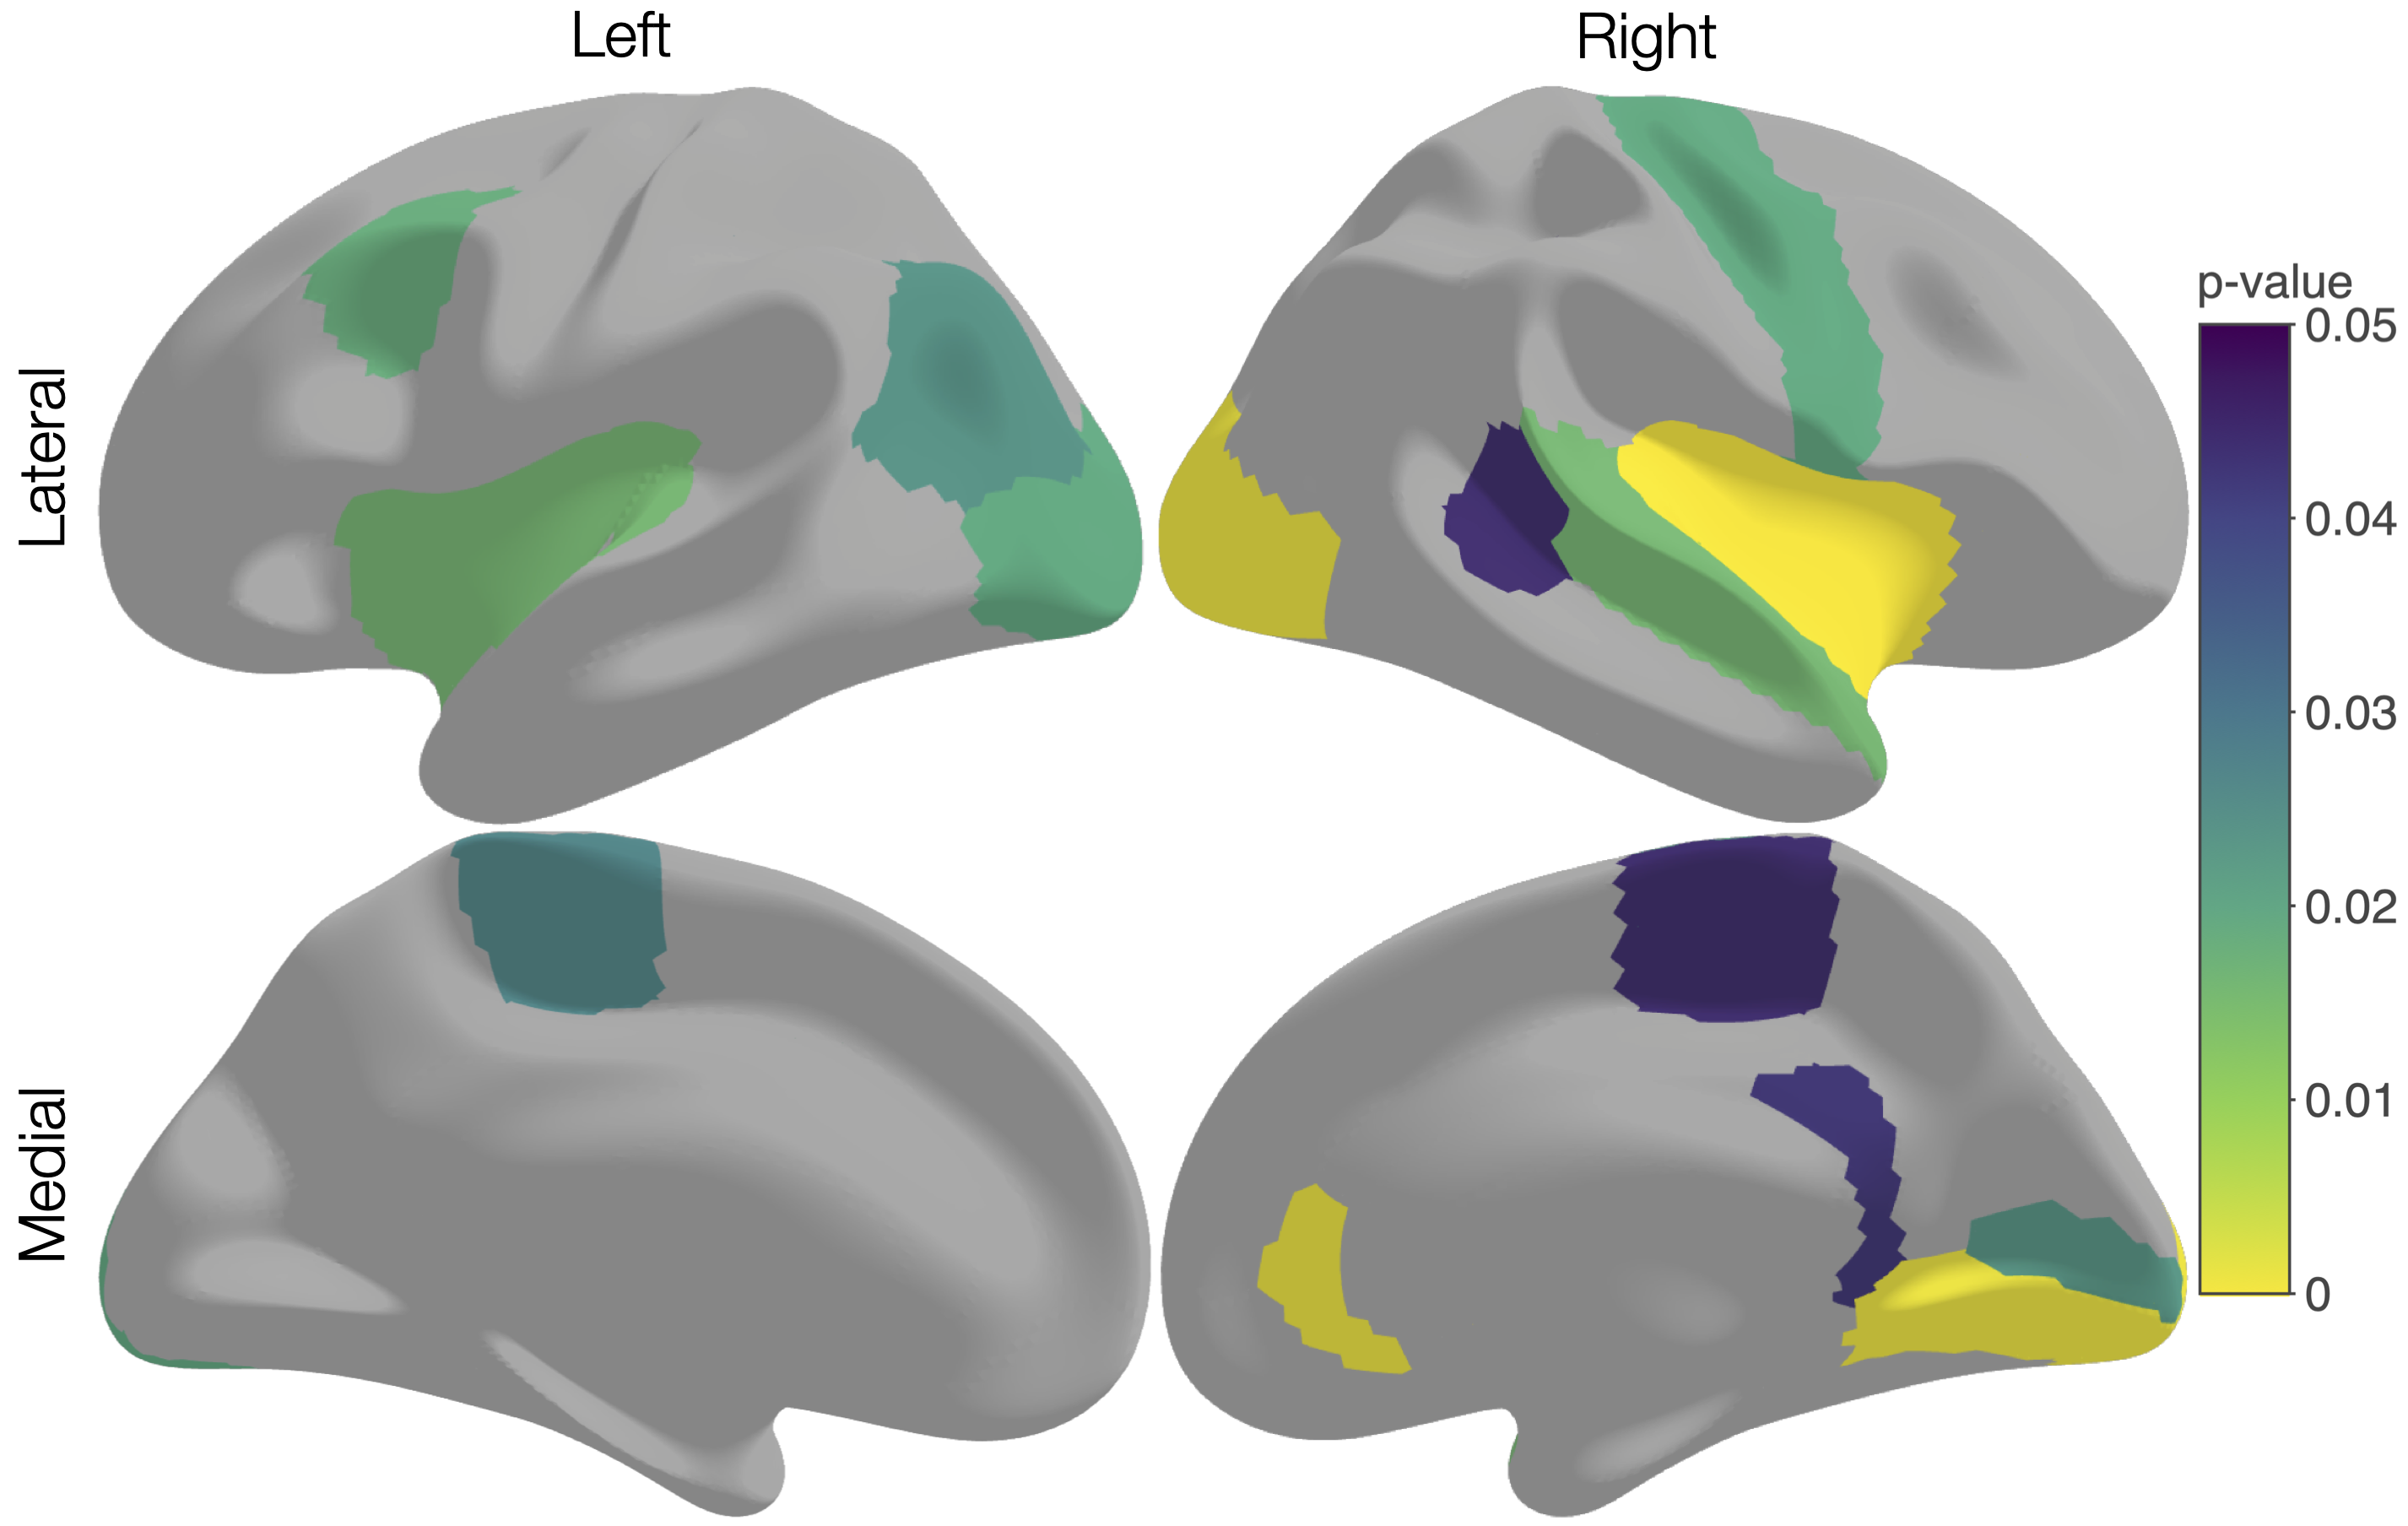
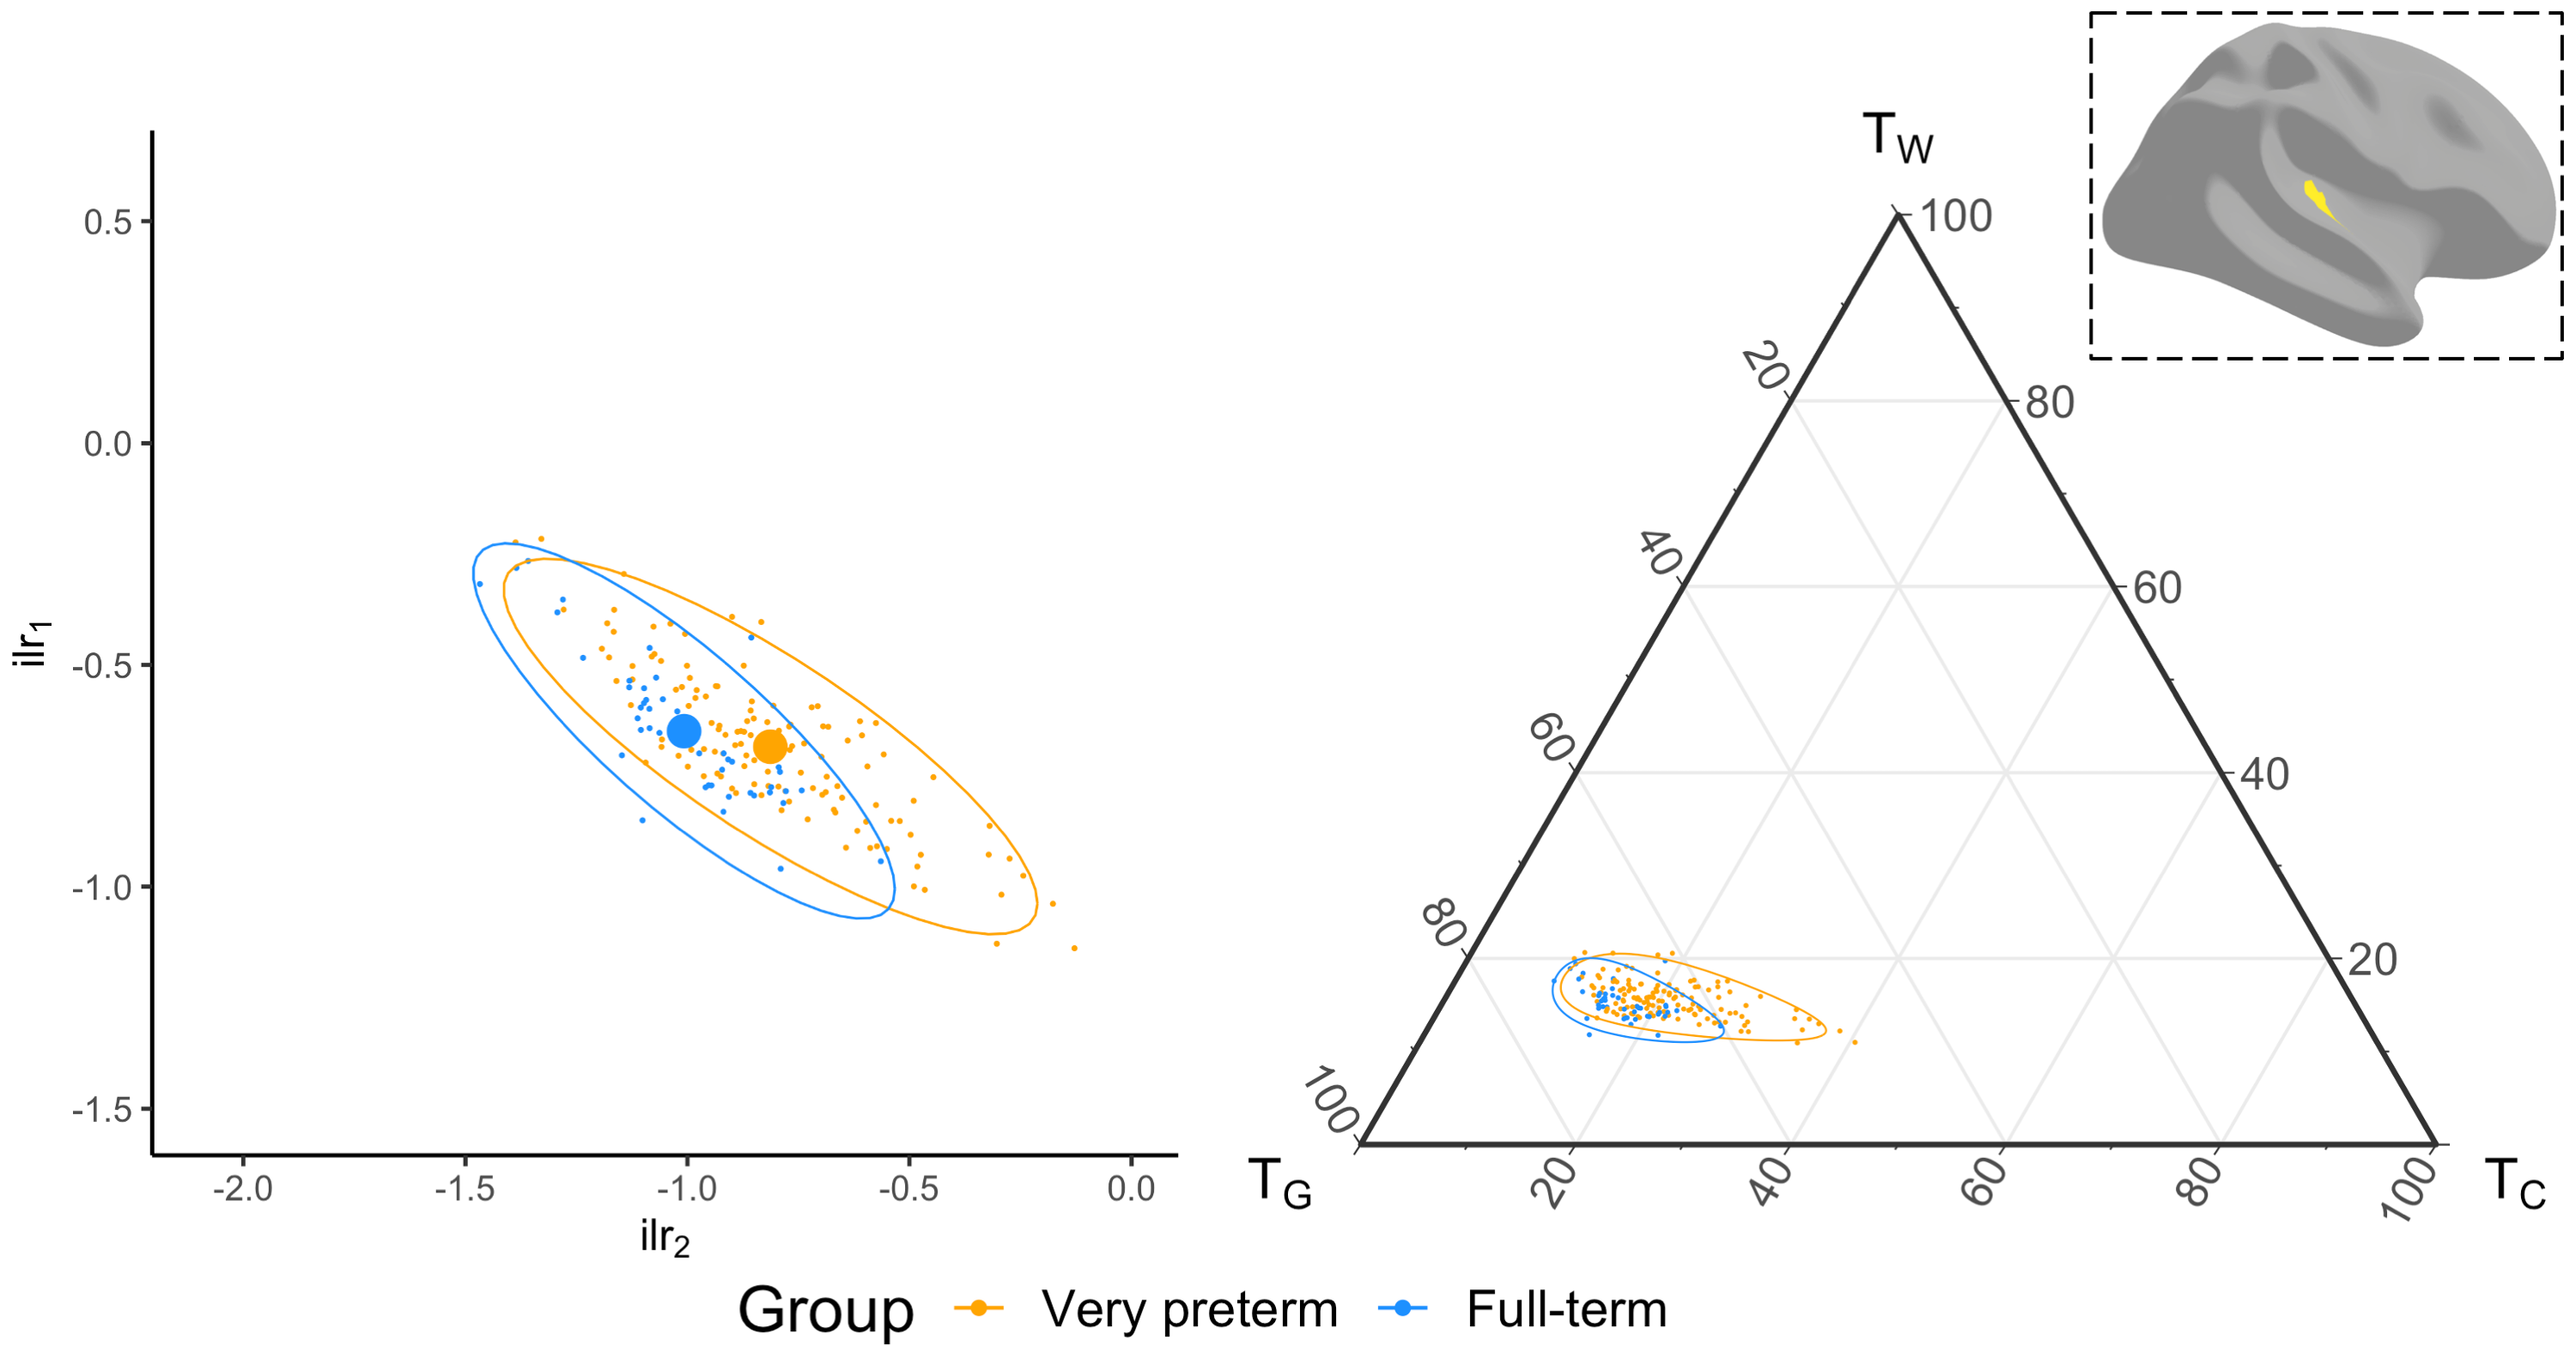
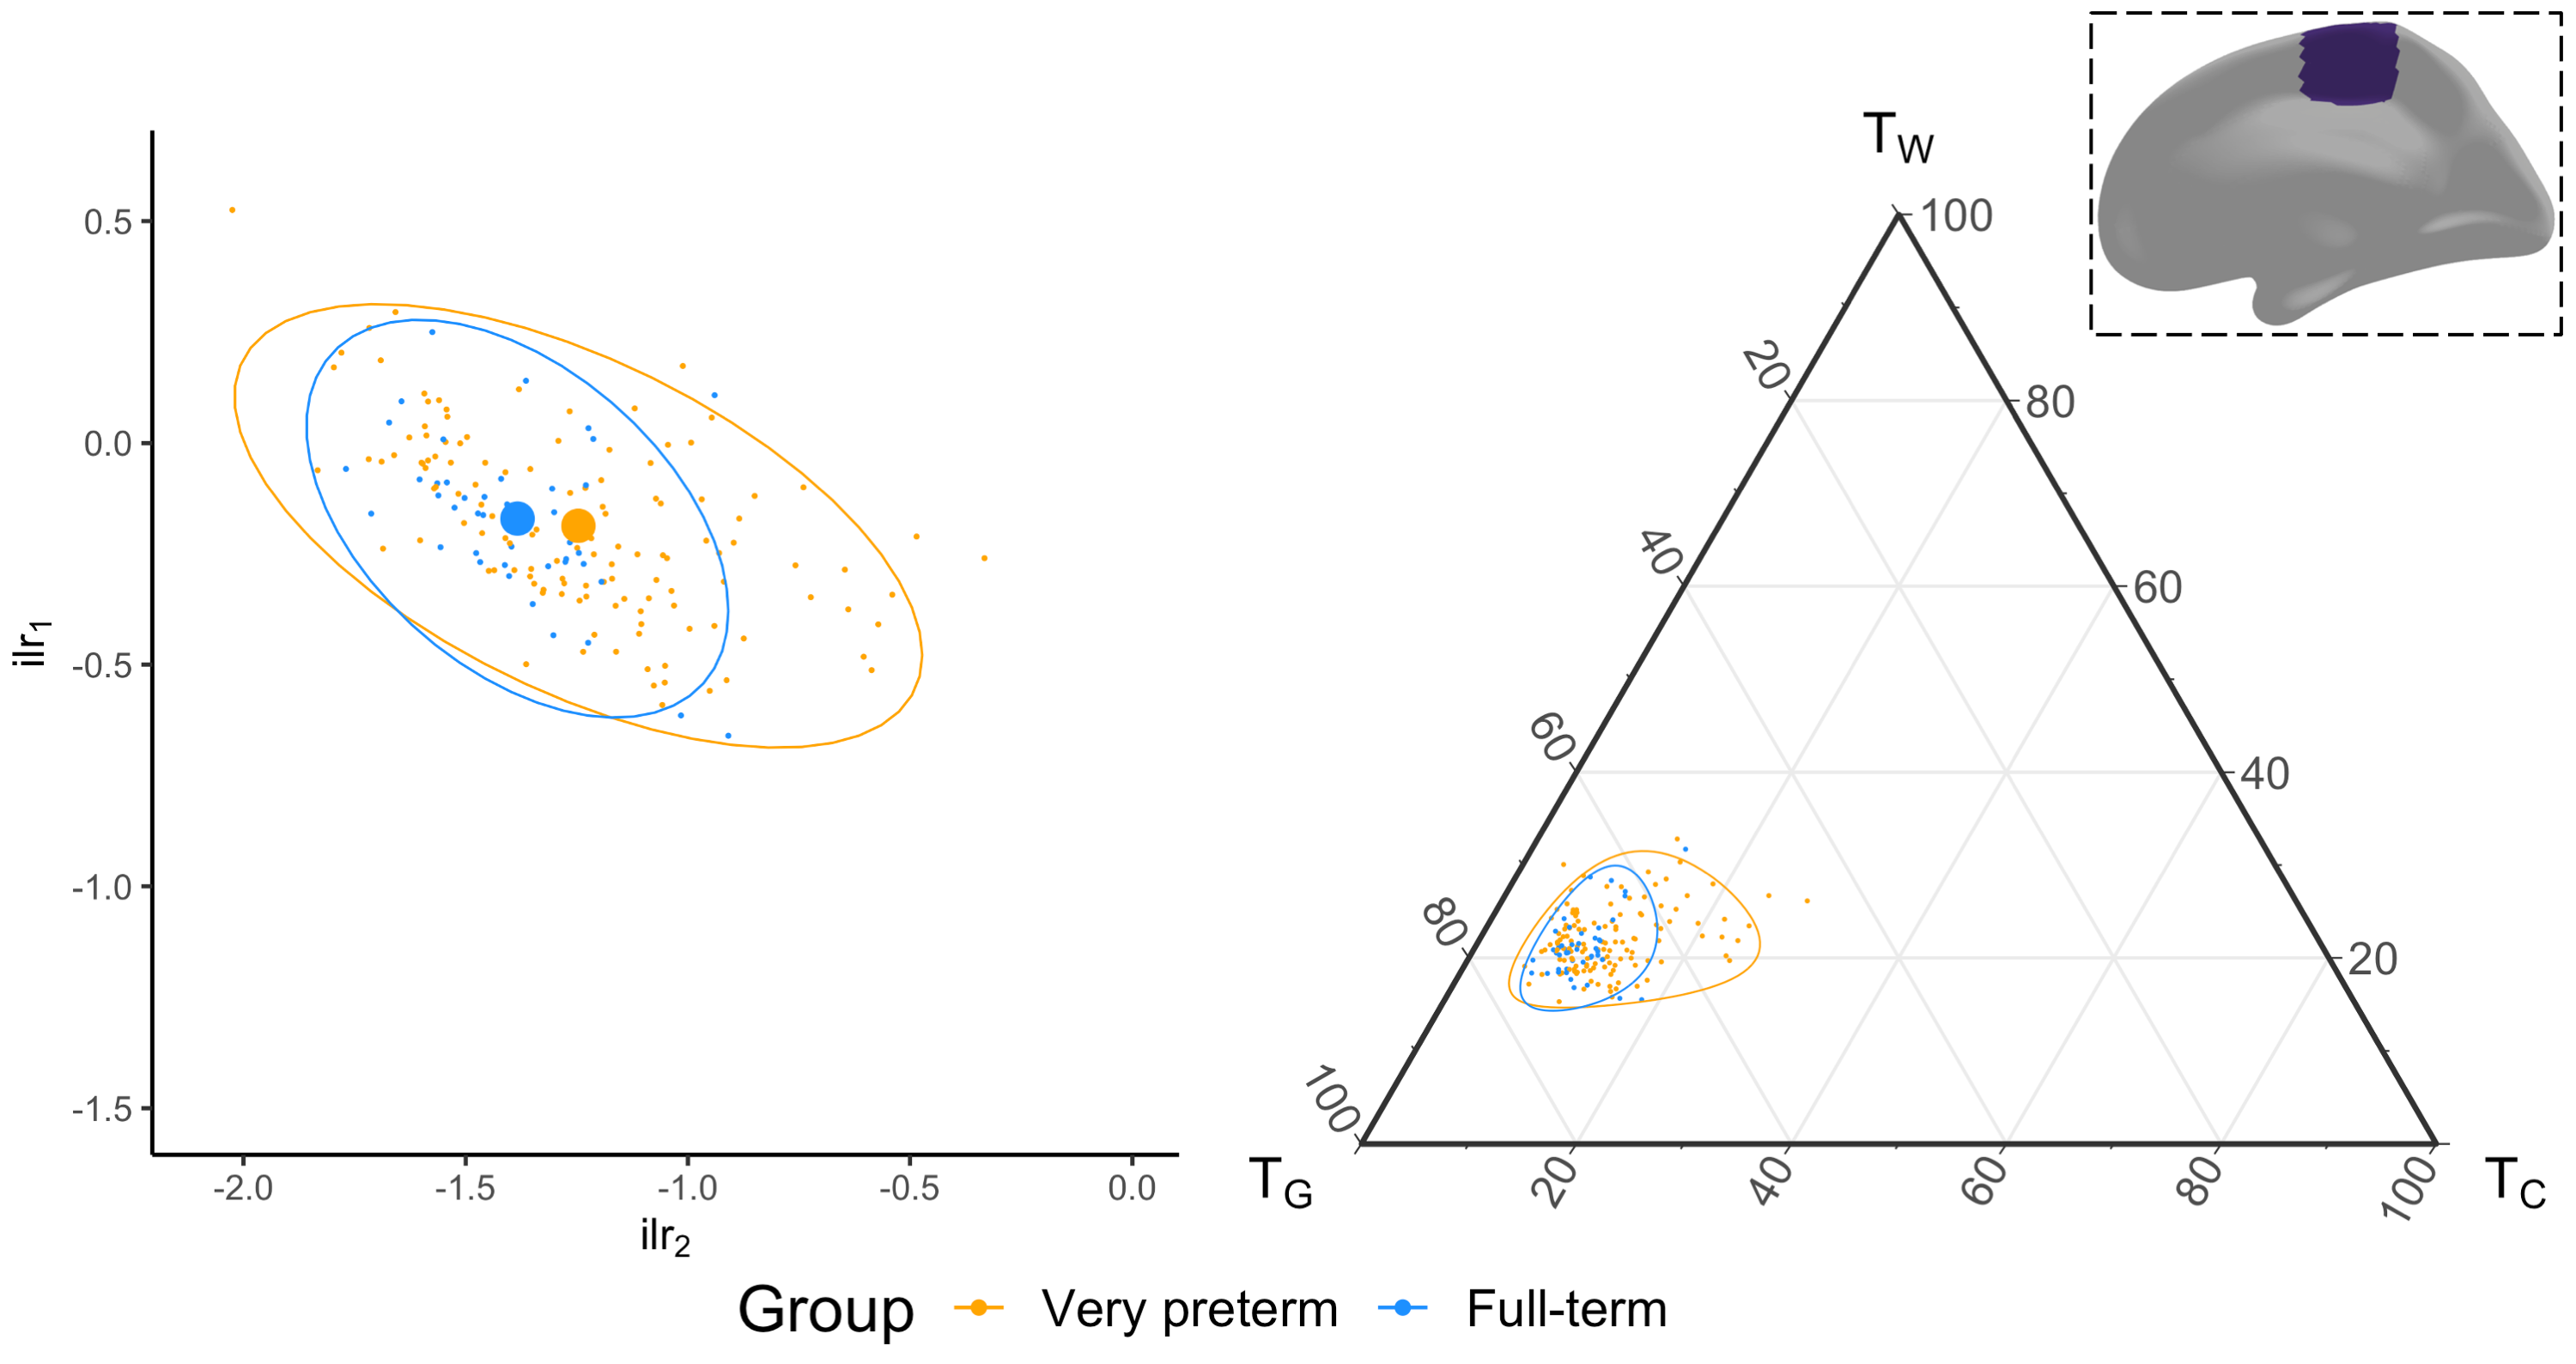
Several cortical regions were identified in which the overall 3-tissue composition differed significantly between the preterm-born and typically developing children (Figure 2). These regions were distributed across the cortical grey matter, in the temporal cortex (superior temporal, banks superior temporal, transverse temporal, insula), occipital cortex (lateral occipital, pericalcarine, lingual), frontal cortex (precentral, paracentral, caudal middle frontal), parietal cortex (inferior parietal), and cingulate cortex (isthmus cingulate, rostral anterior cingulate; Figure 2). Several of these regions were identified bilaterally, although a few more regions were identified in the right hemisphere than the left hemisphere (Figure 2). We show plots of the ilr transformed values and 3-tissue compositions (TW, TG and TC values) for representative temporal, sensorimotor and occipital regions in Figures 3-5. All of these regions exhibited a relative shift from a "GM-like" (TG) signal towards a more fluid-like (TC) signal in the preterm-born children compared to the typically developing controls.Discussion
We used SS3T-CSD to study cortical microstructural tissue and fluid compositions in typically and atypically developing preterm-born children. We found alterations to the microstructural composition of the cortical GM in the preterm-born children, which are distributed across the cortex and primarily associated with a shift from a "GM-like" (TG) composition towards a more fluid-like (TC) composition. From a diffusion signal representation perspective, this reflects an increase in diffusivity in these regions. Biologically, this is compatible with and may thus reflect decreased GM cell density and increased free-water content in these regions. The regions affected include some with established vulnerability in preterm-born children based on volumetric MRI, such as the temporal lobe[21,22]. The results are also broadly in line with studies that reported increases in mean diffusivity in the cortex of preterm-born neonates compared to term-born neonates, albeit based on the limited DTI model[2-4]. Our study suggests there is a longer-term adverse effect of preterm birth on cortical microstructure in adolescence.Conclusion
This study demonstrates the ability of compositional data analysis of SS3T-CSD derived tissue signal fractions for probing the microstructure of the cortical grey matter. Application to a pediatric cohort identified alterations to the cortical microstructural tissue and fluid composition of vulnerable preterm-born children compared to typically developing children.Acknowledgements
We thank members of the VIBeS and Developmental Imaging teams at the Murdoch Children's Research Institute, the Royal Children's Hospital Medical Imaging staff for their assistance and expertise in the collection of the MRI data included in this study, and the children and families who participated. This research was supported by the Australian National Health and Medical Research Council [NHMRC; Project Grant 1066555; Centre for Research Excellence 1153176; Investigator Grant 1176077 to PA; Career Development Fellowship 1085754 to DT and 1141354 to JC], the Murdoch Children's Research Institute, the Royal Children's Hospital, the Royal Children's Hospital Foundation, the Department of Paediatrics at the University of Melbourne, and the Victorian Government's Operational Infrastructure Support Program.References
[1] Pandit AS, Ball G, Edwards AD, et al. Diffusion magnetic resonance imaging in preterm brain injury. Neuroradiology. 2013;55(Suppl 2):65–95.
[2] Ball G, Srinivasan L, Aljabar P, et al. Development of cortical microstructure in the preterm human brain. Proc Natl Acad Sci U S A. 2013;110(23):9541-9546.
[3] Bouyssi-Kobar M, Brossard-Racine M, Jacobs M, et al. Regional microstructural organization of the cerebral cortex is affected by preterm birth. Neuroimage Clin. 2018;18:871–880.
[4] Smyser TA, Smyser CD, Rogers CE, et al. Cortical Gray and Adjacent White Matter Demonstrate Synchronous Maturation in Very Preterm Infants. Cereb Cortex. 2016;26(8):3370-3378.
[5] Dhollander T, Connelly A. A novel iterative approach to reap the benefits of multi-tissue CSD from just single-shell (+b=0) diffusion MRI data. 24th International Society of Magnetic Resonance in Medicine; Singapore, 2016.
[6] Khan W, Egorova N, Khlif MS, et al. Three-tissue compositional analysis reveals in-vivo microstructural heterogeneity of white matter hyperintensities following stroke. Neuroimage. 2020;218:116869.
[7] Mito R, Dhollander T, Xia Y, et al. In vivo microstructural heterogeneity of white matter lesions in healthy elderly and Alzheimer's disease participants using tissue compositional analysis of diffusion MRI data. NeuroImage: Clinical. 2020;28:102479.
[8] Batalle D, O'Muircheartaigh J, Makropoulos A, et al. Different patterns of cortical maturation before and after 38 weeks gestational age demonstrated by diffusion MRI in vivo. Neuroimage. 2019;185:764-775.
[9] Tournier JD, Smith R, Raffelt D, et al. MRtrix3: A fast, flexible and open software framework for medical image processing and visualisation. Neuroimage. 2019;202:116137.
[10] Jenkinson M, Beckmann CF, Behrens TE, et al. Fsl. Neuroimage. 2012;62(2):782–790.
[11] Kellner E, Dhital B, Kiselev VG, et al. Gibbs-ringing artifact removal based on local subvoxel-shifts. Magn Reson Med. 2016;76(5):1574-1581.
[12] Andersson JLR, Sotiropoulos SN. An integrated approach to correction for off-resonance effects and subject movement in diffusion MR imaging. Neuroimage. 2016;125:1063–1078.
[13] Andersson JLR, Graham MS, Drobnjak I, et al. Towards a comprehensive framework for movement and distortion correction of diffusion MR images: Within volume movement. Neuroimage. 2017;152:450-466.
[14] Andersson JLR, Graham MS, Zsoldos E, et al. Incorporating outlier detection and replacement into a non-parametric framework for movement and distortion correction of diffusion MR images. Neuroimage. 2016;141:556-572.
[15] Leemans A, Jones DK. The B-matrix must be rotated when correcting for subject motion in DTI data. Magn Reson Med. 2009;61(6):1336–1349.
[16] Schilling KG, Blaber J, Hansen C, et al. Distortion correction of diffusion weighted MRI without reverse phase-encoding scans or field-maps. PLoS One. 2020;15(7):e0236418.
[17] Dhollander T, Mito R, Raffelt D, et al. Improved white matter response function estimation for 3-tissue constrained spherical deconvolution. 27th International Society of Magnetic Resonance in Medicine; Montréal, QC, Canada, 2019.
[18] Newman BT, Dhollander T, Reynier KA, et al. Test–retest reliability and long-term stability of three-tissue constrained spherical deconvolution methods for analyzing diffusion MRI data. Magnetic Resonance in Medicine. 2020;84(4):2161-2173.
[19] Fischl B. FreeSurfer. Neuroimage. 2012;62(2):774–781.
[20] Desikan RS, Segonne F, Fischl B, et al. An automated labeling system for subdividing the human cerebral cortex on MRI scans into gyral based regions of interest. Neuroimage. 2006;31(3):968–980.
[21] Nosarti C, Giouroukou E, Healy E, et al. Grey and white matter distribution in very preterm adolescents mediates neurodevelopmental outcome. Brain. 2008;131(Pt 1):205-217.
[22] Thompson DK, Matthews LG, Alexander B, et al. Tracking regional brain growth up to age 13 in children born term and very preterm. Nat Commun. 2020;11(1):696.
Figures