2050
Characterizing axonal and myelin microstructure development across early childhood using NODDI and qihMT1Department of Radiology, University of Calgary, Calgary, AB, Canada, 2Telethon Kids Institute, The University of Western Australia, Perth, Australia, 3Department of Neuroscience, University of Calgary, Calgary, AB, Canada, 4GE Healthcare, Calgary, AB, Canada
Synopsis
There is a need to better understand white matter development across early childhood, as it is a time of rapid brain development that supports ongoing cognitive and behavioral maturation. Here, we aimed to apply NODDI and qihMT techniques longitudinally to provide a more specific understanding of early brain development. Consistent with diffusion MRI research, these advanced diffusion and non-diffusion methods indicated earlier development of central tracts compared to more peripheral regions. NODDI and qiHMT metrics demonstrate that white matter development during early childhood is dominated by increasing axon density, alongside ongoing myelination and slightly decreasing axon coherence.
Introduction
White matter develops rapidly across early childhood and into adolescence and young adulthood, as shown by a comprehensive body of diffusion MRI research demonstrating increases in FA and reductions of MD.1-4 Advanced dMRI methods and analysis techniques (e.g., neurite orientation dispersion and density imaging (NODDI)), and non-diffusion imaging techniques (e.g., myelin water imaging, inhomogeneous magnetization transfer (ihMT)) offer increased specificity to different microstructural components.Neurite density index (NDI) from NODDI appears to be more sensitive to age-related changes than FA and MD,5 with increases during late childhood and adolescence suggesting white matter development at this time is dominated by increased axon density and myelination.5-9 Myelin water imaging studies show rapid myelination in infants and young children (up to 6 years old) following familiar spatial patterns of central‐to‐peripheral and posterior‐to‐anterior development.10-12 In late-childhood to adolescence, one study observed no relationships between ihMT and age, suggesting that myelination is not driving white matter development during later childhood.13
However, the development of qihMT (specific to myelin in the brain) has not been examined across early childhood, and most existing NODDI studies are cross-sectional, across a wide age range, and/or focused on older children.5-9,14 There is a need to better understand white matter development across early childhood, as it is a time of rapid brain development that supports ongoing cognitive and behavioral maturation. Here, we aimed to apply NODDI and qihMT techniques longitudinally to provide a more specific understanding of early brain development.
Methods
Participants were scanned longitudinally using the same 32-channel head coil on a GE 3T Discovery MR750w (GE, Milwaukee, WI) system at Alberta Children’s Hospital. NODDI data (b750 and b2000) were available for 191 scans on 85 typically developing children aged 2.4 – 8.0 years (44 female/41 male; 1-11 scans for each participant, average = 2.2 scans/participant, SD = 1.68). The DTI preprocessing pipeline included removal of motion and artifact corrupted volumes by visually quality checking, signal drift correction, eddy current and motion corrections, and registration to TI images (resliced to 1mm isotropic voxels).15 DTI scans were normalised to account for TR/TE differences between the b=750 s/mm2 and b=2000 s/mm2 scans,16 following which NODDI processing was performed in the NODDI Matlab toolbox for calculation of isotropic (fiso) and intracellular (ficvf, or NDI) volume fractions and ODI.17High quality ihMT data was also available for 129 scans on 76 of these children (38 female/38 male). Volumes within each individual’s ihMT scan were co-registered to the middle volume using MCFLIRT,18 and qihMT and MTR image maps were calculated,19 brain extracted,20 and then warped to the DTI FA map using ANTs.21
Semi-automated tractography was undertaken on the b750 DTI data as per previous methods.4 NDI, ODI, and qihMT values for each white matter tract were extracted using binary masks of the tracts delineated. Linear mixed effects models (y = age + sex + age*sex + (1|subject)) were run in RStudio 1.1.46322 to determine the developmental trajectories of these metrics for each tract.
Results
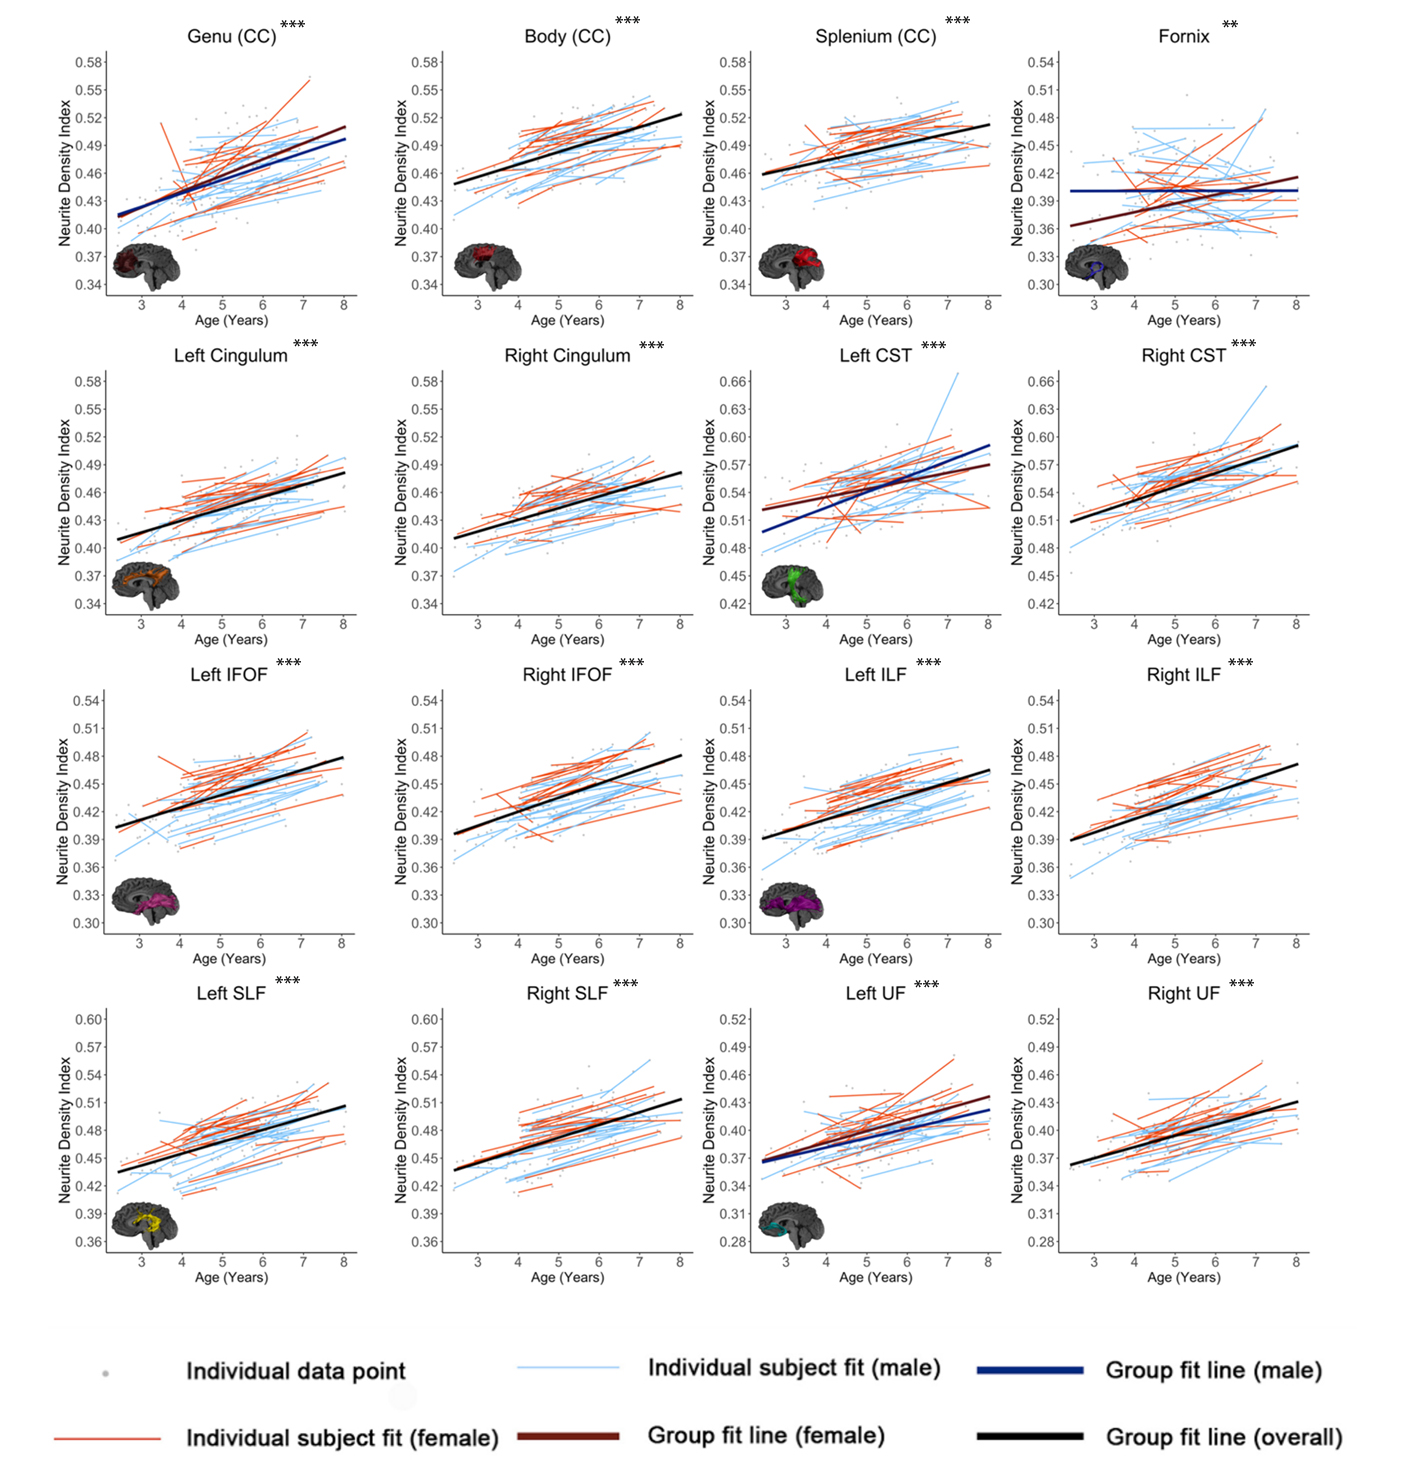
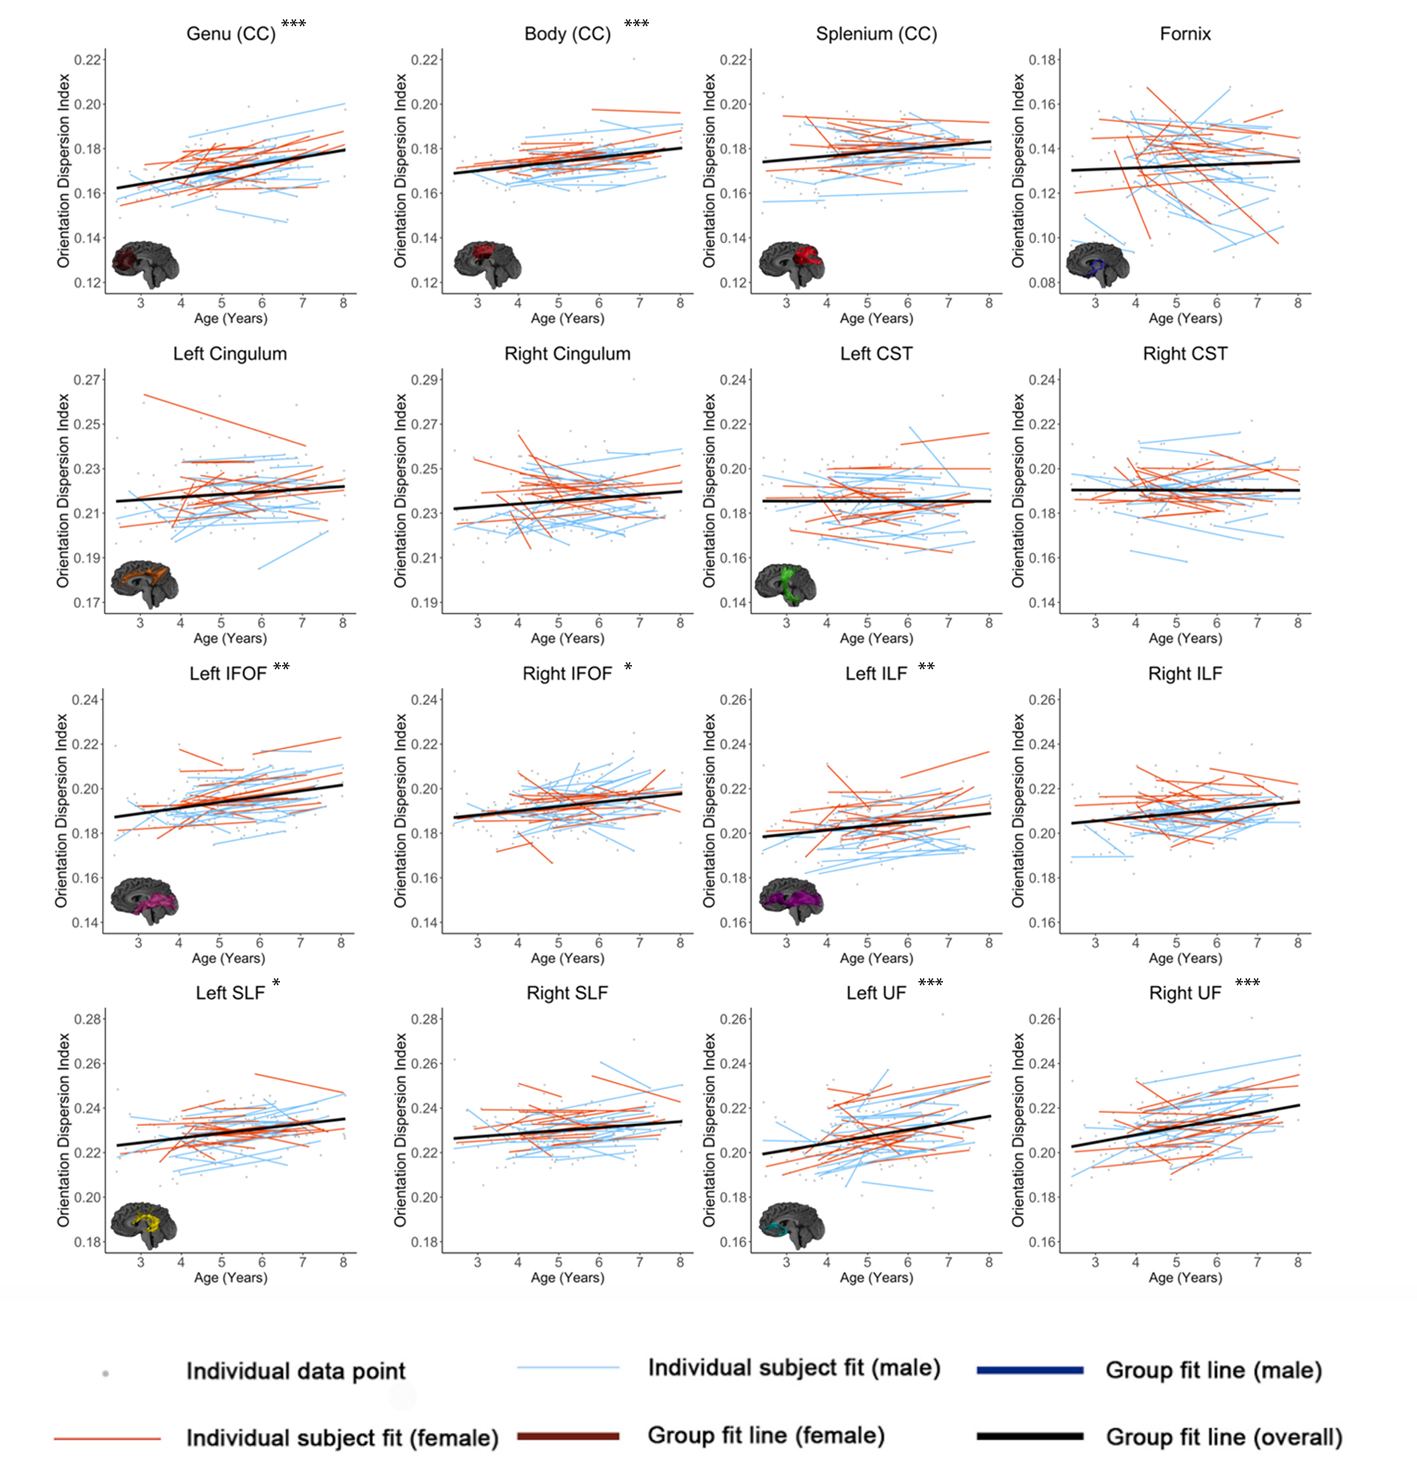
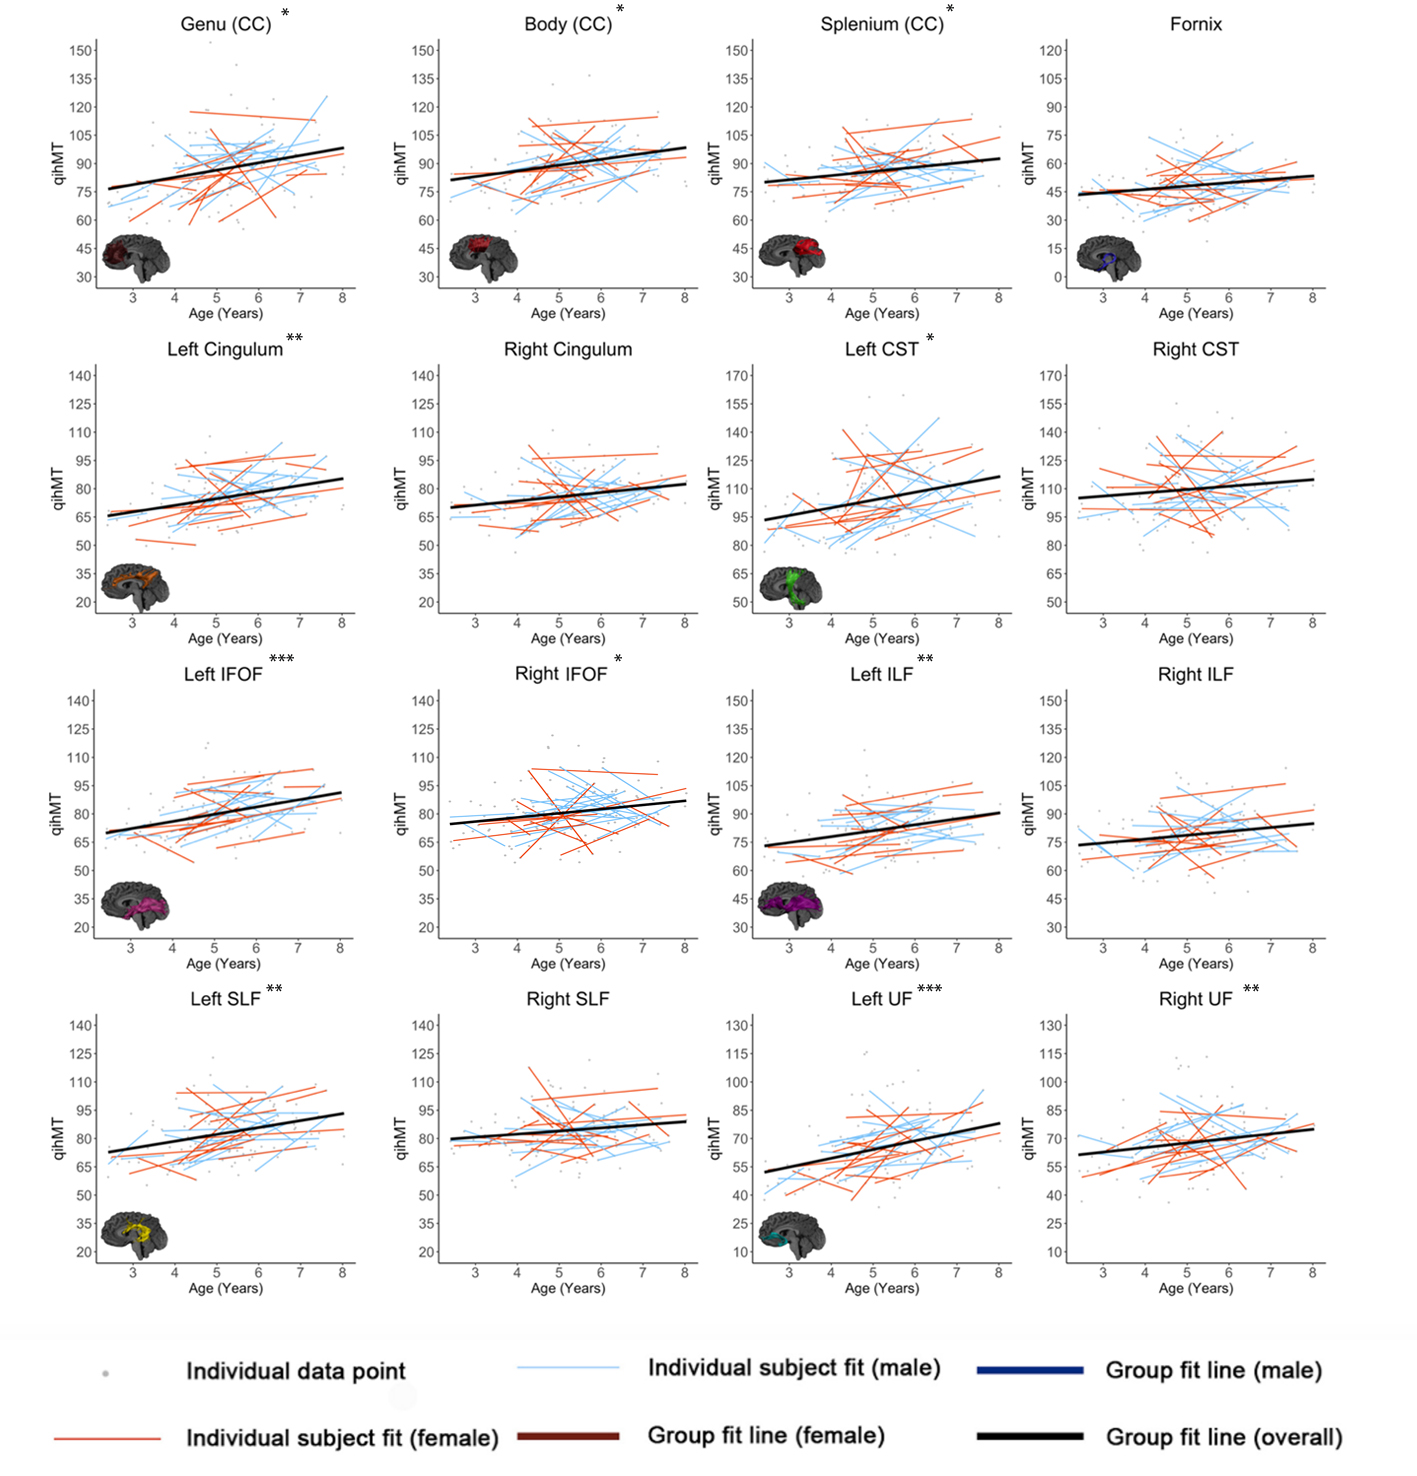
Figures 1-3 show developmental trajectories for NDI, ODI, and qihMT for white matter tracts across the brain. All tracts showed significant age-related increases of NDI (Figure 1). There were small age-related increases in ODI (Figure 2) in the Genu, Body, IFOF, ILF, SLF, and UF. Small increases in qihMT were observed, most notably in the left hemisphere (Figure 3).Discussion/Conclusions
We observed consistent, though small, increases of qihMT across childhood, suggesting ongoing myelination. Small increases of ODI in several tracts suggest decreased axon coherence, though these changes were very subtle, particularly when compared to NDI. Large increases of NDI were observed, suggesting increased axonal packing across this age range, consistent with previous literature.5-8 Taken together, these results show ongoing myelination and slightly decreasing axon coherence, but suggest that FA increases in early childhood are dominated by increased axon density. Similar spatial patterns were observed to previous studies, with earlier development of central tracts compared to more peripheral regions. Although the intercepts for each of the tracts were different relative to one another, tracts had very similar rates of increase (positive slopes) for NDI and qihMT when compared to each other suggesting that slower increases in FA across early childhood in the callosal and frontotemporal tracts may reflect slower changes in axon density across this age range. Age related increases in qihMT were predominantly identified in the left hemisphere. Although one study across this age range did not identify hemispheric differences in myelination,23 a DTI study assessing changes in white matter microstructure in participants aged 4 -11 found greater changes in the left hemisphere2 and one study of adolescents found myelin volume fraction increases were greater in the left hemisphere when compared to the right13 suggesting the possibility of asymmetry of myelination across development. In conclusion, our results comprehensively map the specific contributions to white matter development during early childhood, providing data that could be used to examine deviations from typical development in children.Acknowledgements
This work was supported by the Canadian Institutes of Health Research (funding reference numbers IHD-134090, MOP-136797, New Investigator Award to C.L) and a grant from the Alberta Children's Hospital Foundation. J.E.R was supported by an Eyes High University of Calgary Postdoctoral Scholarship, a T. Chen Fong Postdoctoral Fellowship in Medical Imaging Science, and a Canadian Institutes of Health Research Postdoctoral Fellowship (MFE-164703). E.T was supported by an NSERC Undergraduate Student Research Award. B.L.G was supported by an NSERC PGS-D, and the NSERC BRAIN CREATE program.References
1. Dubois J, Dehaene-Lambertz G, Kulikova S, et al. The early development of brain white matter: a review of imaging studies in fetuses, newborns and infants. Neuroscience. 2014;276:48-71.
2. Krogsrud SK, Fjell AM, Tamnes CK, et al. Changes in white matter microstructure in the developing brain – a longitudinal diffusion tensor imaging study of children from 4 to 11years of age. NeuroImage. 2016;124:473-486.
3. Paydar A, Fieremans E, Nwankwo JI, et al. Diffusional kurtosis imaging of the developing brain. Am J Neuroradiol. 2014;35(4):808-814.
4. Reynolds JE, Grohs MN, Dewey D, et al. Global and regional white matter development in early childhood. NeuroImage. 2019;196:49-58.
5. Genc S, Malpas CB, Holland SK, et al. Neurite density index is sensitive to age related differences in the developing brain. NeuroImage. 2017;148:373-380.
6. Chang YS, Owen JP, Pojman NJ, et al. White matter changes of neurite density and fiber orientation dispersion during human brain maturation. PLOS ONE. 2015;10(6):e0123656.
7. Dimond D, Heo S, Ip A, et al. Maturation and interhemispheric asymmetry in neurite density and orientation dispersion in early childhood. NeuroImage. 2020;221:117168.
8. Lynch KM, Cabeen RP, Toga AW, et al. Magnitude and timing of major white matter tract maturation from infancy through adolescence with NODDI. NeuroImage. 2020;212:116672.
9. Mah A, Geeraert B, Lebel C. Detailing neuroanatomical development in late childhood and early adolescence using NODDI. PLOS ONE. 2017;12(8):e0182340.
10. Dean III DC, O'Muircheartaigh J, Dirks H, et al. Estimating the age of healthy infants from quantitative myelin water fraction maps. Hum Brain Mapp. 2015;36(4):1233-44.
11. Dean DC, O'Muircheartaigh J, Dirks H, et al. Mapping an index of the myelin g-ratio in infants using magnetic resonance imaging. NeuroImage. 2016;132:225-37.
12. Deoni SCL, Dean DC, O'Muircheartaigh J, et al. Investigating white matter development in infancy and early childhood using myelin water faction and relaxation time mapping. NeuroImage. 2012;63(3):1038-1053.
13. Geeraert BL, Lebel RM, Lebel C. A multiparametric analysis of white matter maturation during late childhood and adolescence. Hum Brain Mapp. 2019;40(15):4345-56.
14. Jelescu IO, Veraart J, Adisetiyo V, et al. One diffusion acquisition and different white matter models: how does microstructure change in human early development based on WMTI and NODDI? NeuroImage. 2015;107:242-256.
15. Leemans AJ, Jeurissen B, Sijbers J, et al. ExploreDTI: a graphical toolbox for processing, analyzing, and visualizing diffusion MR data. Proc Intl Soc Mag Reson Med. 2009;17(1):3537.
16. Owen JP, Chang YS, Pojman NJ, et al. Aberrant white matter microstructure in children with 16p11.2 deletions. J Neurosci. 2014;34(18):6214-6223.
17. Zhang H, Schneider T, Wheeler-Kingshott CA, et al. NODDI: Practical in vivo neurite orientation dispersion and density imaging of the human brain. NeuroImage. 2012;61(4):1000-1016.
18. Smith SM, Jenkinson M, Woolrich MW, et al. Advances in functional and structural MR image analysis and implementation as FSL. NeuroImage. 2004;23:S208-S19.
19. Geeraert BL, Lebel RM, Mah AC, et al. A comparison of inhomogeneous magnetization transfer, myelin volume fraction, and diffusion tensor imaging measures in healthy children. NeuroImage. 2018;182:343-350.
20. Smith SM. Fast robust automated brain extraction. Hum Brain Mapp. 2002;17(3):143-155.
21. Avants BB, Tustison N, Song G. Advanced normalization tools (ANTS). Insight j. 2009;2(365):1-35.
22. RStudio Team. RStudio: Integrated Development for R. Boston, MA: RStudio, Inc.; 2016.
23. Deoni SCL, Mercure E, Blasi A, et al. Mapping infant brain myelination with magnetic resonance imaging. J Neurosci. 2011;31(2):784-791.
Figures