2047
Microstructural alterations in the white matter of children with dyslexia assessed by multi-fascicle diffusion compartment imaging1ICTEAM, UCLouvain, Louvain-la-Neuve, Belgium, 2IPSY, UCLouvain, Louvain-la-Neuve, Belgium, 3IoNS, UCLouvain, Brussels, Belgium
Synopsis
Dyslexia is a deviant development of both reading and spelling abilities affecting 5-12 % of children, yet the microstructural changes it induces in the white matter (WM) remain incompletely understood. This study analyzed multi-shell diffusion MRI on a population of 17 dyslexic children and 18 controls. Advanced models (Diamond & Microstructure Fingerprinting), able to separately characterize intersecting fascicles within a voxel, obtained stronger correlations with children's reading and spelling performances than traditional DTI and showed increased sensitivity. The novel indices, obtained from these models, suggested refined interpretations of the microstructural characteristics of dyslexia in WM pathways.
Purpose
Dyslexia is characterized by a deviant development of both reading and spelling abilities and affects 5-12% of children in elementary school1. Since it probes the microstructural diffusion of water in the tissues, diffusion-weighted MRI (DW-MRI) can provide insight into the microstructural underpinnings of dyslexia in the white matter (WM). Most DW-MRI studies of dyslexia have relied on the diffusion tensor imaging (DTI) model and found alterations in WM tracts of the left hemisphere involved in literacy, phonological and orthographic processing, as well as in tracts of the right hemisphere2.DTI is, however, limited in its ability to characterize fibers in area of crossing fascicles, as is overwhelmingly the case in the WM regions linked to dyslexia. This study addresses this limitation by leveraging high-quality multi-shell, high-gradient DW-MRI data in a population of dyslexic children and controls, analyzed with two advanced models of the WM microstructure: Diamond3 and Microstructure Fingerprinting (MF)4. These models provide indices specific to each of the fascicles intersecting in a voxel and were used to refine the interpretation of DTI results and increase sensitivity to microstructural differences.
Methods
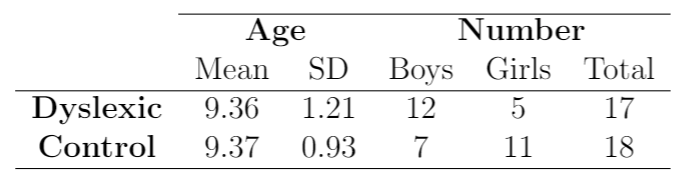
Data acquisition17 children with dyslexia and 18 age-matched healthy controls (Table 1) underwent DW-MRI on a 3T GE SIGNA Premier scanner (GE Healthcare, Chicago, IL) with the following parameters : TR=4842 ms, TE=77 ms, 2 mm isotropic voxels (in-plane FOV: 220x220 mm²), $$$\Delta=\,$$$35.7 ms, $$$\delta=\,$$$22.9 ms, 64 gradients at b=1000, 32 at b=2000,3000,5000 s/mm², corresponding to diffusion gradients up to 68.9 mT/m, and 7 interspersed b0 images. Preprocessing included thermal denoising5, Gibbs ringing correction6, eddy-current distortion and movement correction7. A 3D T1 image (TE=2.96ms, TR=2188.16ms, TI=900ms, FA=8°, 156 slices, 1mm isotropic, in-plane FOV: 256x256mm²) was also acquired.
Participants' spelling and reading abilities were assessed using clinical standardized tasks in French8.
Data analysis
In each voxel, DTI-derived fractional anisotropy (FA) and mean/radial/axial diffusivity (MD/RD/AD) were computed.
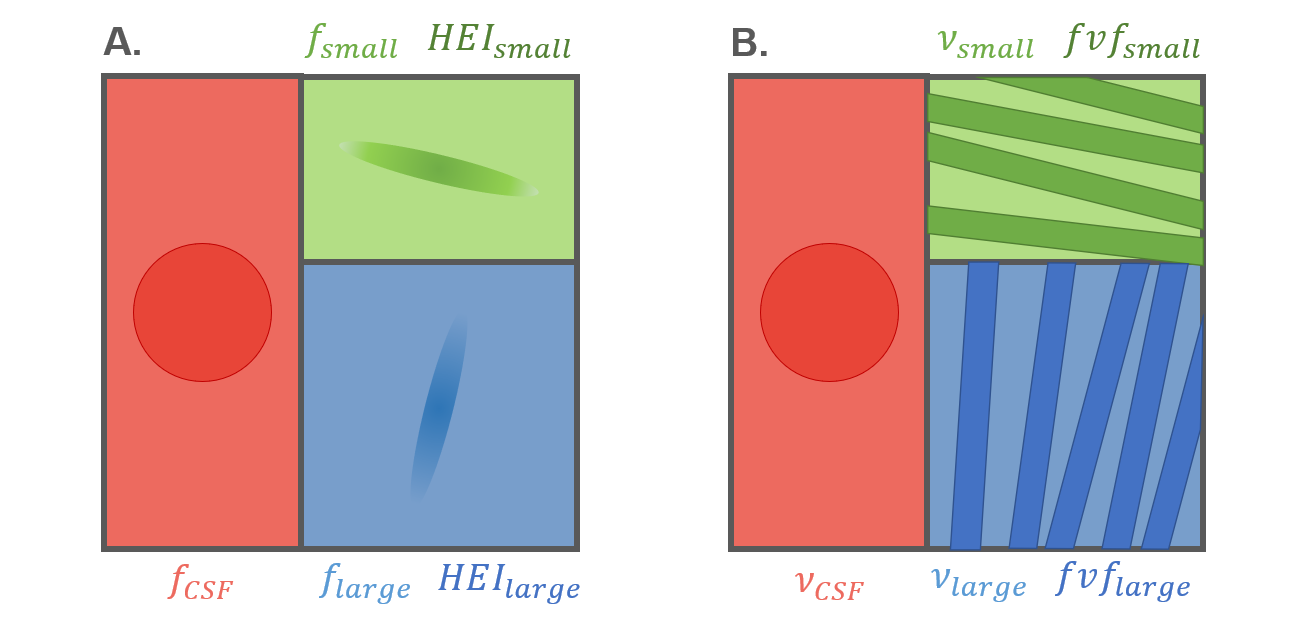
As illustrated in Figure 1, Diamond provided the NMR-apparent signal fractions $$$f_{large}\,$$$and$$$\,f_{small}$$$ of each fascicle (by definition $$$f_{small}\leq f_{large}$$$) and fascicle-specific properties such as a heterogeneity index $$$HEI_{large,small}$$$ and DTI-like metrics $$$FA_{large,small},MD_{large,small},RD_{large,small},AD_{large,small}$$$.
Similarly, MF provided (T2-weighted) occupancy fractions $$$\nu_{large,small}$$$ and fascicle-specific fiber volume fraction (representing axonal density) $$$fvf_{large,small}$$$ and extra-axonal diffusivity $$$D^{ex}_{large,small}$$$. Both models accounted for partial voluming via a cerebrospinal fluid (CSF) contribution.
For each fascicle-specific metric$$$\,M,\,$$$a voxel-wide weighted average$$$\,wM\,$$$was defined as $$wM=\frac{w_{small}M_{small} + w_{large}M_{large}}{w_{small}+w_{large}},$$with $$$w$$$ being $$$f$$$ for Diamond and $$$\nu$$$ for MF.
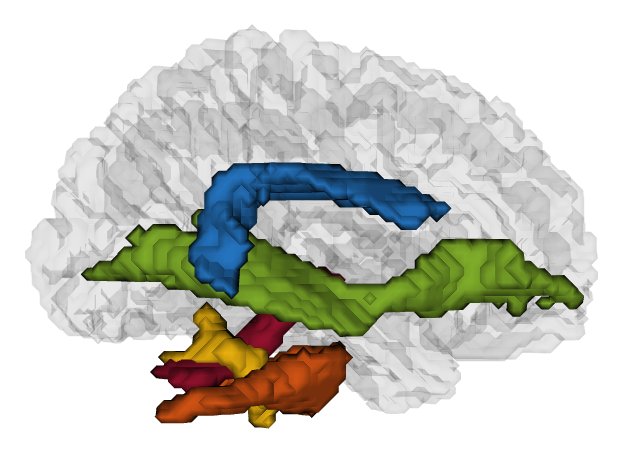
From FSL’s probabilistic white matter and cerebellar atlases9 and the NatBrainLab10 atlases, several regions of interest (ROIs) were identified: the posterior, anterior and long segments11 of the arcuate fasciculus (AF, involved in literacy), the inferior fronto-occipital fasciculi (IFOF, ventral orthographic pathway), the 3 superior longitudinal fasciculus segments (SLF I-III, dorsal phonological pathway). Because of their suspected causal implication in developmental dyslexia12, the cerebellar pedunculi (CP) and the cerebellum were also examined. The ROIs (displayed in Figure 2) were registered to each patient’s native space, thresholded and intersected with a WM mask obtained from segmenting the T113.
The mean of each metric was computed in every ROI and a two-tailed t-test corrected for ROI size and subject age was performed to detect differences between controls and dyslexic children with a significance level of 0.05.
Results
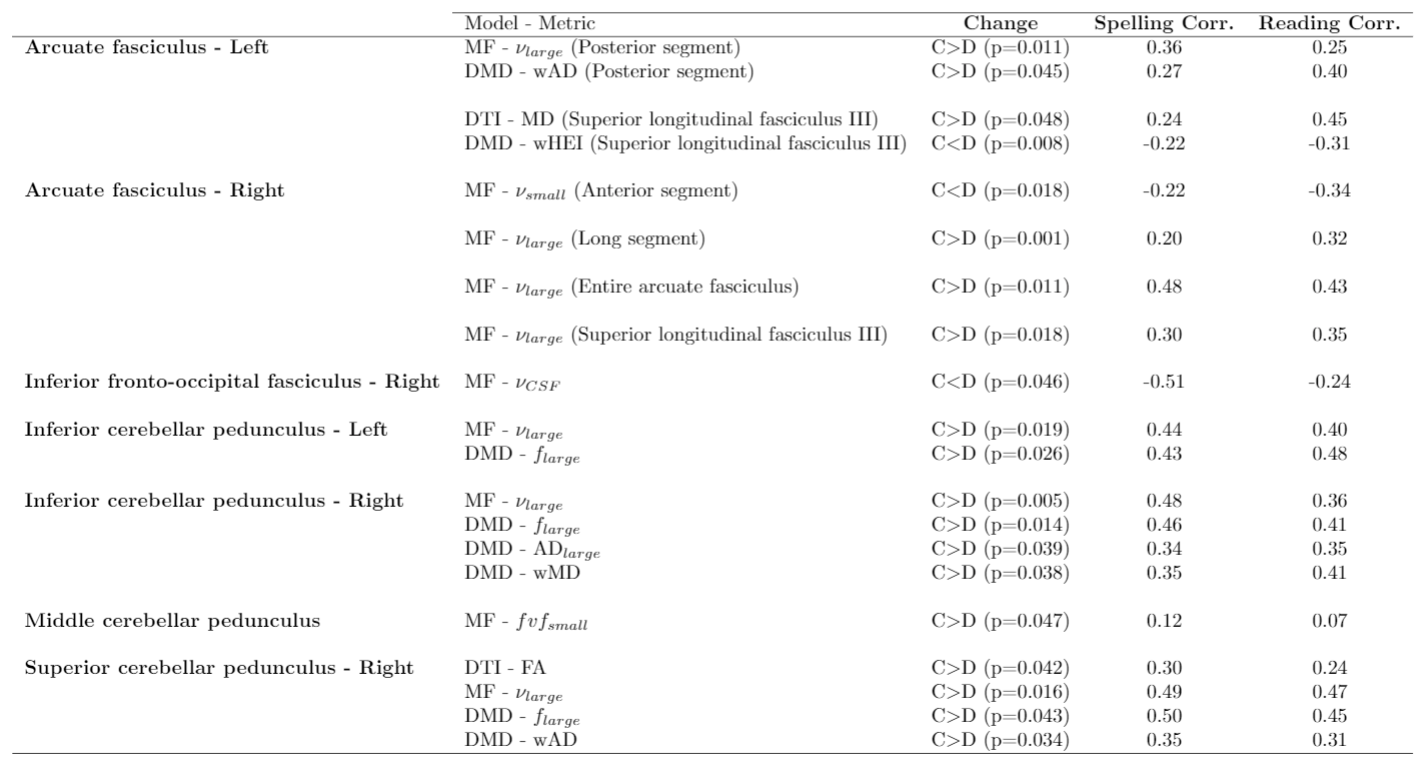
DTI indices only varied in the right superior CP (decreased FA for dyslexic patients) and left SLF-III (decreased MD).Diamond and MF detected a wider range of variations with the most recurring change being a larger $$$f_{large}$$$ and $$$\nu_{large}$$$ for controls in the AF and CP, which correlated with reading and spelling performances. MF’s $$$\nu_{large}$$$ also displayed this trend in the right SLF-II and III.
Overall, more inter-population changes were observed in the right hemisphere.
Table 2 shows the statistically significant differences in the mentioned ROIs, except the differences found in the cerebellum. The trends were different in the cerebellum ROIs where dyslexic patients generally showed a decreased MD,RD,AD with DTI and decreased wMD,wRD,wAD with Diamond.
Discussion
Although traditional DTI indices did vary in WM tracts involved in phonological and orthographic functions, multi-fascicle models detected differences in more ROIs and more strongly correlated with spelling and reading tests, suggesting an improved sensitivity.The results of Diamond and MF suggest a reorganization of WM fibers in the ROIs rather than morphological differences of the axons within each fascicle, as few fascicle-specific metrics changed while important differences were observed in the fractions$$$\,f$$$ and $$$\nu$$$. These results hint towards dyslexic patients having a less dominant main tract and more secondary fibers in the considered ROIs.
The patterns observed in the cerebellum were less directly interpretable, in part because the associated ROIs likely contained more gray matter, which our models were not designed for.
This study suggests the potential of advanced microstructural modeling for the finer interpretation of the biophysical processes at play in dyslexia. On a broader scale, looking at neuropathologies through the scope of multiple models with the addition of behavioral results could improve our understanding of the microstructural impact of said pathologies and shine a light on the biological reasons behind the results obtained with DTI.
Acknowledgements
No acknowledgement found.References
1. Snowling, M.J. (2000). Dyslexia: Wiley.
2. Banfi, C., Koschutnig, K., Moll, K., Schulte-Korne, G., Fink, A., and Landerl, K. (2019). White matter alterations and tract lateralizationin children with dyslexia and isolated spelling deficits. Human Brain Mapp.,40:765–776. DOI: 10.1002/hbm.24410
3. Scherrer, B., Schwartzman, A., Taquet, M., Sahin, M., Prabhu, S., and Warfield, S.K.. (2015). Characterizing brain tissue by assessment of the distribution of anisotropic microstructual environments in diffusion-compartment imaging (diamond). Magnetic Resonance in Imaging, 76(3):963–77. http: //onlinelibrary.wiley.com/doi/10.1002/mrm.25912/abstract.
4. Rensonnet, G., Scherrer, B., Girard, G., Jankovski, A., Warfield, S. K., Macq, B.,Thiran, J-P., Taquet, M. (2019). Towards microstructure fingerprinting: Estimation of tissue properties from a dictionary of Monte Carlo diffusion MRI simulations. NeuroImage, 184: 964-980. https://doi.org/10.1016/j.neuroimage.2018.09.076.
5. Veraart, J., Novikov, D.S., Christiaens, D., Ades-Aron, B., Sijbers, J. and Fieremans, E. (2016). Denoising of diffusion MRI using random matrix theory. Neuroimage, 142:394-406.
6. Kellner, E., Dhital, B., Kiselev, V.G. and Reisert, M.. (2016). Gibbs‐ringing artifact removal based on local subvoxel‐shifts. Magnetic resonance in medicine, 76(5):1574-1581.
7. Andersson, J.L. and Sotiropoulos, S.N. (2016). An integrated approach to correction for off-resonance effects and subject movement in diffusion MR imaging. Neuroimage, 125:1063-1078.
8. Jacquier-Roux M., Lequette Ch., Pouget G., Valdois S., Zorman M. (2010). BALE : Batterie analytique du langage écrit. Laboratoire de Psychologie et Neurocognition CNRS
9. Diedrichsen, J., Balster, J.H., Cussans, E., Ramnani, N. (2009). A probabilistic MR atlas of the human cerebellum. Neuroimage.
10. Catani, M., Thiebaut de Schotten, M. (2008). A diffusion tensor atlas for virtual in vivo dissections. Cortex, 44(8):1105-1132. doi: 10.1016/j.cortex.2008.05.004
11. Catani, M., Jones, D.K., Ffytche, D.H.. (2005). Perisylvian language networks of the human brain. Ann. Neurol. 57:8–16.
12. Nicolson, R.I., Fawcett, A.J. and Dean, P. (2001). Developmental dyslexia: the cerebellar deficit hypothesis. Trends in neurosciences, 24(9):508-511.
13. Zhang, Y., Brady, M. and Smith, S. (2001). Segmentation of Brain MR Images Through a Hidden Markov Random Field Model and the Expectation-Maximization Algorithm IEEE Transactions on Medical Imaging, 20(1): 45-56.
Figures