2046
Tissue Microstructural Changes following Four-Week Neurocognitive Training: Observations of Double Diffusion Encoding MRI
Xinnan Li1, Daisuke Sawamura2, Hiroyuki Hamaguchi1, Yuta Urushibata3, Thorsten Feiweier4, Keita Ogawa5, and Khin Khin Tha1,6
1Department of Biomarker Imaging Science, Graduate School of Biomedical Science and Engineering, Hokkaido University, Sapporo, Japan, 2Department of Functioning and Disability, Faculty of Health Sciences, Hokkaido University, Sapporo, Japan, 3Siemens Healthcare K.K., Tokyo, Japan, 4Siemens Healthcare GmbH, Erlangen, Germany, 5Department of Rehabilitation, Hokkaido University Hospital, Sapporo, Japan, 6Global Center for Biomedical Science and Engineering, Faculty of Medicine, Hokkaido University, Sapporo, Japan
1Department of Biomarker Imaging Science, Graduate School of Biomedical Science and Engineering, Hokkaido University, Sapporo, Japan, 2Department of Functioning and Disability, Faculty of Health Sciences, Hokkaido University, Sapporo, Japan, 3Siemens Healthcare K.K., Tokyo, Japan, 4Siemens Healthcare GmbH, Erlangen, Germany, 5Department of Rehabilitation, Hokkaido University Hospital, Sapporo, Japan, 6Global Center for Biomedical Science and Engineering, Faculty of Medicine, Hokkaido University, Sapporo, Japan
Synopsis
A four-week neurocognitive training of spatial attention and working memory was conducted in 21 volunteers. A change in tissue microstructure was tested by using double diffusion encoding MRI, which revealed a decrease in μFA in the left middle frontal gyrus. This decrease showed a significant negative correlation with the changes in the response time as assessed by the orienting attention network test.
Introduction
Improved cognitive performance by neurocognitive training has been reported in both normal and cognitively impaired individuals. This improvement has been thought of as due to neuroplastic changes1. Structural and functional MRI techniques are often applied as attempts to visualize these changes noninvasively and in vivo. So far, functional connectivity (FC) by resting-state functional MRI (rsfMRI) and fractional anisotropy (FA) by diffusion tensor imaging (DTI) have shown promising results1-3. Nevertheless, FA extracted by DTI has certain technical issues, such as failure to resolve fiber crossings.Double diffusion encoding (DDE) MRI is a recently developed MRI technique that employs multiple diffusion encoding schemes to map microscopic diffusion anisotropy without the conflating effects of orientation dispersion at the voxel scale4. The superiority of its major index - microscopic fractional anisotropy (μFA), over FA, in detecting age-related changes has been reported5.
This prospective study aimed to evaluate if μFA can map the neuroplastic changes following a four-week neurocognitive training of spatial attention and working memory.
Methods
A local institutional review board approved this study. Written informed consent was obtained from all participants. Twenty-one healthy subjects (12 men and 9 women; mean age= 27.7±6.0 years) were recruited to undergo a 4-week neurocognitive training of spatial attention (30-minute long attention network training task each day and 5 days/week) and working memory (another 30-minute dual N-back task each day and 5 days/week)2. The neurocognitive performance was evaluated twice before and after the training, using a set of neuropsychological tests. The brain MRI, including DDE MRI (prototype spin-echo EPI sequence, TR/TE=7000/84 ms, δ=12.2 ms, Δ=13.7 ms, b=800 s/mm2, number of diffusion directions=72, voxel size=1.5×1.5×4 mm3) and 3D-MPRAGE, was acquired using a 3T scanner (MAGNETOM Prisma, Siemens Healthcare, Erlangen, Germany) and a 64-channel head coil, at the timing of neuropsychological tests. Another eight healthy subjects who were age, gender, and education level-matched to the training group were also recruited to serve as the control. These subjects also underwent neuropsychological tests and MRI of the brain twice at an interval of 4-week but did not receive neurocognitive training. μFA, FA, and ADC maps were calculated from the DDE MRI data, and were further processed as detailed in Fig 1 to evaluate the training and time-related changes of these indices. A 2×2 mixed-design ANOVA was used for this purpose, and statistical significance was set as uncorrected P<0.001 for clusters>50 voxels. Statistically significant voxels, if any, were tested for correlation with changes in neurocognitive performance. For this purpose, Pearson’s product moment correlation analyses were used to determine significance at P<0.05. For all comparisons, age, gender, years of education, and the cerebrospinal fluid volume were taken as covariates.Results
The 2×2 mixed-design ANOVA revealed training and time-related change in μFA (F(4,50)=5.459, uncorrected P<0.001), which turned out on post-hoc analysis as a decrease in μFA in the left middle frontal gyrus (53 voxels; MNI coordinates: X=-36, Y=54, Z=-6) upon the training (Fig 2). FA and ADC did not show any statistically significant difference (Fig 3). This decrease in μFA showed significant negative correlation with the changes in the response time as assessed by the orienting attention network test - a neuropsychological test (r=-0.508, P=0.037) (Fig 4).Discussion
Our observation of μFA decrease in the left middle frontal gyrus upon neurocognitive training is thought to be due to axonal and dendritic pruning, a neurological regulatory process that facilitates changes in neural structure by reducing the overall number of neurons and synapses, leaving more efficient synaptic configurations6. Such pruning is known to occur, not only in children and adolescence, but also in adults. Lack of change in FA and ADC may imply that these indices are not as sensitive as μFA to detect these minute changes.The left middle frontal gyrus is a part of prefrontal cortex, which plays an important role in modulation of attention7. Our observation of the correlation between μFA of this region and the response time of the orienting attention network test is in agreement with previous reports which document structure-functional correlation between FA of white matter tracts and attention network test results8.
Conclusions
μFA by DDE MRI can become a sensitive marker to evaluate neuronal changes due to neurocognitive training.Acknowledgements
This study was supported by (i) the Global Institution for Collaborative Research and Education, Hokkaido University, Japan and (ii) the Grant-in-Aid for scientific research by the Japan Society for Promotion of Science (19K11317).References
- Chapman SB, Aslan S, Spence JS, Hart JJ Jr, Bartz EK, Didehbani N, Keebler MW, Gardner CM, Strain JF, DeFina LF, Lu H. Neural mechanisms of brain plasticity with complex cognitive training in healthy seniors. Cereb Cortex 2015; 25: 396-405.
- Sawamura D, Suzuki R, Ogawa K, Sakai S, Li X, Hamaguchi H, Tha KK. Combined Working Memory and Attention Training Improves Cognition via Task-Specific and Transfer Effects. Proc. Intl. Soc. Mag. Reson. Med 2020; 28: 1238.
- Nordvik JE, Schanke AK, Walhovd K, Fjell A, Grydeland H, Landrø NI. Exploring the relationship between white matter microstructure and working memory functioning following stroke: a single case study of computerized cognitive training. Neurocase 2012; 18: 139-151.
- Henriques RN, Palombo M, Jespersen SN, Shemesh N, Lundell H, Ianuş A. Double diffusion encoding and applications for biomedical imaging. J Neurosci Methods. 2020; 108989.
- Lawrenz M, Brassen S, Finsterbusch J. Microscopic diffusion anisotropy in the human brain: Age-related changes. Neuroimage 2016; 141: 313-325.
- Sakai J. Core Concept: How synaptic pruning shapes neural wiring during development and, possibly, in disease. PNAS 2020; 117: 16096-16099.
- Rossi AF, Pessoa L, Desimone R, Ungerleider LG. The prefrontal cortex and the executive control of attention. Exp Brain Res. 2009; 192: 489-497.
- Niogi S, Mukherjee P, Ghajar J, McCandliss BD. Individual Differences in Distinct Components of Attention are Linked to Anatomical Variations in Distinct White Matter Tracts. Front Neuroanat. 2010; 4: 2.
Figures
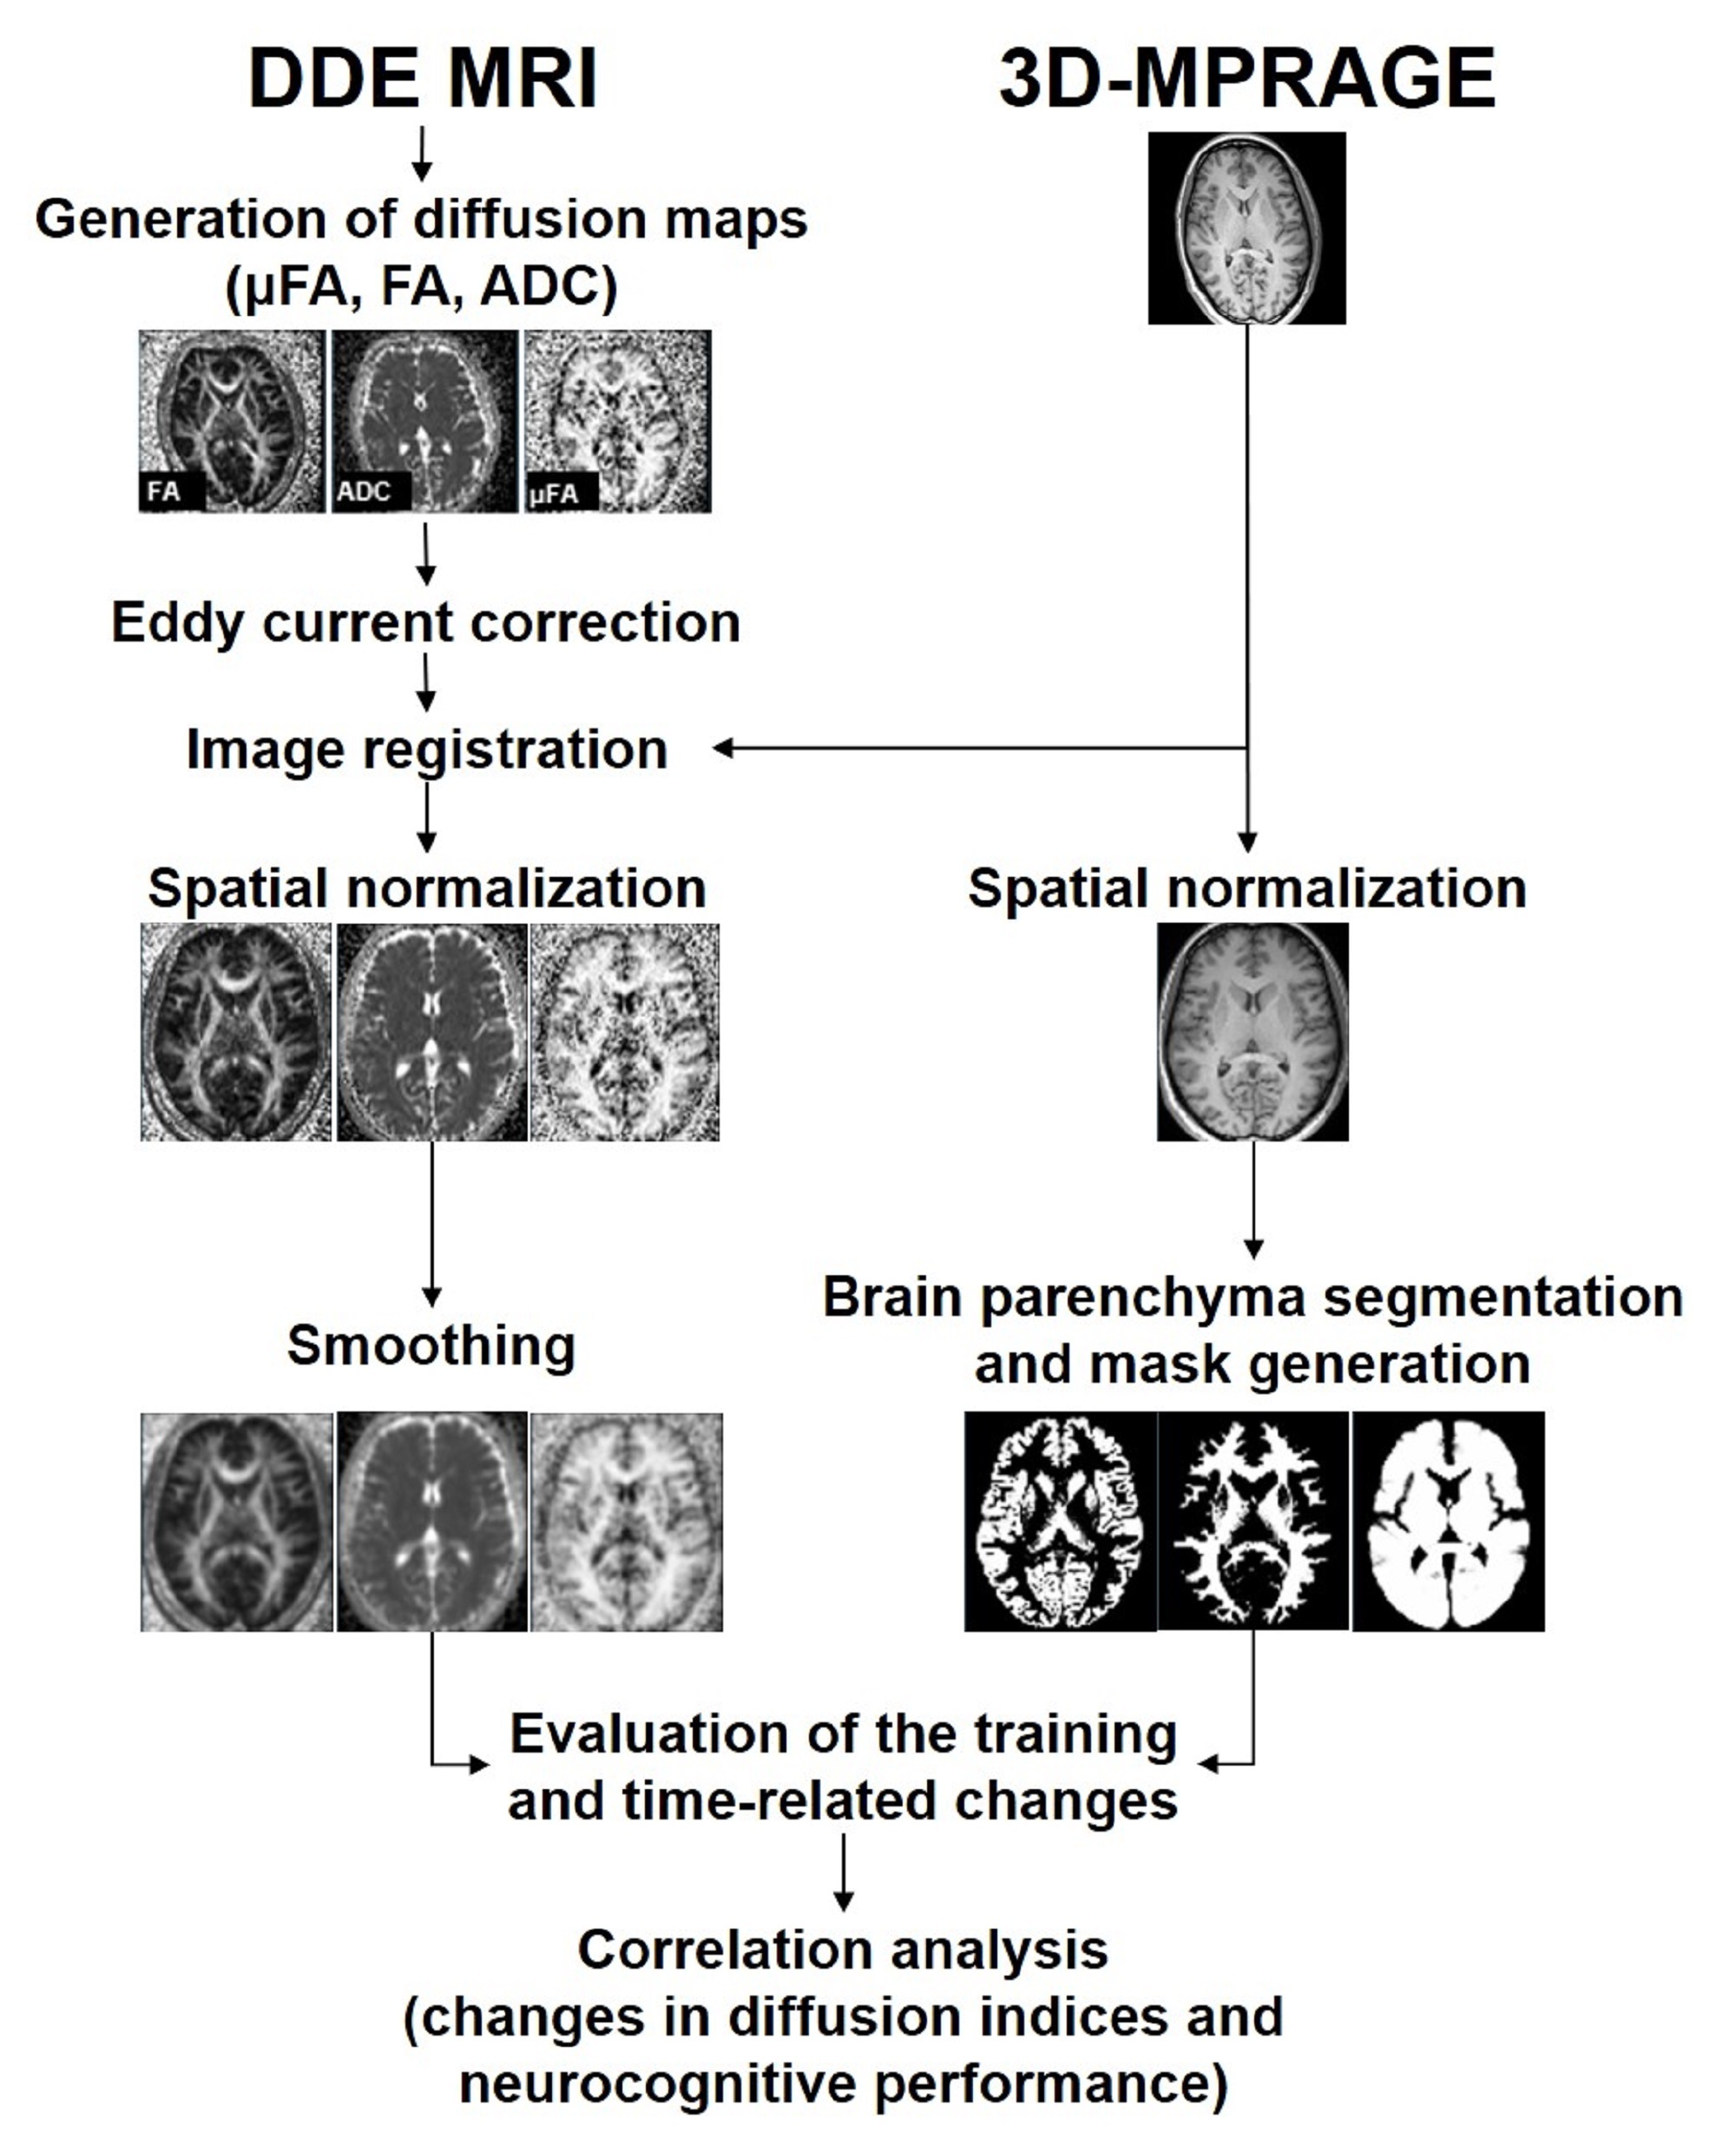
Image processing steps.
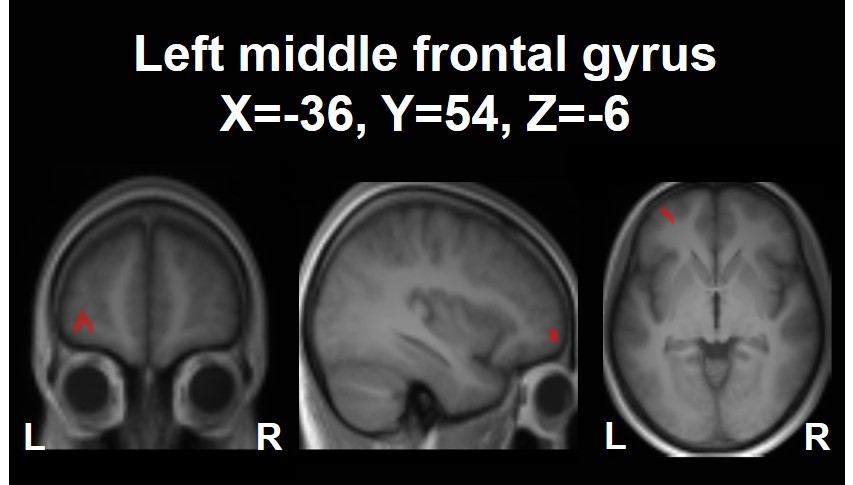
The cluster in the left middle frontal
gyrus (MNI
coordinates: X=-36, Y=54, Z=-6) showing a decrease in μFA upon the 4-week neurocognitive
training. The cluster is shown as an overlay on a 3D-MPRAGE template.
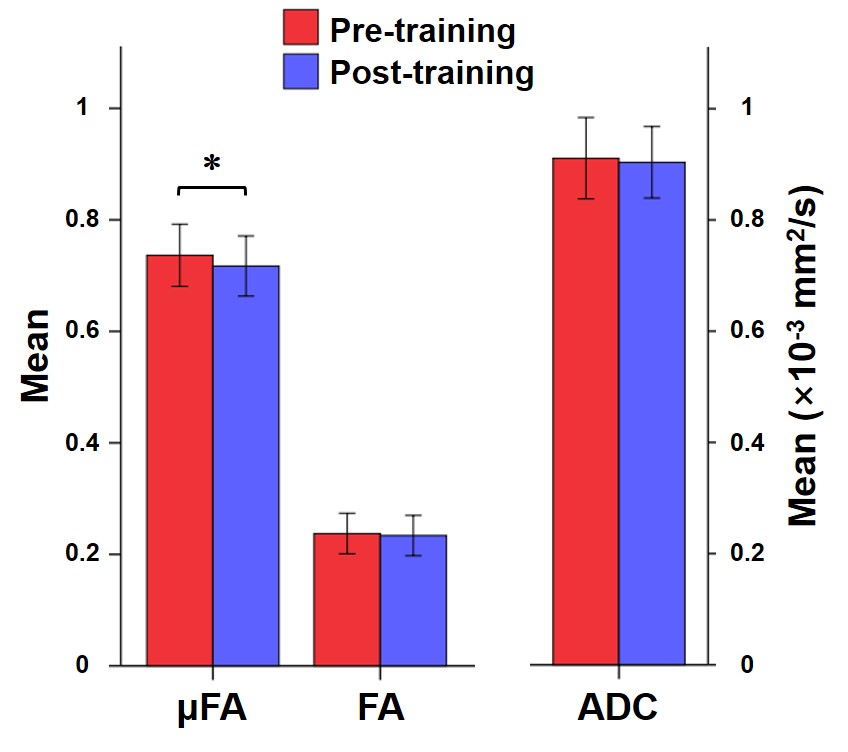
Bar diagrams showing μFA, FA, and ADC values of the cluster (left middle frontal gyrus) with
significant training effect. Error bars and brackets indicate standard deviation
and statistical significance (uncorrected P<0.001), respectively.
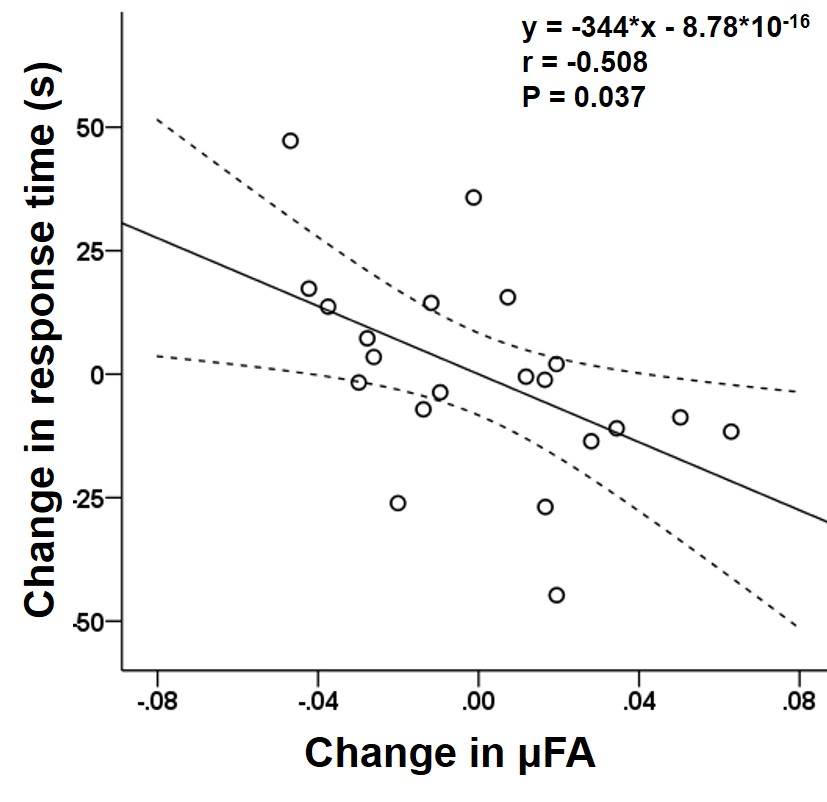
Scatterplots showing significant negative correlation between the change
in μFA of the left middle frontal gyrus and the changes in the response time as
assessed by the orienting attention network test (r=-0.508,
P=0.037). The straight and curved lines indicate the mean and 95% confidence
interval.