2044
Quantifying tissue microstructural changes associated with short-term learning using model-based diffusion MRI1Computer Science & Centre for Medical Image Computing, University College London, London, United Kingdom, 2Laboratoire de Psychopathologie et Neuropsychologie, Saint Denis, Paris 8 Vincennes - St Denis University, Paris, France, 3Neuropsychology and Functional Neuroimaging Research Group (UR2NF) at the Centre for Research in Cognition and Neurosciences (CRCN), Université Libre de Bruxelles, Brussels, Belgium, 4Cyclotron Research Centre, University of Liège, Liège, Belgium
Synopsis
We use model-based diffusion MRI to assess microstructural changes associated with short-term plasticity. Neuroplasticity changes are the foundation of experience. These mechanisms include microstructural rearrangements which can manifest even after short learning episodes. DTI has proven effective in highlighting such changes. However, the connection with the underlying microstructural processes remains speculative. Biophysical modelling can help interpreting such changes. We use NODDI and CHARMED models to examine MD changes obtained in a spatial navigation task. NODDI’s FWF and CHARMED’s hMD share similar cortical patterns of decrease as MD. FWF exhibited higher sensitivity than MD and hMD to capture microstructural changes.
Introduction
This work evaluates biophysical modelling approaches for assessing microstructural neuroplastic changes associated with short-term learning episodes.Neuroplasticity is the ability of the brain to adapt functionally and structurally as a result of cognitive experience1. Although, the neurobiological mechanisms at the heart of neuroplasticity are well established in animal models, their connection with learning processes in human is still unclear2.
Recently, diffusion MRI has proven particularly useful for tracking microstructural modifications linked to short-term plasticity3-7. In particular, changes of mean diffusivity (MD), a biomarker of tissue microstructure from diffusion tensor imaging (DTI), can be detected after learning episodes lasting a few tens of minutes. However, while sensitive to microstructural rearrangements, MD lacks specificity.
Biophysical modelling can help disentangle, and better characterize, the underlying microstructural changes. Accordingly Tavor et al.4 used the CHARMED model8,9 to interpret MD changes in pre-selected grey matter (GM) regions. However, CHARMED is conceived for white matter (WM) modelling, and thus unsuited for describing GM. An alternative to CHARMED is NODDI10, a biophysical model specifically designed to describe both WM and GM.
Here we examine GM microstructural underpinning of MD changes associated with a 45-minute learning episode on a spatial navigation task, using NODDI, with CHARMED included for comparison.
Materials and Methods
Learning paradigmA cohort of 47 subjects (gender-balanced; all right-handed) underwent two scanning sessions, before and after a spatial navigation task. The aim of the task was to learn a virtual city environment through exploration11-13. The total learning time was 45 minutes.
Data acquisition
The data was acquired on a 3T scanner (Magnetom Prisma, Siemens Medical Solutions, Erlangen, Germany). Diffusion weighted images were acquired within each session, with parameters: TR=7400ms, TE=69ms, resolution 2x2x2mm3, b=(650,1000,2000) s/mm2, number of gradient directions=15,30,60 and 13 interleaved b=0 images. A high-resolution T1w image was acquired within one of the scanning sessions, with parameters TR=1900ms, TE=2.19ms, FA=9deg, TI=900ms, voxel size=1x1x1mm³.
Biophysical modelling
A revised version of NODDI was used14,15, which addresses some of the model limitations when extended to GM16. This version was fitted to orientationally averaged data, providing estimates for the neurite density index (NDI) and the free water fraction (FWF).
CHARMED model was also fit to the data. Four parameters were estimated: parallel restricted diffusivity (RD//), restricted compartment fraction (fr), and the parallel and perpendicular diffusivities of the hindered compartment. The latter two parameters combine to estimate the hindered MD (hMD).
Both models were fitted using an in-house version of the NODDI Matlab toolbox.
Standard DTI analysis was also performed with DTI-compatible portion of the data (b-values up to 1000s/mm2).
Data Analysis
Previous works reported diffusion-derived parameter changes either in the hippocampus or in the neocortex3-7. We run a surface-based analysis to assess microstructural changes in the cortex. We assessed microstructural changes in the hippocampus via a ROI-based analysis.
Individual T1w images were used to segment subcortical regions and to define the mid-thickness surfaces17,18.
All the diffusion-derived maps were resampled into the T1w space and projected onto the mid-thickness surface. For each map, we tested vertex-wise whether there was a significant between-sessions difference (two-sample paired t-test). We used cluster-wise correction to control for multiple comparisons. We set the cluster-forming threshold at uncorrected p<0.001. We report clusters with pFWE <0.05.
We used the subcortical segmentation to compute the mean values of all the parameters separately in the left and right hippocampi. We used these values to test whether there was between-session difference (paired t-test).
Results and discussions
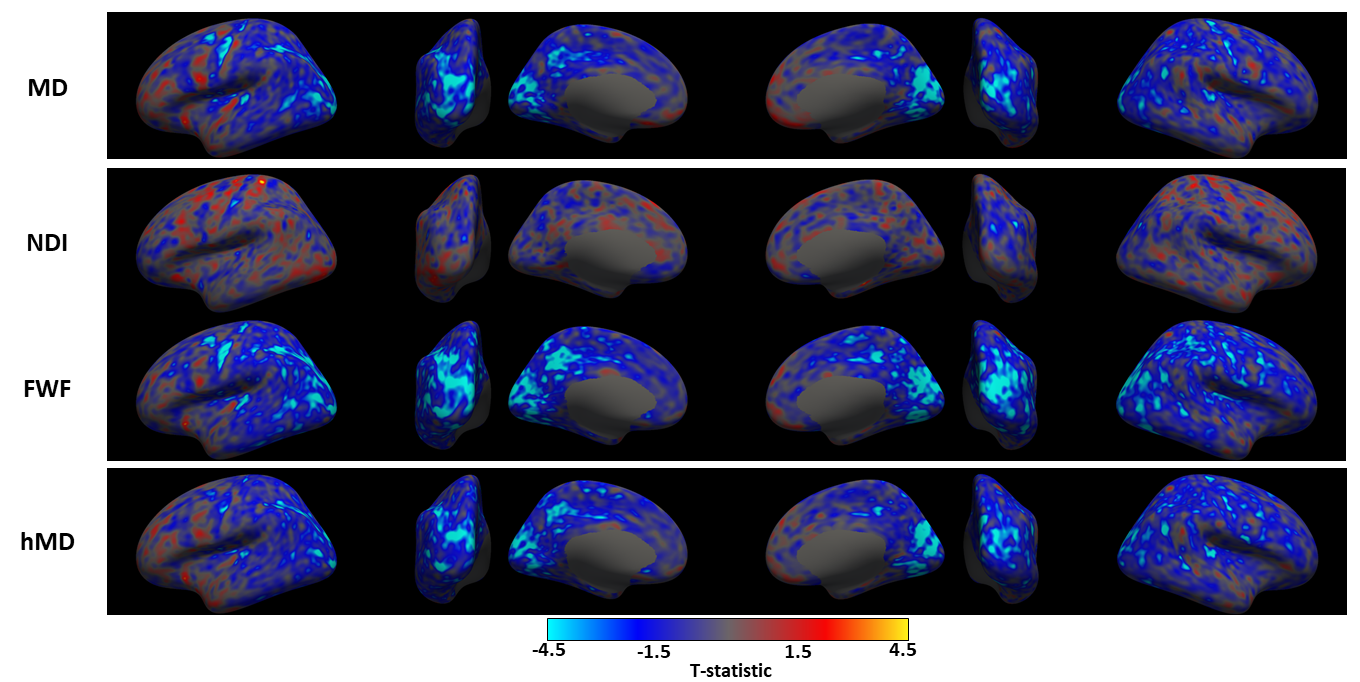
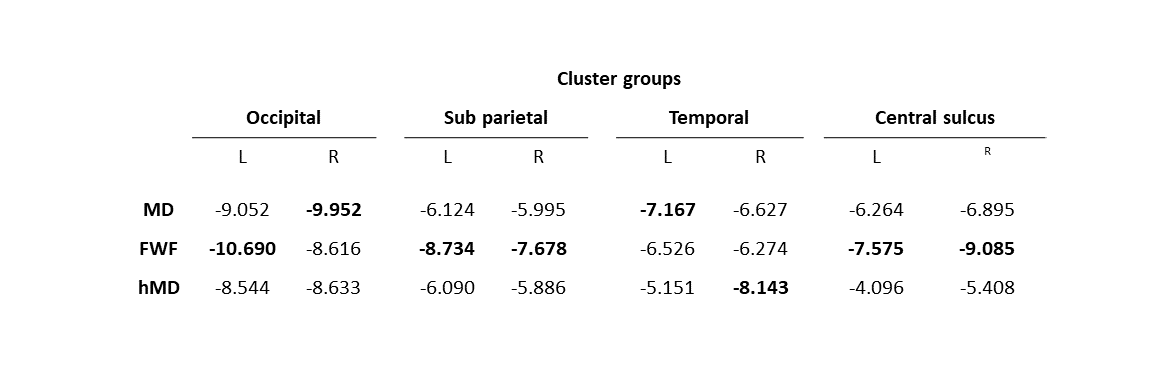
We observe widespread MD reduction (Figure 1 row 1, light blue regions) in agreement with previous studies4-7.FWF from NODDI demonstrates widespread reduction (Figure 1 row 3) which is spatially consistent with the patterns of MD changes. This parameter appears more sensitive to changes than MD, as demonstrated by the higher maximum t-values (in absolute terms) within corresponding groups of clusters across metrics (table 1). A FWF decrease can be interpreted as an increase of tissue contribution to the signal which, in turns, is consistent with in-vitro reports of glial cell activation3.
hMD from CHARMED (Figure 1 row 4) shows weaker but similar patterns of decrease as MD and FWF. Its lower sensitivity may be a result of the model not being designed for GM.
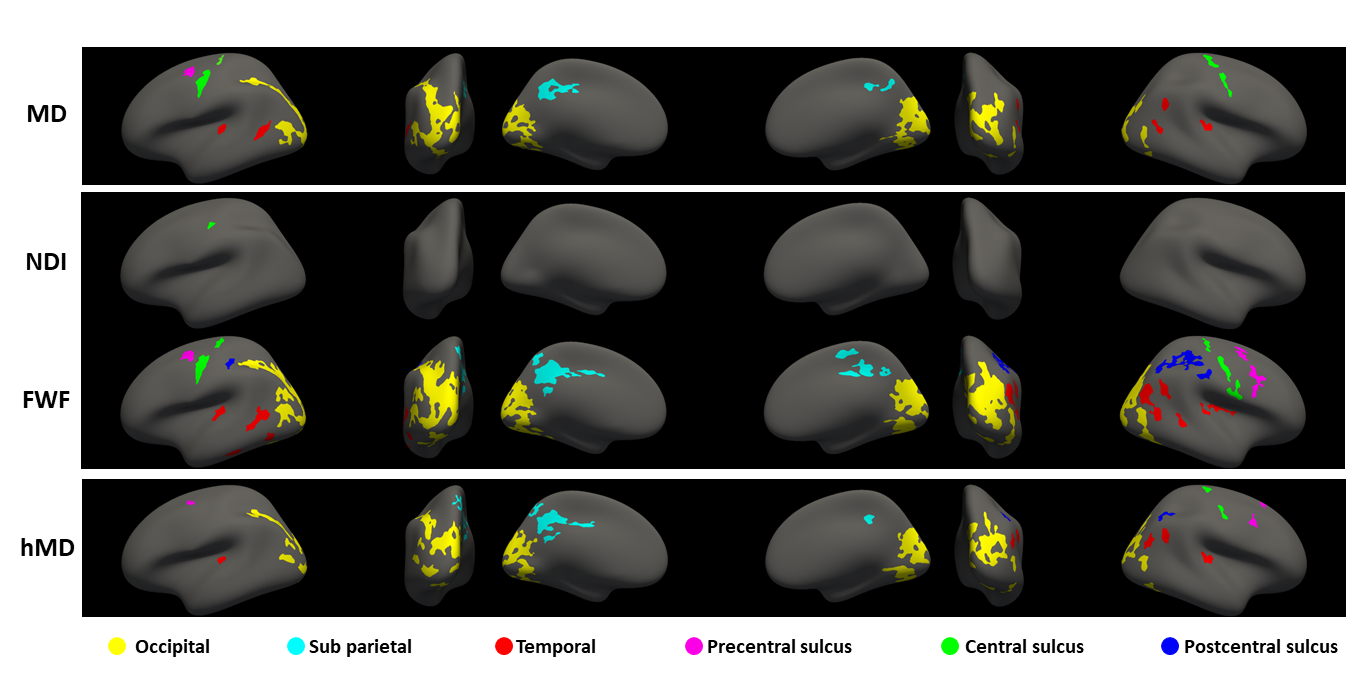
Figure 2 shows the statistically significant clusters after cluster-wise multiple comparison correction (pFWE<0.05). We use different colours to highlight groups of clusters which share similar locations across parameters, demonstrating all the reported metrics share similar spatial patterns. Consistent with Figure 1, FWF (row 3) is the parameter with the largest clusters (24800 mm2), followed by MD (14967 mm2) and hMD (13885 mm2).
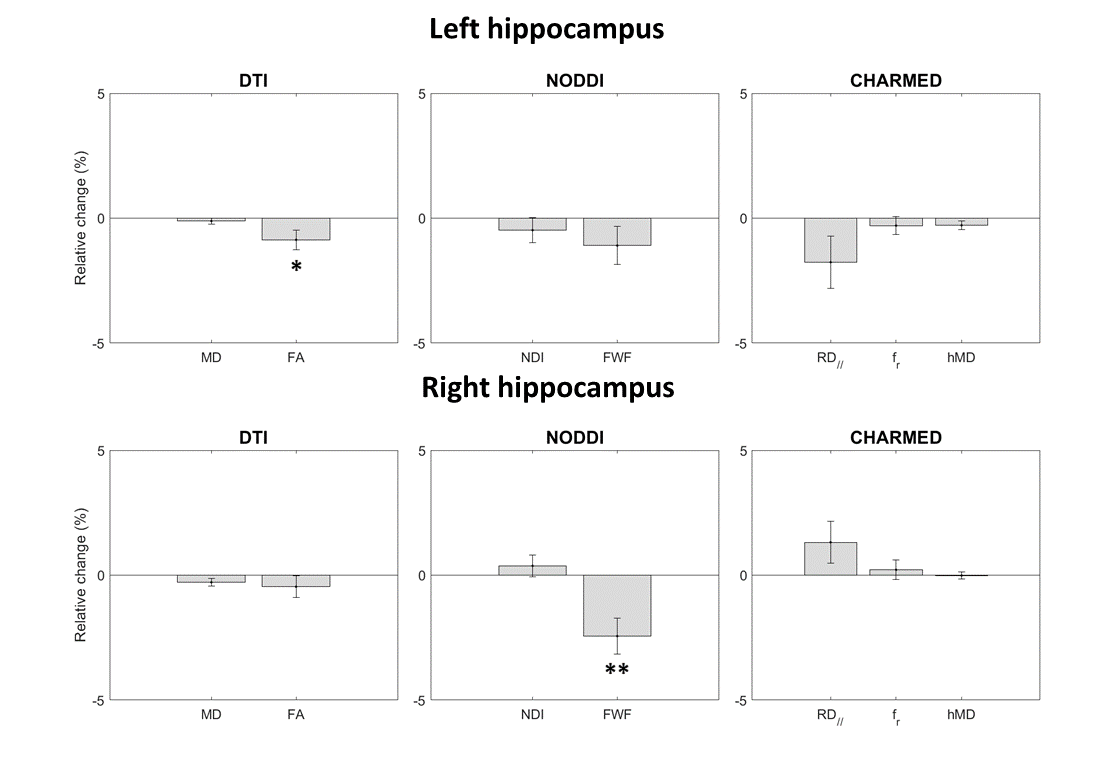
Figure 3 shows the output of ROI analysis. A significant reduction of FA was observed in the left hippocampus (p<0.025). A significant reduction of FWF was observed in the right hippocampus (p<0.001). Unlike previous reports3-5, no significant changes were observed in MD nor fr.
Conclusions
This study demonstrates NODDI as a promising approach to examine microstructural changes associated with neuroplasticity. Our results suggest FWF may be a more sensitive marker than MD as well as adding biological specificity.Acknowledgements
Michele Guerreri and Whitney Stee were supported by the Fonds Wetenschappelijk Onderzoek – Vlaanderen (FWO) and the Fonds de la Recherche Scientifique – FNRS under EOS Project MEMODYN No. 30446199. WS is FNRS Research Fellow since 10/2020.References
1. Assaf, Yaniv. "New dimensions for brain mapping." Science 362.6418 (2018): 994-995.
2. Zatorre, Robert J., R. Douglas Fields, and Heidi Johansen-Berg. "Plasticity in gray and white: neuroimaging changes in brain structure during learning." Nature neuroscience 15.4 (2012): 528-536.
3. Sagi, Yaniv, et al. "Learning in the fast lane: new insights into neuroplasticity." Neuron 73.6 (2012): 1195-1203.
4. Tavor, Ido, Shir Hofstetter, and Yaniv Assaf. "Micro-structural assessment of short term plasticity dynamics." Neuroimage 81 (2013): 1-7.
5. Keller, Timothy A., and Marcel Adam Just. "Structural and functional neuroplasticity in human learning of spatial routes." NeuroImage 125 (2016): 256-266.
6. Brodt, S., et al. "Fast track to the neocortex: A memory engram in the posterior parietal cortex." Science 362.6418 (2018): 1045-1048.
7. Tavor, Ido, et al. "Short‐term plasticity following motor sequence learning revealed by diffusion magnetic resonance imaging." Human brain mapping 41.2 (2020): 442-452.
8. Assaf, Yaniv, et al. "New modeling and experimental framework to characterize hindered and restricted water diffusion in brain white matter." Magnetic Resonance in Medicine: An Official Journal of the International Society for Magnetic Resonance in Medicine 52.5 (2004): 965-978.
9. Assaf, Yaniv, and Peter J. Basser. "Composite hindered and restricted model of diffusion (CHARMED) MR imaging of the human brain." Neuroimage 27.1 (2005): 48-58.
10. Zhang, Hui, et al. "NODDI: practical in vivo neurite orientation dispersion and density imaging of the human brain." Neuroimage 61.4 (2012): 1000-1016.
11. Peigneux, P., Orban, P., Balteau, E., Degueldre, C., Luxen, A., Laureys, S., & Maquet, P. (2006). Offline persistence of memory-related cerebral activity during active wakefulness. PLoS Biol, 4(4), e100.
12. Peigneux, P., Laureys, S., Fuchs, S., Collette, F., Perrin, F., Reggers, J., Phillips, C., Degueldre, C., Del Fiore, G., Aerts, J., Luxen, A., & Maquet, P. (2004). Are spatial memories strengthened in the human hippocampus during slow wave sleep? Neuron, 44, 535-545.
13. Deantoni, Michele, et al. "Continued topographical learning-and relearning-dependent activity in the resting state after post-training sleep and wake." bioRxiv (2020).
14. Guerreri, M., Szczepankiewicz, F., Lampinen, B., Nilsson, M., Palombo, M., Capuani, S. & Zhang, H. Revised NODDI model for diffusion MRI data with multiple b-tensor encodings. 2018. International Society for Magnetic Resonance in Medicine.
15. Guerreri, M., Szczepankiewicz, F., Lampinen, B., Palombo, M., Nilsson, M. & Zhang, H. 2020. Tortuosity assumption not the cause of NODDI’s incompatibility with tensor-valued diffusion encoding. International Society for Magnetic Resonance in Medicine. Sydney, Australia.
16. Lampinen, Björn, et al. "Neurite density imaging versus imaging of microscopic anisotropy in diffusion MRI: A model comparison using spherical tensor encoding." Neuroimage 147 (2017): 517-531.
17. Fukutomi, Hikaru, et al. "Neurite imaging reveals microstructural variations in human cerebral cortical gray matter." Neuroimage 182 (2018): 488-499. 18. Fischl, Bruce. "FreeSurfer." Neuroimage 62.2 (2012): 774-781.
Figures