2042
In vivo validation of a data driven algorithm for multicomponent T2 mapping on a mice model of demyelination1Department of Biomedical Engineering, Tel-Aviv University, Tel-Aviv, Israel, 2Department of Computer Science and Applied Mathematics, Weitzman institute of science, Rehovot, Israel, 3Department of Orthopedics, Shamir Medical Center, Zerifin, Israel, 4Sackler Faculty of Medicine, Tel-Aviv University, Tel-Aviv, Israel, 5Sagol School of Neuroscience, Tel-Aviv University, Tel-Aviv, Israel, 6Center for Advanced Imaging Innovation and Research (CAI2R), New-York University Langone Medical Center, New York, NY, United States
Synopsis
Multicomponent T2 analysis (mcT2) can provide a clinically-useful myelin biomarker in vivo. Its clinical applicability, however, is hindered by lack of gold standard technique that can overcome the ambiguity of fitting several T2 components to a single experimental signal. In this study we aimed to validate the utility of a novel data-driven mcT2 mapping algorithm for quantifying myelin content. To that end, we applied the mcT2 algorithm to 14 mice divided into two groups of mice: cuprizone-induced demyelination model, and controls. Results show excellent agreement between the mcT2 based myelin biomarker and ground truth quantification of myelin from immunohistochemical staining.
Introduction
The ability to assess myelin content in vivo has vast applications in neurodevelopmental studies and in myelodegenerative diseases. Multicomponent T2 (mcT2) analysis can be used to quantify myelin content indirectly, through the quantification of the myelin water fraction (MWF)1. This analysis considers the T2-signal as a weighted sum of several T2 components originating from distinct sub-voxel water compartments2. In the case of myelinated tissues signals are assumed to be comprised of three sub-voxel compartments: myelin water and intra/extra cellular water pools3. Since the myelin water possess the shortest T2 value, MWF can be determined from the relative area of the shortest peak in T2 spectra. Despite the utility of existing techniques, mcT2 analysis remains challenging. This is mainly due to ambiguity that arises when transforming the experimental signal into a T2 spectrum.Recently we presented a data driven algorithm for mcT2 analysis4. Different from spatially local approaches5-6, this algorithm first learns the anatomy in question and identifies tissue-specific mcT2 motifs before locally analyzing each voxel. The accuracy of this method was successfully validated on phantoms containing two and three sub-voxel T2 compartments. Herein we demonstrate its utility for quantifying myelin content in mice models of cuprizone-induced demyelination vs. healthy controls, and validate our findings using ground truth immunohistochemical (IHC) analysis.
Methods
Study protocolA group of mice (n=7) with 6-week cuprizone exposure (0.3%) and age-matched controls (n=7, normal diet) were used in the study. In vivo MRI scans were performed after 6-weeks, followed by euthanization for immunohistochemical staining of myelin basic protein (MBPs). Myelin content was estimated from the stained images and compared against MRI based MWFs. These were calculated using mcT2 analysis according to the relative area of the short-T2 peak (0-40 ms) in the T2 spectrum7. Comparison was focused on the medial corpus callosum (medical-CC) – a highly myelinated brain region.
Histology
Prior to brain extraction all mice were anesthetized with Ketamine and Xylazine and transcardially perfused with 4% paraformaldehyde in a phosphate buffer saline. Brains were then fixed overnight at 4°C, kept in a 1% paraformaldehyde solution, and embedded in paraffin blocks. Immunohistochemical staining (IHC) was performed in approximately 3–5 µm transverse sections incubated with MBP antibody (1:100, Proteintech USA) and Hematoxylin (Leica Biosystems Newcastle Ltd, UK). IHC images were acquired using an Olympus BX60 microscope, at magnifications of X1.25.
The MBP channel was extracted from the histology images by transforming to HSV color space using the ImageJ color transformation feature8. Pixels with values higher than 24 were then classified to myelin and no-myelin groups. Next, IHC myelin values were first normalized to have maximal value of 1, summed and divided by the number of myelin pixels in the ROI to produce the final measure for myelin content.
MRI scans
Scans were performed on a 7 Tesla scanner (Bruker Biospin, Germany), using a 4-channel head coil using a single channel transceiver coil. Experimental protocol consisted of a single slice mufti-echo-spic-echo sequence with the following parameters: FOV=15×15 mm2 (cuprizone) and 20×20 mm2 (controls), matrix size=128x128, Naverages=2, TR=3000 ms, TE=5.5 ms, Echo train length=20, slice thickness=0.8 mm, acquisition bandwidth=390 Hz/Px.
Multicomponent T2 (mcT2) analysis
mcT2 analysis was performed using a data-driven approach4. This method identifies global microstructural features of the anatomy prior for analyzing each voxel locally, thereby offering more reproducible quantification of myelin content. Fitting was done using a simulated signals dictionary containing single-T2 signals consisting of 1,2 and 3 sub-voxel components. T2 values were logarithmically spaced between 1-800 ms, and water pool fractions were set at jumps of 0.05 for T2≤30 ms, and 0.1 for T2>30 ms.
Results
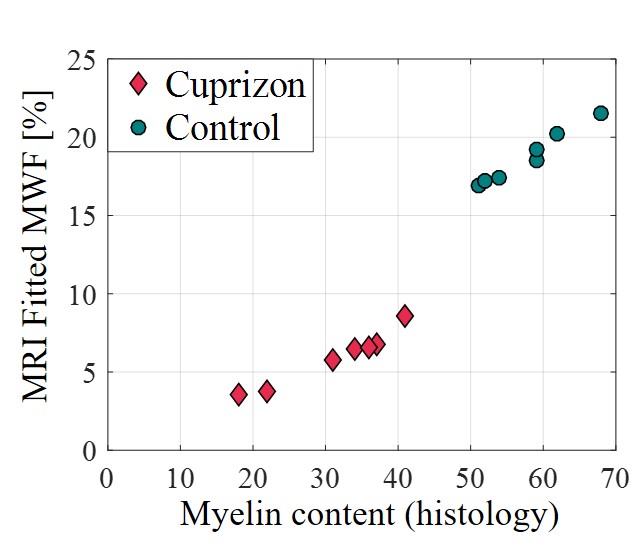
Sample cross-sections of MBP-stained histological slices of control and cuprizone mice are presented in Fig. 1, manifesting clear demyelination in the cuprizone mice. Fig. 2 presents corresponding myelin staining maps, normalized between 0 to 1. MWF maps, produced from the in vivo MRI scans of the same mice are presented in Fig. 3, overlaid on the corresponding T2-weighted images (4th echo). Normalized myelin fractions are plotted against their fitted MWF in Fig. 4, demonstrating distinct clustering and strong agreement between histological and MRI based quantification.Discussion & Conclusion
In this study we validated our data driven algorithm for mcT2 analysis by using it to quantify myelin content and comparing the result to IHC ground truth values. The two distinct clusters between demyelinated and control groups show that the proposed method can classify healthy and pathology cases in vivo. The strong linear correlation within groups demonstrates its sensitivity to subtle myelodegenerative changes attesting to the ability of the mcT2 algorithm to provide accurate biomarker for early myelin degeneration.Acknowledgements
ISF Grant 2009/17References
1. Alonso-Ortiz E, Levesque R, et al. MRI-based myelin water imaging: A technical review. Magn. Reson. Med. 2015;73(1):70-81.
2. Mackay A, et al. In vivo visualization of myelin water in brain by magnetic resonance. Magn. Reson. Med. 1994;31(6):673-677.
3. Laule C, et al. Myelin water imaging of multiple sclerosis at 7 T: Correlations with histopathology. Neuroimage. 2008;40(4):1575-1580.
4. Lancaster J, et al. Three-pool model of white matter. J. Magn. Reson. Imaging. 2003;17:1-10. 5. Omer N, et al. A novel multicomponent T2 analysis for identification of sub-voxel compartments and quantification of myelin water fraction. E-poster, 28th Proc Intl Soc Mag Reson Med, p. 6109, online (2020).
6. Whittall P and MacKay L. Quantitative interpretation of NMR relaxation data. J. Magn. Reson. 1989;84:134-152.
7. Whittall K. Recovering compartment sizes from NMR relaxation data. J. Magn. Reson. 1991;94(3):486-492.
8. Abramoff, M.D., Magalhaes, P.J., Ram, S.J. "Image Processing with ImageJ". Biophotonics International. 2004;11(7):36-42.
Figures
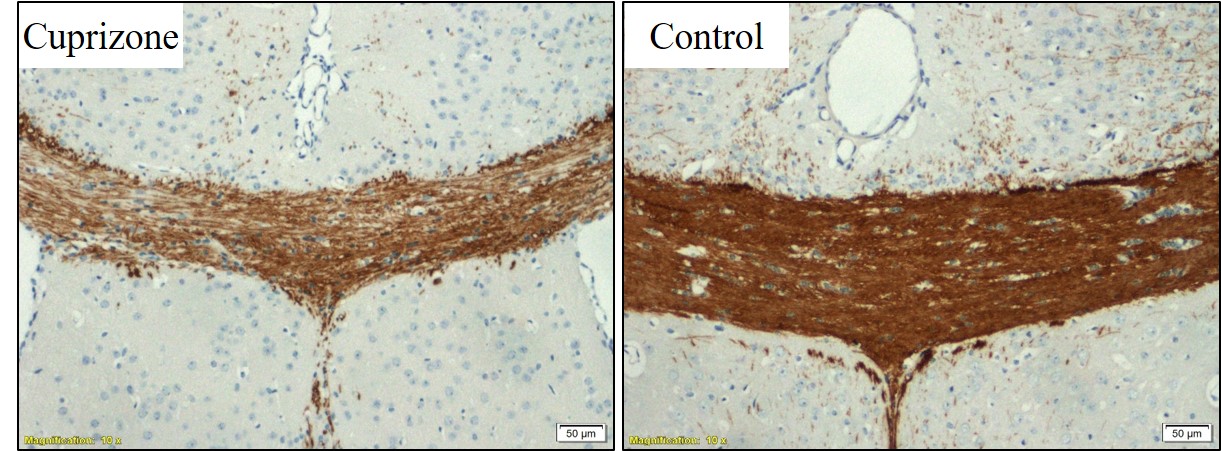
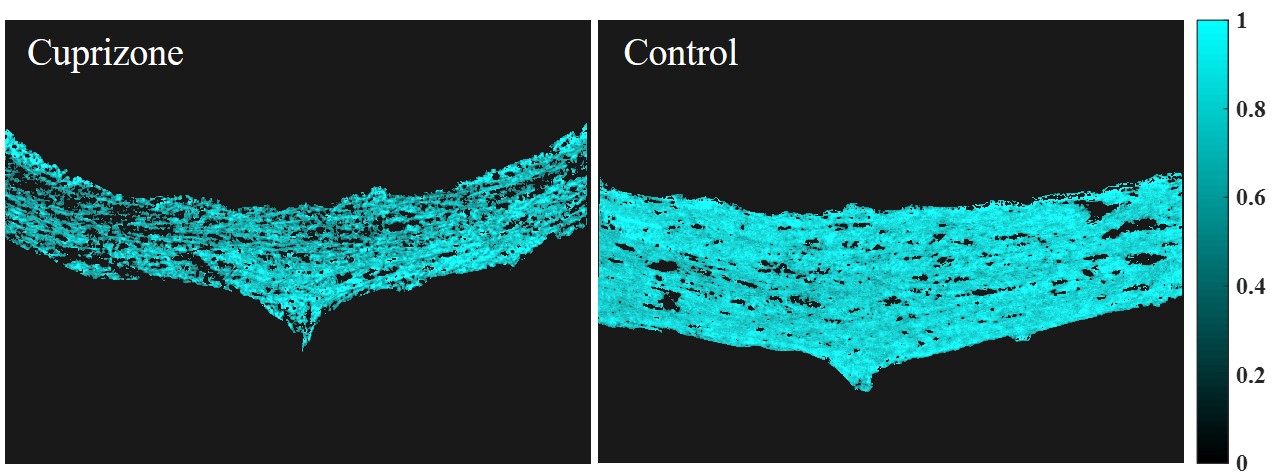
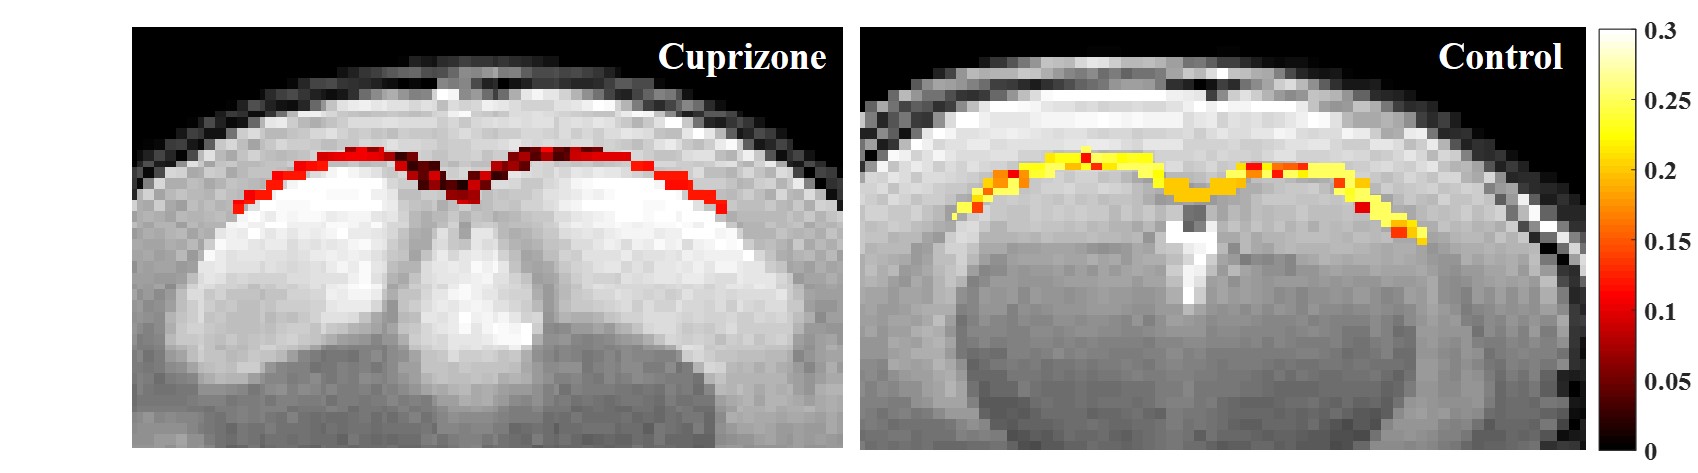
Figure 3. Example myelin water fraction (MWF) maps based on MRI derived MWF values. MWF values are presented along the croups callosum (CC) for cuprizone (left) and (right) control mice showing lower values for the cuprizone mouse. Maps are shown on top the T2-wighted image (5th echo) obtained using multi-echo-spic-echo MRI protocol and with the same colormap.