2040
Microstructural Diffusion MRI in Mouse Models of Severe and Repetitive Mild Traumatic Brain Injury1Medical Biophysics, Western University, London, ON, Canada, 2Robarts Research Institute, London, ON, Canada, 3Neurosurgery, Medical College of Wisconsin, Milwaukee, WI, United States, 4Anatomy and Cell Biology, Western University, London, ON, Canada
Synopsis
Microstructural diffusion MRI (dMRI) improves the specificity required to detect microstructure changes related to pathophysiology. Oscillating gradient spin-echo (OGSE) dMRI is sensitive to structural disorder and microscopic anisotropy (µA) dMRI is sensitive to water diffusion anisotropy independent of neuron fiber orientation. In this work, OGSE and µA protocols were implemented to enable in vivo longitudinal scanning at 9.4T. Preliminary data in a rodent model of traumatic brain injury (TBI) revealed changes in mean diffusivity dependence on OGSE frequency post-TBI and changes in spherical tensor kurtosis (sensitive to cell size heterogeneity), compared to healthy mice.
Introduction
Current neuroimaging techniques lack the specificity required to reliably detect signs of mild traumatic brain injury (mTBI)1. To enable the specificity required to track microstructure changes, two advanced quantitative diffusion MRI scans (“Microstructural dMRI”) that are sensitive to microstructure in complementary ways can be applied: 1. Structural disorder via oscillating gradient spin echo (OGSE) dMRI2 and 2. Cell shape via microscopic anisotropy (μA) dMRI3. Here, we perform longitudinal imaging in a cohort of healthy mice and compare to a rodent model of severe and repetitive mTBI. Importantly, this is the first application of these advanced dMRI protocols in an in vivo rodent model of TBI.Methods
Imaging was performed at 9.4T with a 1 T/m gradient insert using single-shot EPI with an in-plane resolution of 0.175mm x 0.2mm, 0.5mm slice thickness, and a total scan time of 2 hours. The OGSE sequence was implemented with b=800s/mm2, TE=37ms, 10 directions and OGSE frequencies of 0, 50, 100, 145, and 190 Hz. The µA sequence was implemented using a single diffusion encoding (SDE) scheme3 with linear and spherical tensor encodings at b=2000s/mm2 (30 directions) and b=1000s/mm2 (12 directions).Longitudinal imaging was performed on a cohort of 4 healthy female C57Bl/6 mice at 10 weeks old (Day 0) and 12 weeks old (Day 14). Post-processing included PCA denoising4 and eddy current correction with FSL5. Parameters were measured in the corpus callosum (CC) and prefrontal cortex (PFC).
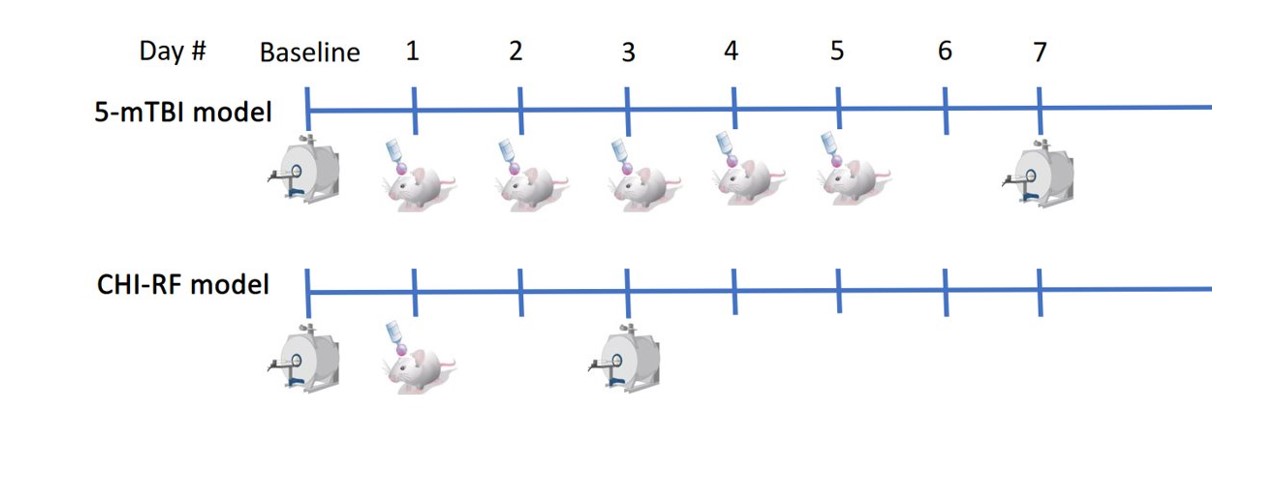
Each of a repetitive mTBI (5-mTBI) and severe TBI model (CHI-RF: cortical head injury with rotational force) were implemented on separate male C57Bl/6 mice (Fig1). Each of the 2 mice was imaged at baseline before impact and again 48H after the final impact, then euthanized for histology after imaging.
Results
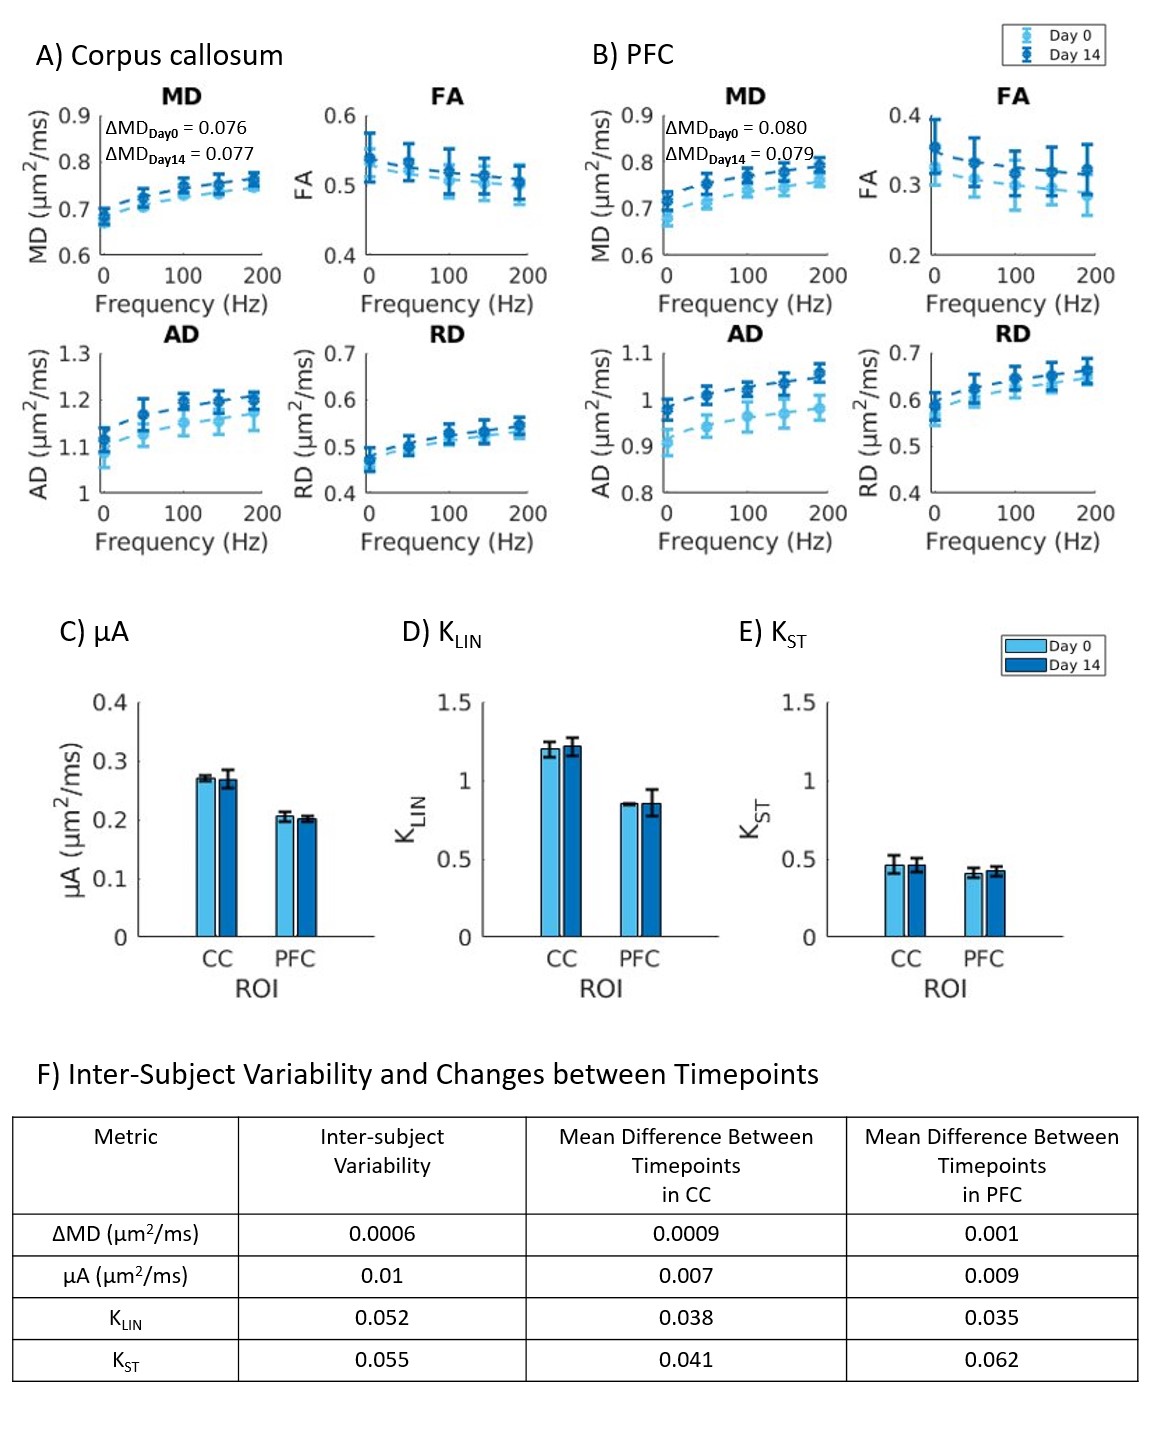
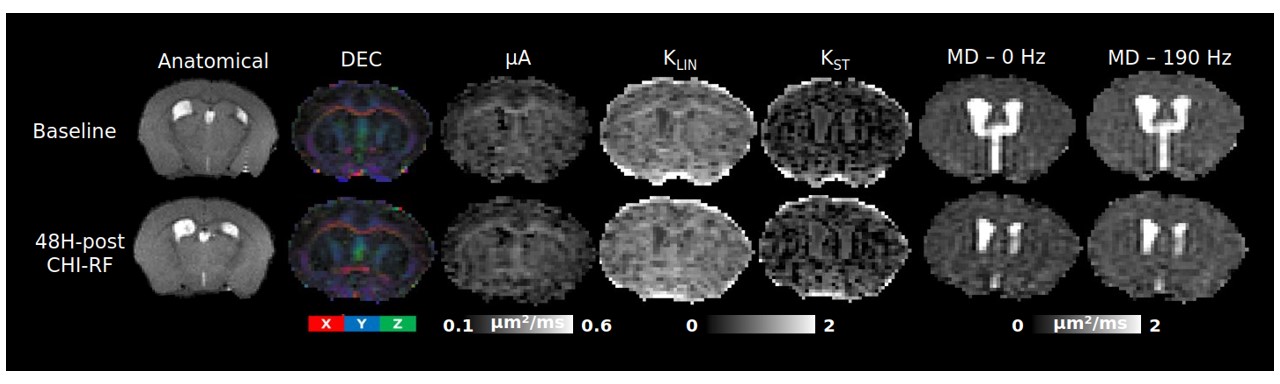
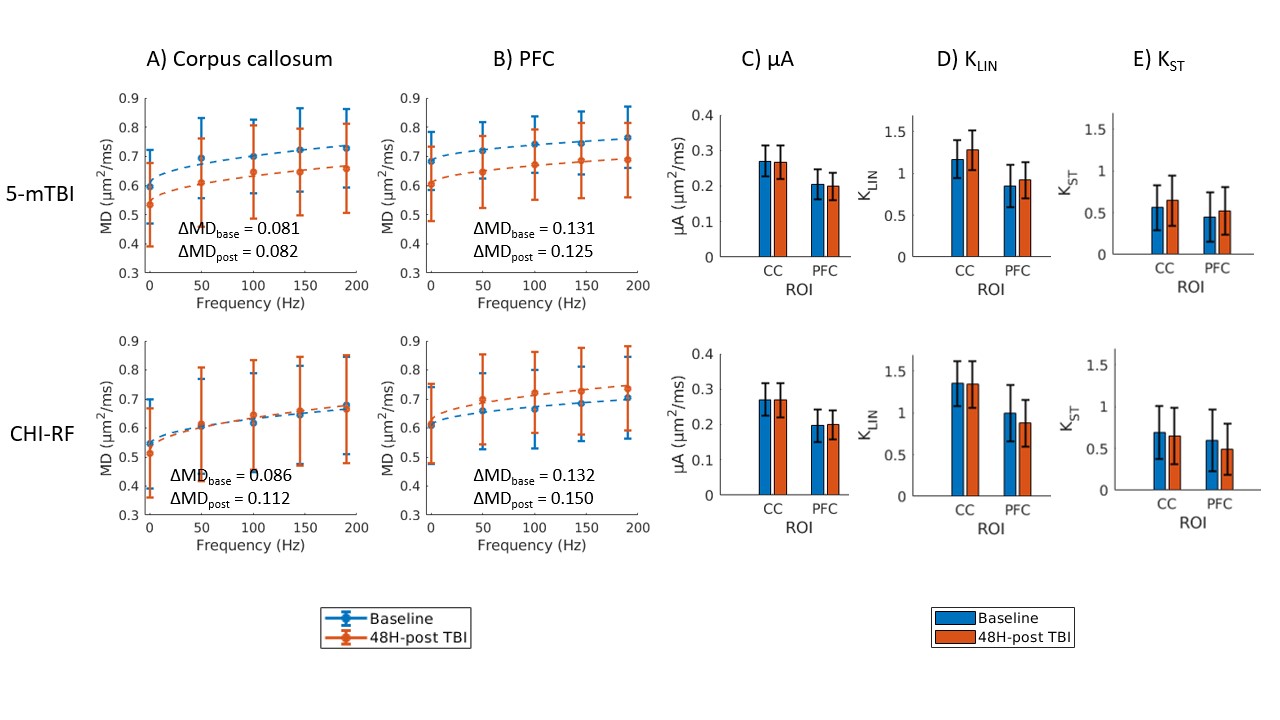
Healthy mice: The dMRI metrics were characterized by a linear dependence on the square root of OGSE frequency (Fig2a,b). Metrics from the μA protocol showed general stability in all ROI's for the Day 0 and Day 14 scans (Fig2c,d,e). A higher μA and KLIN (linear diffusion kurtosis) is seen in the white matter (corpus callosum) compared to the gray matter (PFC). Inter-subject variabilities and mean differences between the two timepoints are reported in Fig2f.Preliminary Data: Parameter maps acquired at baseline and 48H-post CHI-RF are shown in Fig3. ΔMD (the difference in MD between the highest and lowest frequencies) trends towards an increase following CHI-RF in both the corpus callosum and PFC (Fig4a,b). In contrast, there were no clear changes in ΔMD for 5-mTBI. KLIN and KST (spherical tensor diffusion kurtosis), which were calculated from the μA protocol, trend towards a decrease 48H-post CHI-RF, and an increase 48H-post 5-mTBI (Fig4d,e), while no notable change is seen in μA (Fig4c).
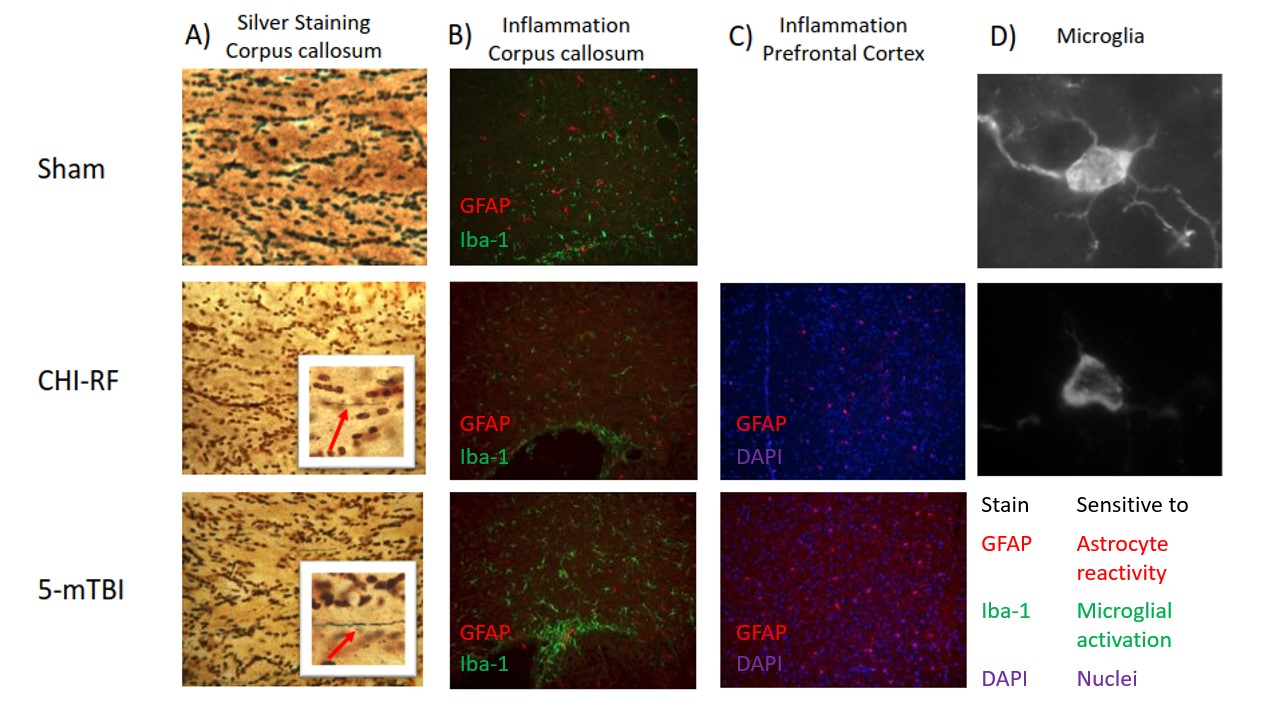
Histology: Silver staining revealed greater axon swelling/beading post 5-mTBI compared to CHI-RF in the corpus callosum (Fig5a). GFAP and Iba-1 staining revealed greater microglial activation in the corpus callosum and greater astrocyte reactivity in the PFC, for 5-mTBI versus CHI-RF (Fig5b,c).
Discussion
Healthy mice: The linear dependence of dMRI metrics on the square root of OGSE frequency (Fig2) is consistent with previous findings in the healthy human brain6. In healthy mice, ΔMD values observed in the PFC (0.079 – 0.080 μm2/ms) are comparable to a previous report of ΔMD in healthy mouse gray matter (0.070 – 0.080 μm2/ms)7. Imaging in healthy mice revealed that trends with frequency were highly repeatable in the PFC and corpus callosum. The variation in AD (axial diffusivity) and FA (fractional anisotropy) over the two-week period is similar to variation in control groups of mice in other longitudinal studies8.Linear and spherical tensor kurtosis: The increase in KLIN for 5-mTBI is consistent with histological results of more inflammation in this model and with a previous finding in a rodent model, where the increase in KLIN was associated with increased reactive astrolgiosis9. Infiltration of activated microglia and axon beading both contribute to heterogeneity, which may have led to the increase in KST 48H-post 5-mTBI. The opposing kurtosis trends between the two models suggest a sensitivity to either severity or timing after an initial impact.
MD dependence on OGSE frequency: Silver staining revealed axon swelling/beading for both models compared to sham, with more pronounced axon swelling/beading for 5-mTBI. The increase in ΔMD for CHI-RF is consistent with expectations from neurite beading10. The lack of a similar observation for the 5-mTBI model, where there is more beading and substantially more inflammation than for CHI-RF, suggests that beading and inflammation might affect OGSE contrast in opposing ways. The decrease in MD for the 5-mTBI model, in contrast to trends in the healthy mice cohort and CHI-RF model, is consistent with previous studies where a decrease in MD in the acute stage after TBI is associated with inflammation and axonal injury11–13.
While only one mouse was studied for each TBI case in this preliminary study, the changes between baseline and post-TBI in ΔMD (in CHI-RF), KLIN, and KST are larger than both the inter-subject variabilities and mean differences between timepoints in healthy mice, which is suggestive that these changes may reflect pathological change. Continuing work will study these changes in a larger cohort of subjects.
Acknowledgements
Natural Sciences and Engineering Research Council of Canada (NSERC)
Canada First Research Excellence Fund to BrainsCAN
New Frontiers in Research Fund (NFRF)
References
1. Giza CC, Hovda DA. The Neurometabolic Cascade of Concussion. J Athl Train. 2001;36(3):228-235.
2. Baron CA, Beaulieu C. Oscillating gradient spin-echo (OGSE) diffusion tensor imaging of the human brain. Magn Reson Med. 2014;72(3):726-736. doi:10.1002/mrm.2498.
3. Arezza NJJ, Tse DHY, Baron CA. Rapid Microscopic Fractional Anisotropy Imaging via an Optimized Kurtosis Formulation. medRxiv. 2020.
4. Veraart J, Novikov DS, Christiaens D, Ades-aron B, Sijbers J, Fieremans E. Denoising of diffusion MRI using random matrix theory. Neuroimage. 2016;142:394-406. doi:10.1016/j.neuroimage.2016.08.01.
5. Andersson JLR, Sotiropoulos SN. An integrated approach to correction for off-resonance effects and subject movement in diffusion MR imaging. Neuroimage. 2016;125:1063-1078. doi:10.1016/j.neuroimage.2015.10.01.
6. Arbabi A, Kai J, Khan AR, Baron CA. Diffusion dispersion imaging: Mapping oscillating gradient spin-echo frequency dependence in the human brain. Magn Reson Med. 2020;83(6):2197-2208. doi:10.1002/mrm.2808.
7. Wu D, Martin LJ, Northington FJ, Zhang J. Oscillating gradient diffusion MRI reveals unique microstructural information in normal and hypoxia-ischemia injured mouse brains. Magn Reson Med. 2014;72(5):1366-1374. doi:10.1002/mrm.2544.
8. Yu F, Shukla DK, Armstrong RC, et al. Repetitive Model of Mild Traumatic Brain Injury Produces Cortical Abnormalities Detectable by Magnetic Resonance Diffusion Imaging, Histopathology, and Behavior. J Neurotrauma. 2017;34(7):1364-1381. doi:10.1089/neu.2016.456.
9. Zhuo J, Xu S, Hazelton J, Mullins R, Simon J. Diffusion Kurtosis as an In Vivo Imaging Marker for Reactive Astrogliosis in Traumatic Brain Injury. Neuroimage. 2012;59(1):467-477. doi:10.1016/j.neuroimage.2011.07.050.Diffusion.
10. Baron CA lla., Kate M, Gioia L, et al. Reduction of Diffusion-Weighted Imaging Contrast of Acute Ischemic Stroke at Short Diffusion Times. Stroke. 2015;46(8):2136-2141. doi:10.1161/STROKEAHA.115.00881.
11. Mac Donald CL, Dikranian K, Bayly P, Holtzman D, Brody D. Diffusion tensor imaging reliably detects experimental traumatic axonal injury and indicates approximate time of injury. J Neurosci. 2007;27(44):11869-11876. doi:10.1523/JNEUROSCI.3647-07.2007.
12. van de Looij Y, Mauconduit F, Beaumont M, et al. Diffusion tensor imaging of diffuse axonal injury in a rat brain trauma model. NMR Biomed. 2012;25(1):93-103. doi:10.1002/nbm.1721.
13. Molina ISM, Salo RA, Abdollahzadeh A, Tohka J, Gröhn O, Sierra A. In vivo diffusion tensor imaging in acute and subacute phases of mild traumatic brain injury in rats. eNeuro. 2020;7(3):1-18. doi:10.1523/ENEURO.0476-19.2020.
Figures