2039
Biophysical modeling of ex vivo diffusion MRI for the longitudinal characterization of axonal degeneration in the optic nerve1Radiology, New York University School of Medicine, New York, NY, United States, 2University of Eastern Finland, Kuopio, Finland, 3Instituto de Neurobiologia, Universidad Nacional Autonoma de Mexico, Queretaro, Mexico, 4Centro de Investigacion en Matematicas, Guanajuato, Mexico
Synopsis
In this work, we evaluated the parameters of the Standard Model (SM), augmented with a free water compartment, on ex vivo diffusion MRI, to detect longitudinal changes caused by axonal degeneration. Parameters of SM were estimated from the rotational invariants of the diffusion signal using a supervised machine learning approach. Axonal degeneration was induced by nerve injury using a rat retinal ischemia model. Comparisons with 2D histology derived metrics revealed that SM parameters are sensitive to changes caused by axonal degeneration, particularly axon loss. SM parameters also reveal presence of microglia, and increased orientation dispersion.
Introduction
Axonal degeneration, a hallmark of neurological disorders, presents distinct microstructural changes in its acute and chronic stages1-4, and can be studied in rodents by inducing nerve injury using a retinal ischemia model5,6. The microstructural changes due to ischemia have been previously studied using diffusion and kurtosis tensor imaging (DTI/DKI)7-11. Although empirically sensitive, the derived diffusion metrics cannot be directly interpreted in terms of the underlying cellular pathology as they are not specific to the microstructure. Biophysical modeling aims to achieve this specificity, as proposed in the brain using the standard model (SM)12 of impermeable sticks (representing axons, possibly glial cells) embedded in the extra-axonal compartment. In this work, we used the rat retinal ischemia model to evaluate the parameters of the SM augmented with a free water compartment, based on the rotational invariants of the diffusion signal14,15 using a machine learning approach15.Methods
Animal preparation: In 15 Wistar rats, axonal degeneration in the right optic nerve was induced through retinal ischemia, while the contralateral (left) remained intact5,6. Four rats served as controls. Injured animals were divided into three groups according to the progression of the degeneration (1, 7 and 30 days). Animals were sacrificed for tissue fixation and brain extraction including optic nerves9. Imaging: Ex-vivo diffusion MRI (dMRI) data with voxel resolution of 80x80x80 mm3 was acquired on a 7T Bruker Pharmascan (Gmax=760 mT/m) at 21°C using a Helium-cooled coil by applying 54, 52, 34 and 20 diffusion gradient directions for b = 7, 5, 3 and 1 ms/$$$\mu$$$m2, respectively; with $$$\delta$$$/$$$\Delta$$$=4.9/10.84 ms, in addition to 20 non-diffusion weighted images. TR/TE=250/25.19 ms. Microscopy: Optic nerves were separated from the brains for histological preparation of the tissue9. Then, optic nerves were sectioned perpendicular to their long axis and sections were stained for photomicrographic acquisition using an optical microscope at 63x magnification, which allowed for a full transversal view of the nerves. Photomicrographs were processed using Fiji software16 and segmented/analyzed using AxonSeg17 for histology derived metrics. dMRI processing: Images were denoised18, corrected for Gibbs ringing19, bias field inhomogeneities20, eddy current distortions21 and Rician bias22. Standard model (SM) parameters were estimated with a machine learning approach15 based on a cubic polynomial regression to map the acquired rotational invariants12,14 to the kernel parameters. Independent uniform priors were used for computing the regression of all parameters: $$$f\sim\mathcal{U}(0,1),\,D_a\sim\mathcal{U}(0,2.1),\,D_e^{||}\sim\mathcal{U}(0,2.1),\,D_e^{\perp}\sim\mathcal{U}(0,2.1),\,f_{FW}\sim\mathcal{U}(0,0.25),\,p_2\sim\mathcal{U}(0,1)$$$ (maximum values for diffusivity were those of water at 21°C). Diffusion and Kurtosis tensors with their derived metrics were also computed23. Statistical Analysis: Manually segmented ROIs were drawn at the center of both optic nerves to extract median values. T-tests were used to compare differences between intact and injured nerves from different timepoints and Spearman correlations were performed between diffusion/histology, with p-value < 0.05 considered being statistically significant.Results
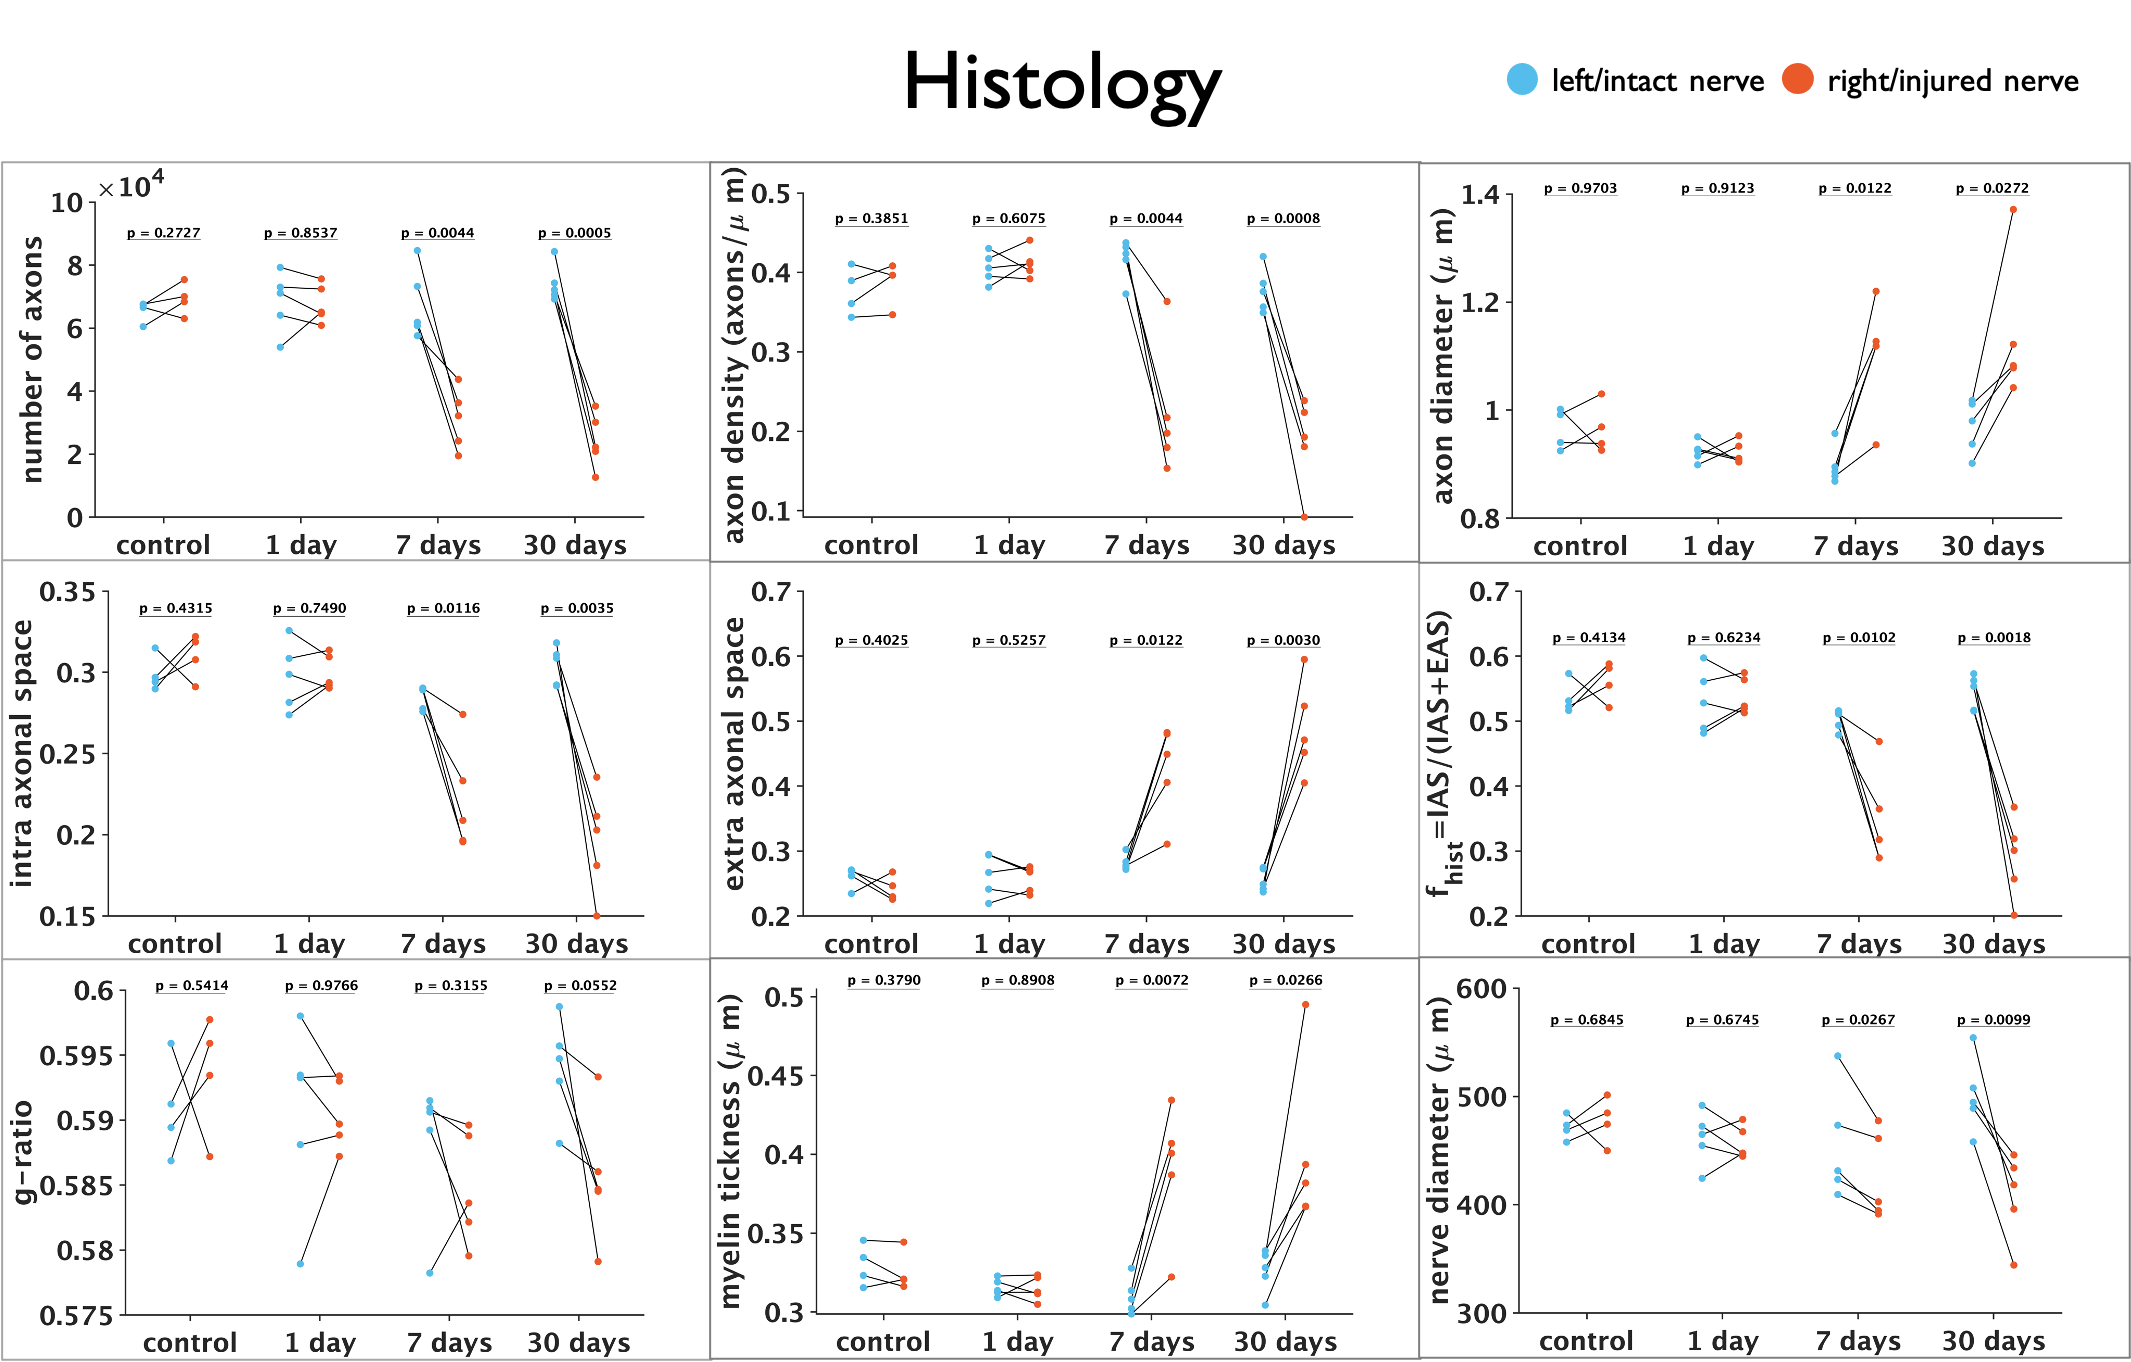
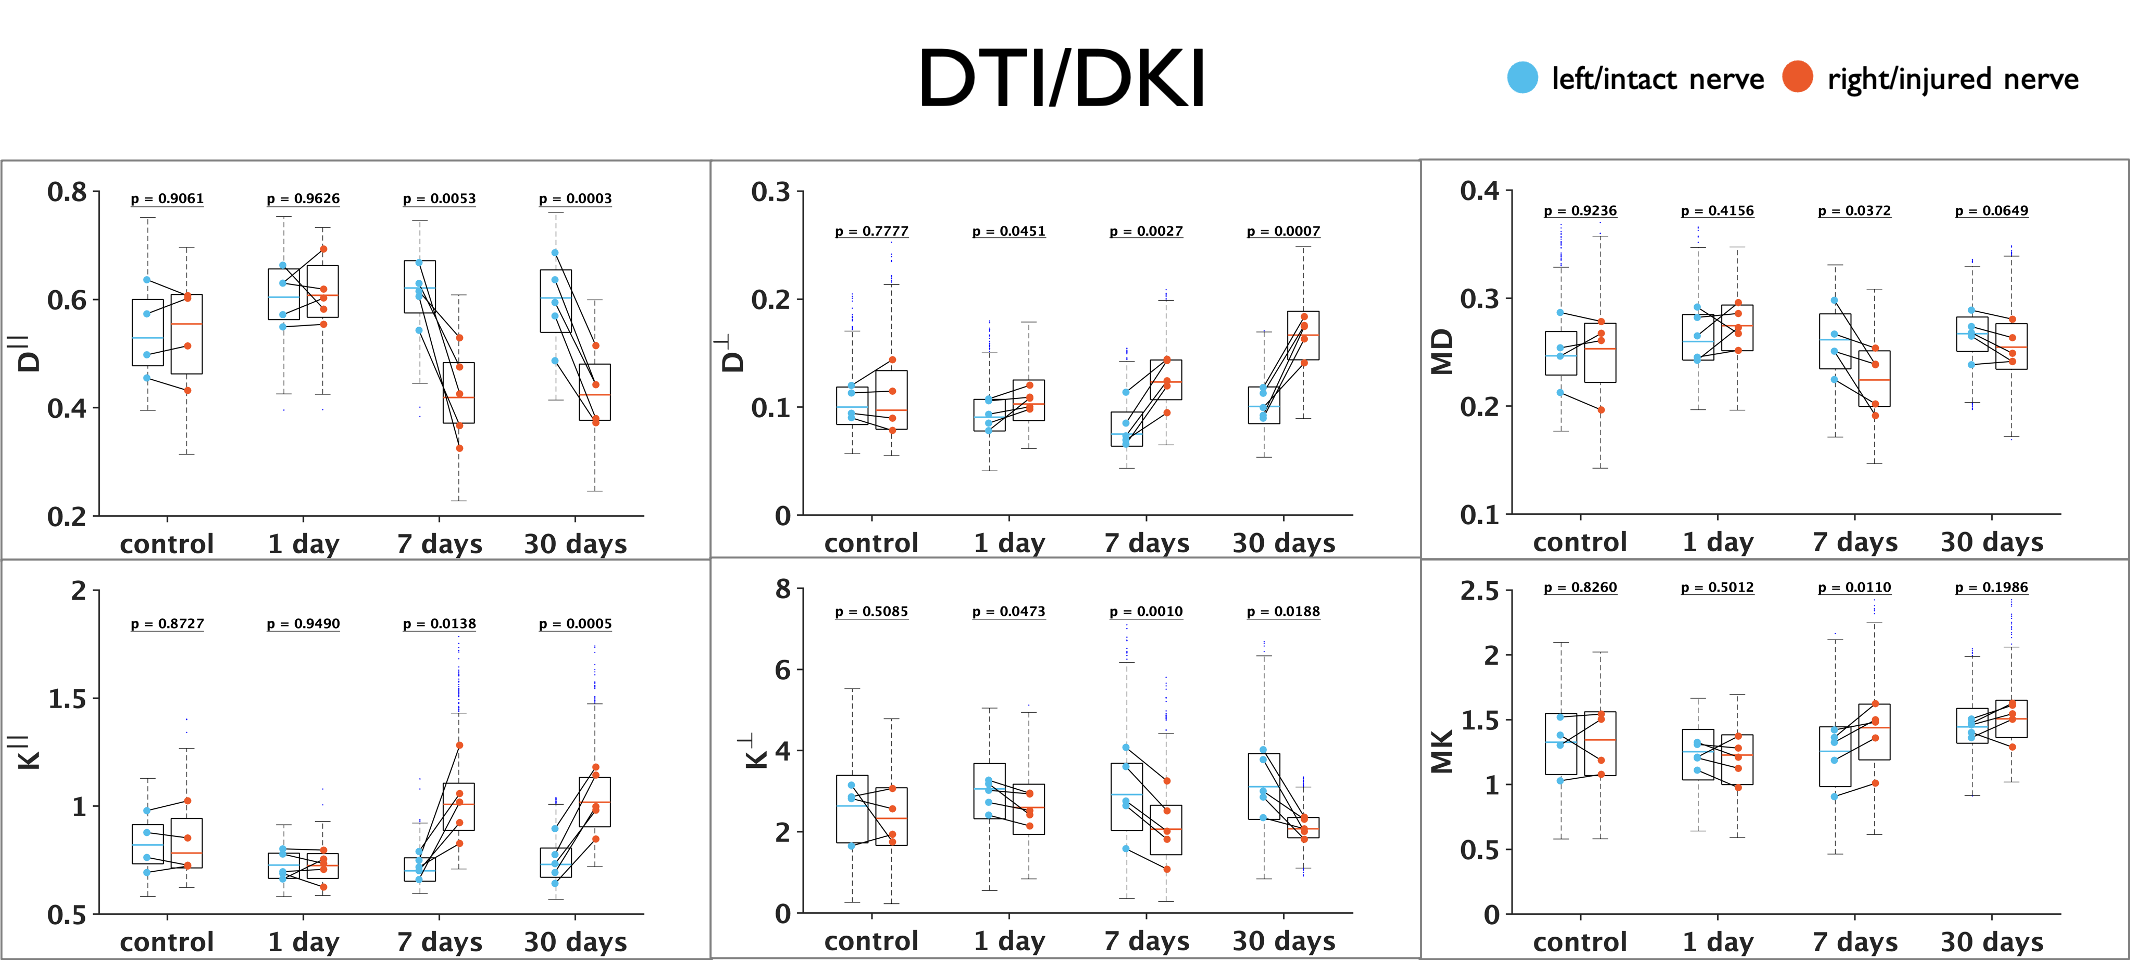
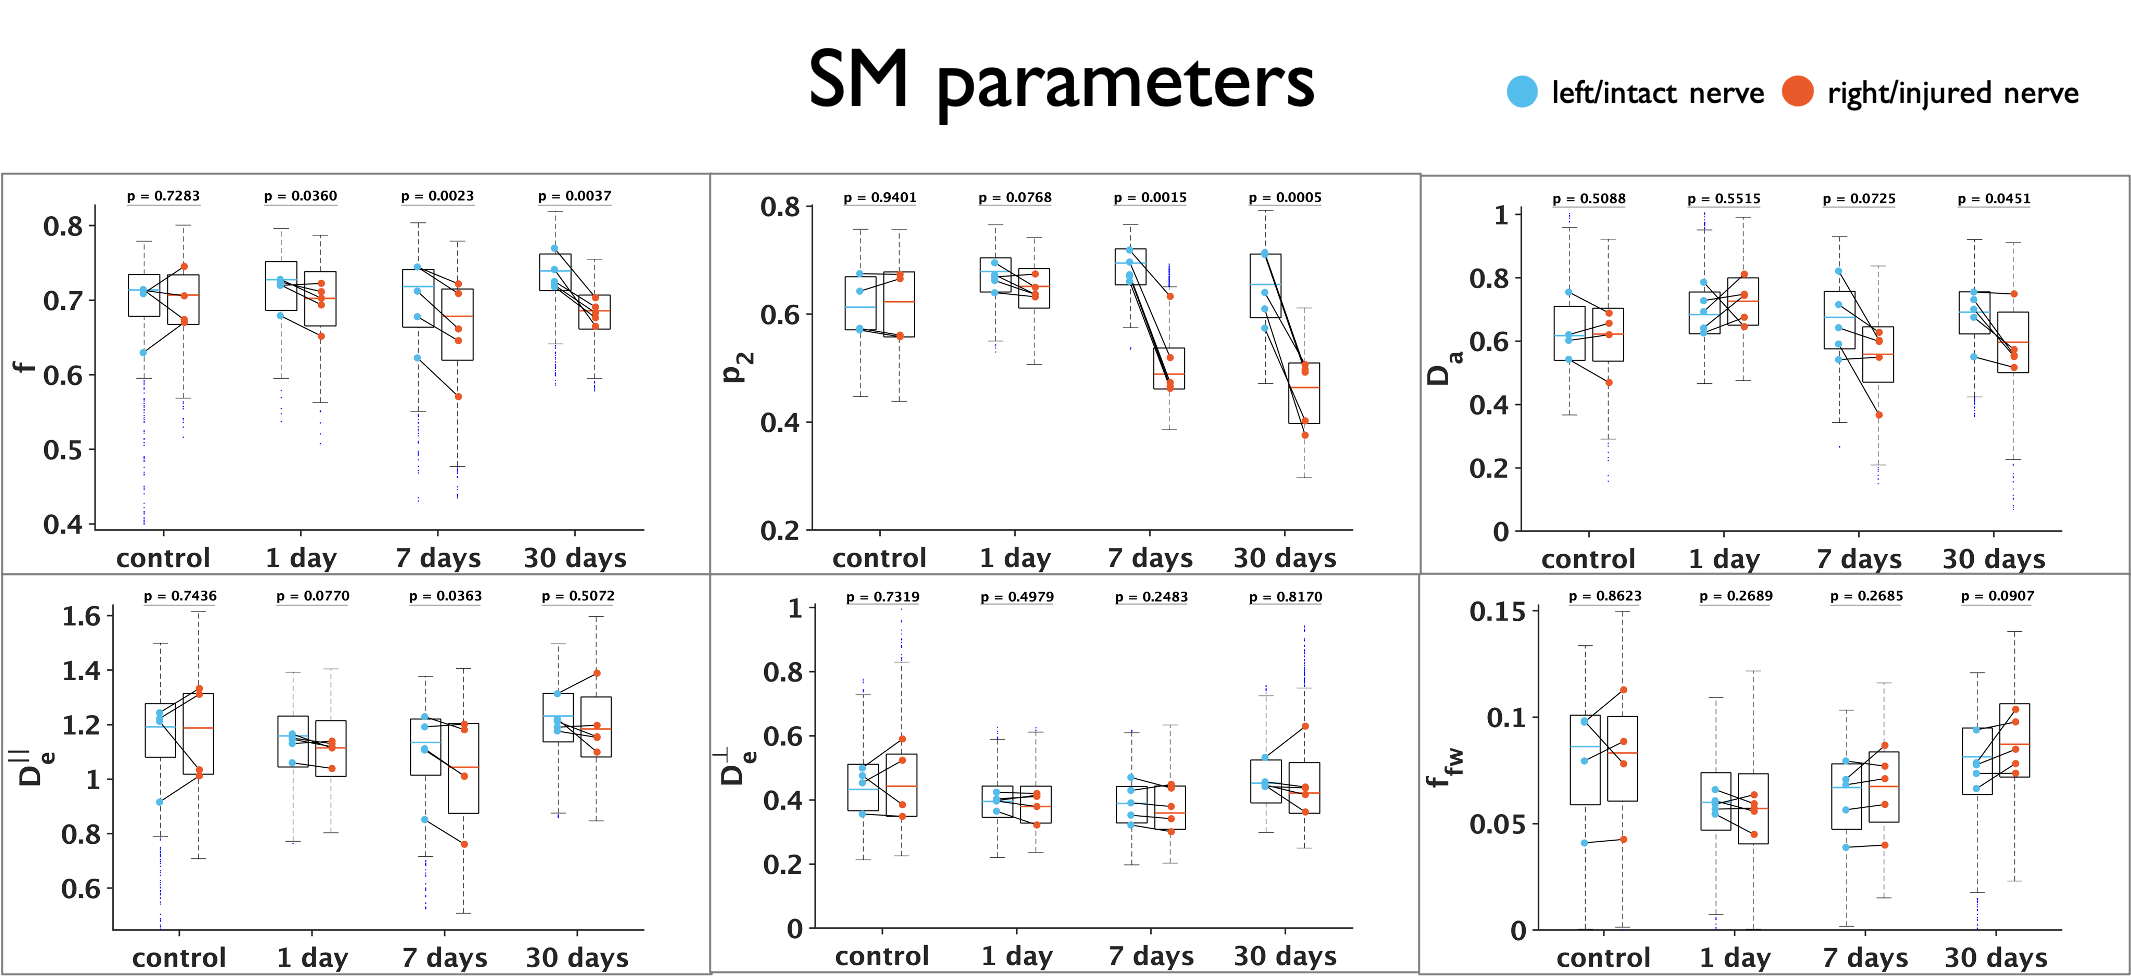
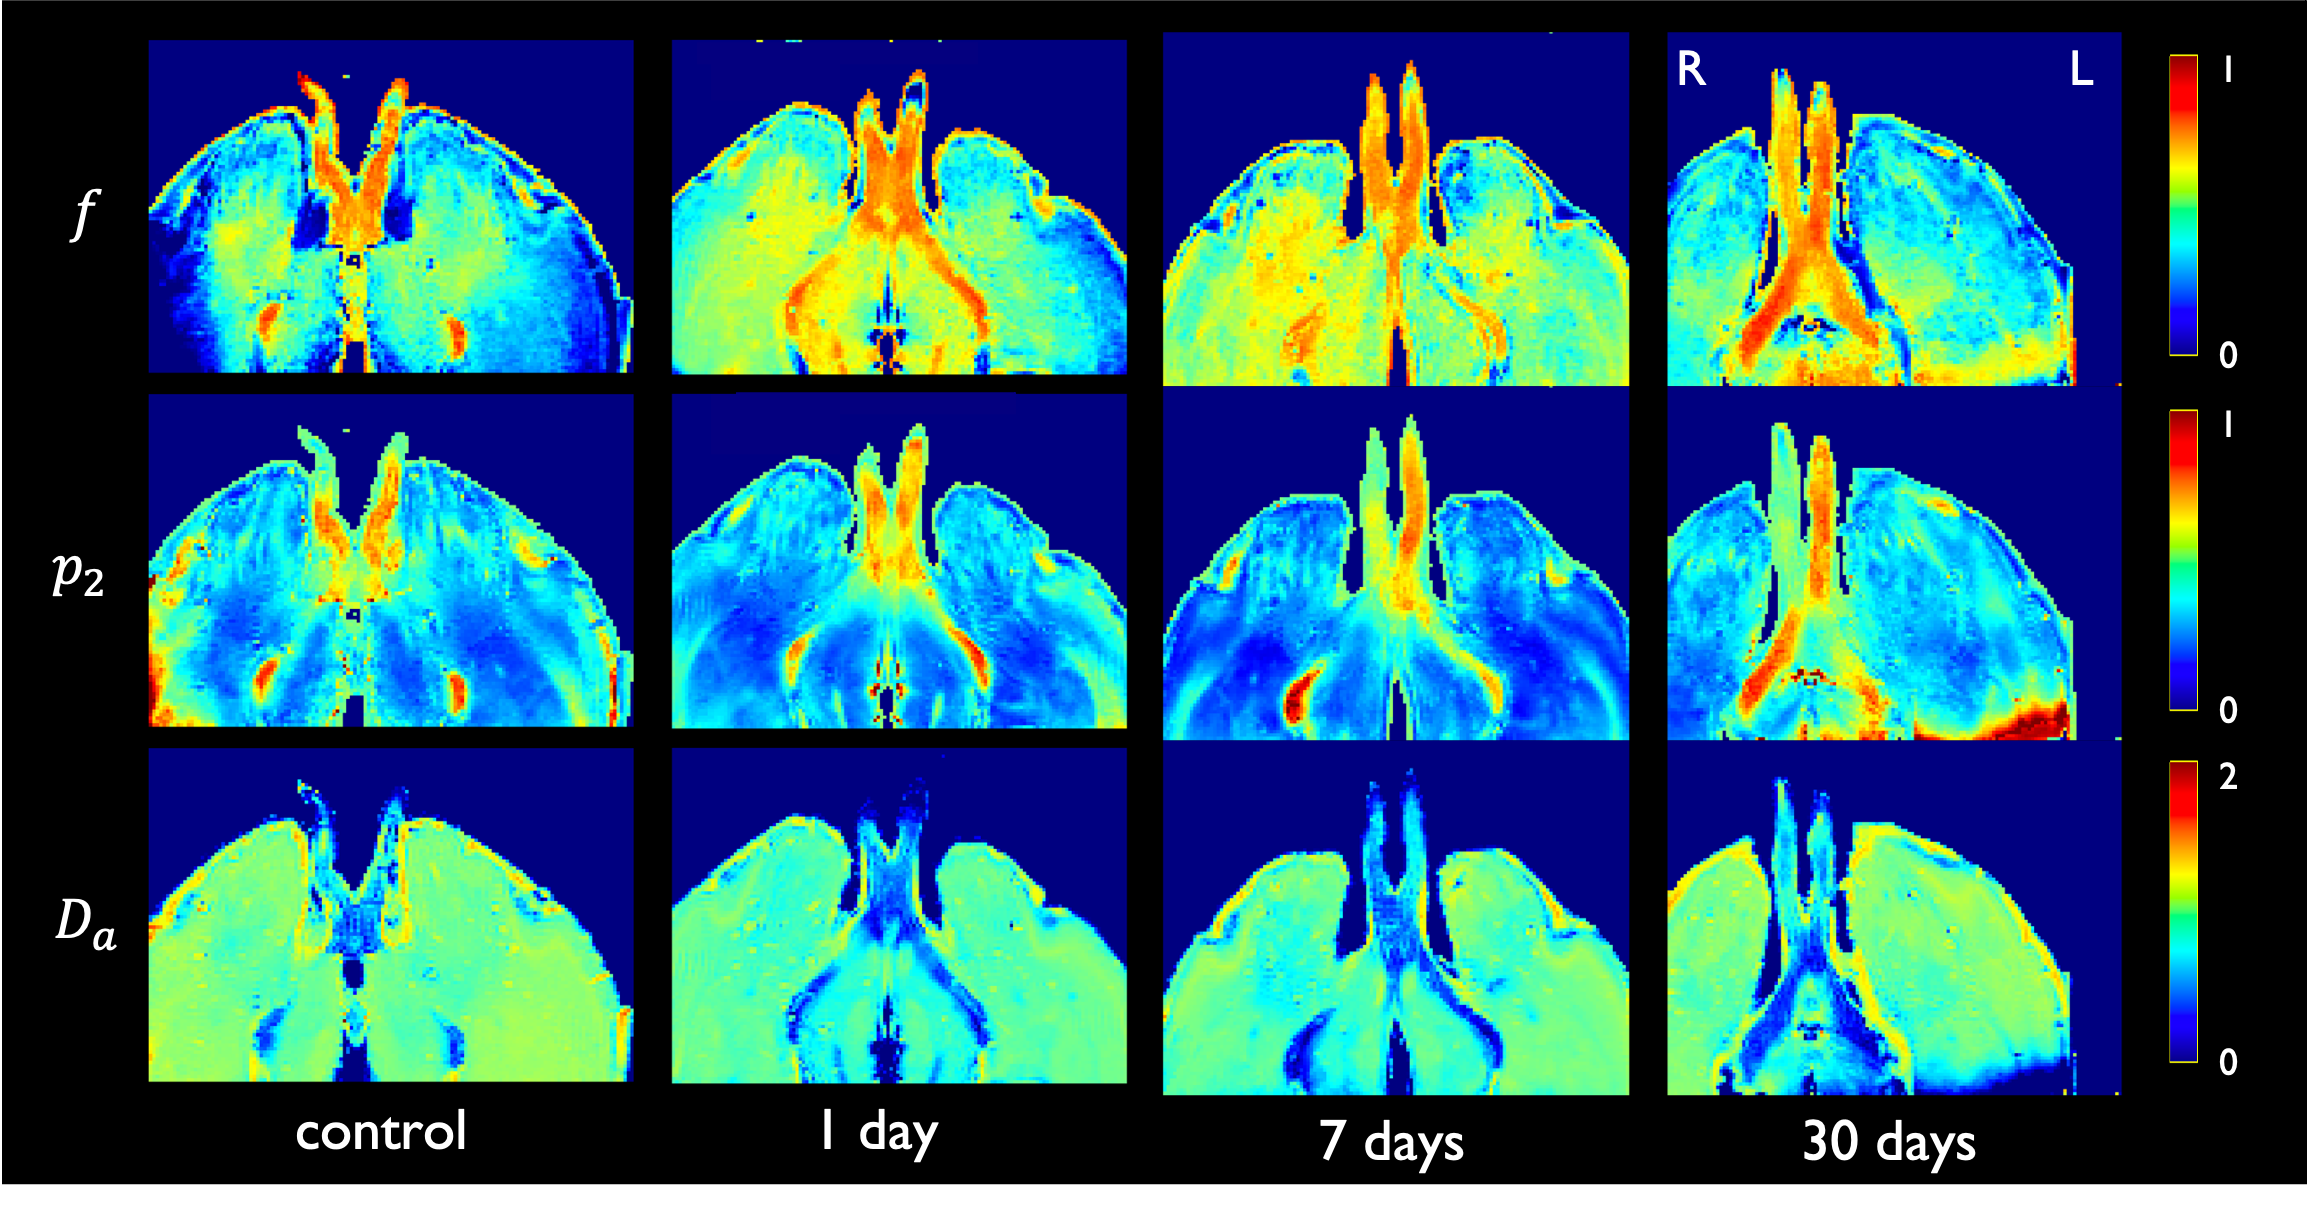
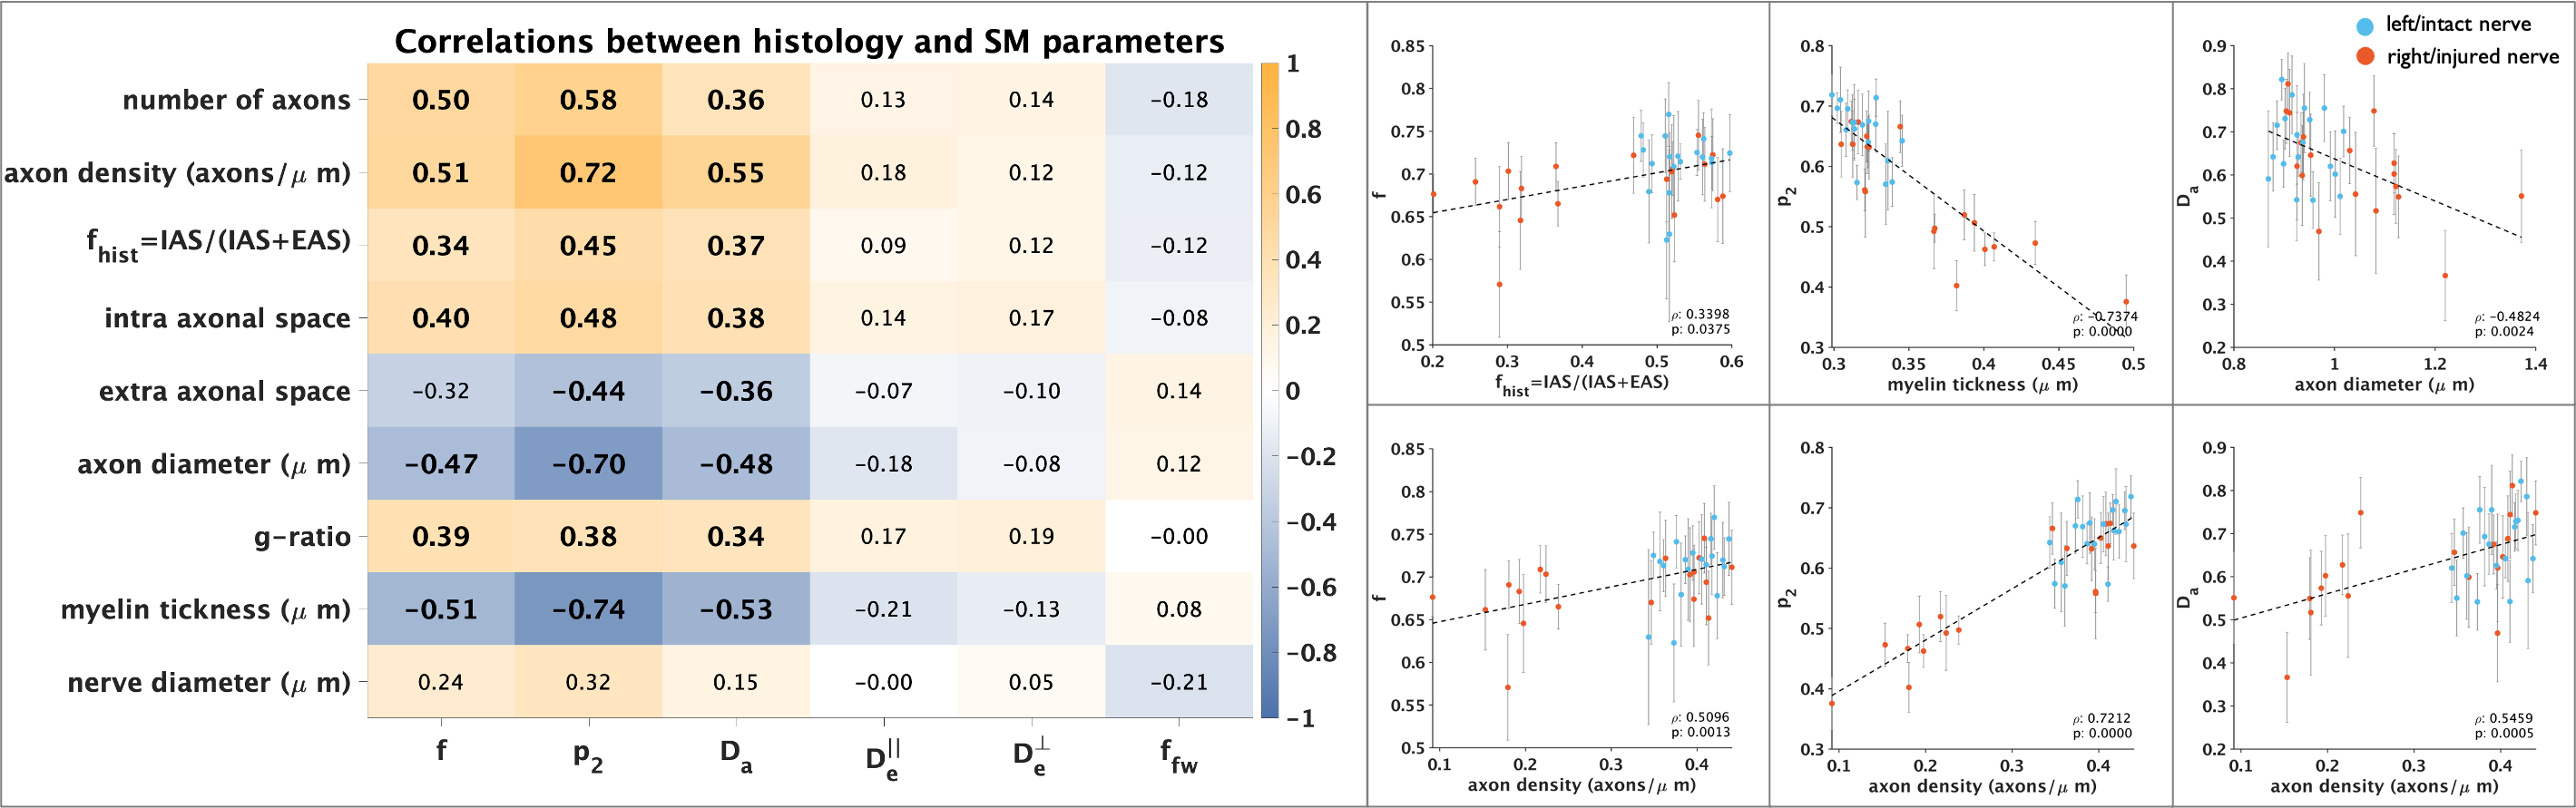
Figure 1 shows changes between injured and intact nerve in histology metrics that reflect mainly axon loss. Figures 2 and 3 show changes in diffusivity/kurtosis metrics, and SM parameters, respectively. Overall, for both histology and dMRI-derived metrics, most significant changes are observed at 7 and 30 days after injury. Observed DTI/DKI changes are consistent with previous works7-11, and the decrease of $$$f$$$ agrees with the axonal loss observed in histology. Other significantly changing SM parameters are $$$p_2$$$, $$$D_a$$$ and $$$D_e^{||}$$$. Parameter maps are shown on Figure 4 for one animal of each group. Figure 5 shows correlations between histology and SM parameters: $$$f$$$ correlates positively with its histology counterpart $$$f_{hist}$$$, and $$$p_2$$$, $$$D_a$$$ and $$$D_e^{||}$$$, also correlate with most histology metrics. While the latter 3 parameters cannot be directly compared with 2D histology, changes in $$$p_2$$$ and $$$D_a$$$ are potentially related to changes in dispersion and axon morphology as observed 52h post-injury26, and the decrease in $$$D_e^{||}$$$ may be explained by an increase of activated microglia and cellularity at day 79,27,28.Discussion and Conclusions
SM parameters could be estimated from relative low-b dMRI using a supervised machine learning approach in a rat retinal ischemia model featuring axonal degeneration. Consistent with histology, changes in $$$f$$$ agree with axon loss, while activated microglia, as observed in previous studies9,27,28, may be captured by decreased $$$D_e^{||}$$$, and could potentially also contribute to the observed increase in orientation dispersion28, as reflected by the decrease in $$$p_2$$$. The drop in $$$D_a$$$ is potentially due to axon beading3,10,24,29, though this pathology is typically observed at the acute and subacute stages of the condition3. Future experiments are planned to address limitations of the current study: the dMRI protocol of this data is not optimal for robust SM estimation and bias may be present13, and the diffusion times employed are potentially too short for the long-time Gaussian-compartment assumption underlying the SM. Both will be addressed by a comprehensive dMRI protocol with varying diffusion times. In addition, limited information could be extracted from 2D photomicrographs, and more detailed information will be obtained by the use of 3D EM30.Acknowledgements
Imaging was performed at the National Laboratory for Magnetic Resonance Imaging (Conacyt, UNAM, CIMAT, UAQ). We thank Juan Ortiz-Retana and Gema Martínez-Cabrera, for technical assistance. Imaging and histology were funded by CONACYT (FC 1782) and UNAM-DGAPA (IG200117, IN204720). Research on biophysical modeling was supported by the National Institute of Neurological Disorders and Stroke of the NIH under awards R01 NS088040 and R21 NS081230, and by the Hirschl foundation, and was performed at the Center of Advanced Imaging Innovation and Research (CAI2R, www.cai2r.net), a Biomedical Technology Resource Center supported by NIBIB with the award P41 EB017183.
References
1. Laura Conforti, Jonathan Gilley, Michael P Coleman. Wallerian degeneration: an emerging axon death pathway linking injury and disease. Nat Rev Neurosci. 2014;15(6):394-409.
2. Martin Kerschensteiner, Martin E Schwab, Jeff W Lichtman, Thomas Misgeld. In vivo imaging of axonal degeneration and regeneration in the injured spinal cord. Nat Med. 2005;11(5):572-7.
3. Min Liu, Donald W Gross, B Matt Wheatley, Luis Concha, Christian Beaulieu. The acute phase of Wallerian degeneration: longitudinal diffusion tensor imaging of the fornix following temporal lobe surgery. Neuroimage. 2013;74:128-39.
4. Bogdan Beirowski, Robert Adalbert, Diana Wagner, Daniela S Grumme, Klaus Addicks, Richard R Ribchester, Michael P Coleman. The progressive nature of Wallerian degeneration in wild-type and slow Wallerian degeneration (WldS) nerves. BMC Neurosci. 2005;6:6.
5. M Adachi, K Takahashi, M Nishikawa, H Miki, M Uyama. High intraocular pressure-induced ischemia and reperfusion injury in the optic nerve and retina in rats. Graefes Arch Clin Exp Ophthalmol. 1996;234(7):445-51.
6. Matthew J Hartsock, Hongkwan Cho, Lijuan Wu, Wan-Ju Chen, Junsong Gong, Elia J Duh. A Mouse Model of Retinal Ischemia-Reperfusion Injury Through Elevation of Intraocular Pressure. J Vis Exp. 2016;14(113):54065.
7. Sheng-Kwei Song, Shu-Wei Sun, Won-Kyu Ju, Shiow-Jiuan Lin, Anne H Cross, Arthur H Neufeld. Diffusion tensor imaging detects and differentiates axon and myelin degeneration in mouse optic nerve after retinal ischemia. Neuroimage. 2003;20(3):1714-22.
8. Shu-Wei Sun, Hsiao-Fang Liang, Anne H Cross, Sheng-Kwei Song. Evolving Wallerian degeneration after transient retinal ischemia in mice characterized by diffusion tensor imaging. Neuroimage. 2008;40(1):1-10.
9. Gilberto Rojas-Vite, Ricardo Coronado-Leija, Omar Narvaez-Delgado, Alonso Ramírez-Manzanares, José Luis Marroquín, Ramsés Noguez-Imm, Marcos L Aranda, Benoit Scherrer, Jorge Larriva-Sahd, Luis Concha. Histological validation of per-bundle water diffusion metrics within a region of fiber crossing following axonal degeneration. Neuroimage. 2019;201:116013
10. Edward S Hui, Els Fieremans, Jens H Jensen, Ali Tabesh, Wuwei Feng, Leonardo Bonilha, Maria V Spampinato, Robert Adams, Joseph A Helpern. Stroke assessment with diffusional kurtosis imaging. Stroke. 2012;43(11):2968-73.
11. Shun Zhang, Wenjie Zhu, Yan Zhang, Yihao Yao, Jingjing Shi, Cong-Yi Wang, Wenzhen Zhu. Diffusional kurtosis imaging in evaluating the secondary change of corticospinal tract after unilateral cerebral infarction. Am J Transl Res. 2017;9(3):1426-1434
12. Dmitry S Novikov, Els Fieremans, Sune N Jespersen, Valerij G Kiselev. Quantifying brain microstructure with diffusion MRI: Theory and parameter estimation. NMR Biomed. 2019;32(4):e3998.
13. Ileana O Jelescu, Jelle Veraart, Els Fieremans, Dmitry S Novikov. Degeneracy in model parameter estimation for multi-compartmental diffusion in neuronal tissue. NMR Biomed. 2016;29(1):33-47.
14. Dmitry S Novikov, Jelle Veraart, Ileana O Jelescu, Els Fieremans. Rotationally-invariant mapping of scalar and orientational metrics of neuronal microstructure with diffusion MRI. Neuroimage. 2018;174:518-538.
15. Marco Reisert, Elias Kellner, Bibek Dhital, Jürgen Hennig, Valerij G Kiselev. Disentangling micro from mesostructure by diffusion MRI: A Bayesian approach. Neuroimage. 2017;147:964-975.
16. Johannes Schindelin, Ignacio Arganda-Carreras, Erwin Frise, Verena Kaynig, Mark Longair, Tobias Pietzsch, Stephan Preibisch, Curtis Rueden, Stephan Saalfeld, Benjamin Schmid, Jean-Yves Tinevez, Daniel James White, Volker Hartenstein, Kevin Eliceiri, Pavel Tomancak, Albert Cardona. Fiji: an open-source platform for biological-image analysis. Nat Methods. 2012;9(7):676-82.
17. Aldo Zaimi, Tanguy Duval, Alicja Gasecka, Daniel Côté, Nikola Stikov, Julien Cohen-Adad. AxonSeg: Open Source Software for Axon and Myelin Segmentation and Morphometric Analysis. Front Neuroinform. 2016;10:37.
18. Jelle Veraart, Dmitry S Novikov, Daan Christiaens, Benjamin Ades-Aron, Jan Sijbers, Els Fieremans. Denoising of diffusion MRI using random matrix theory. Neuroimage. 2016;142:394-406.
19. Elias Kellner, Bibek Dhital, Valerij G Kiselev, Marco Reisert. Gibbs-ringing artifact removal based on local subvoxel-shifts. Magn Reson Med. 2016;76(5):1574-1581.
20. Nicholas J Tustison, Brian B Avants, Philip A Cook, Yuanjie Zheng, Alexander Egan, Paul A Yushkevich, James C Gee. N4ITK: improved N3 bias correction. IEEE Trans Med Imaging. 2010;29(6):1310-20.
21. B B Avants, C L Epstein, M Grossman, J C Gee. Symmetric diffeomorphic image registration with cross-correlation: evaluating automated labeling of elderly and neurodegenerative brain. Med Image Anal. 2008;12(1):26-41.
22. H Gudbjartsson, S Patz. The Rician distribution of noisy MRI data. Magn Reson Med. 1995;34(6):910-4.
23. Jelle Veraart, Jan Sijbers, Stefan Sunaert, Alexander Leemans, Ben Jeurissen. Weighted linear least squares estimation of diffusion MRI parameters: strengths, limitations, and pitfalls. Neuroimage. 2013;81:335-346.
24. Matthew D Budde, Joseph A Frank. Neurite beading is sufficient to decrease the apparent diffusion coefficient after ischemic stroke. Proc Natl Acad Sci. 2010;107(32):14472-7
25. C Guglielmetti, J Veraart, E Roelant, Z Mai, J Daans, J Van Audekerke, M Naeyaert, G Vanhoutte, R Delgado Y Palacios, J Praet, E Fieremans, P Ponsaerts, J Sijbers, A Van der Linden, M Verhoye. Diffusion kurtosis imaging probes cortical alterations and white matter pathology following cuprizone induced demyelination and spontaneous remyelination. Neuroimage. 2016;125:363-377.
26. Bogdan Beirowski, Livia Berek, Robert Adalbert, Diana Wagner, Daniela S Grumme, Klaus Addicks, Richard R Ribchester, Michael P Coleman. Quantitative and qualitative analysis of Wallerian degeneration using restricted axonal labelling in YFP-H mice. J Neurosci Methods. 2004;134(1):23-35.
27. Marina Palmhof, Natalie Wagner, Clarissa Nagel, Nora Biert, Gesa Stute, H Burkhard Dick, Stephanie C Joachim. Retinal ischemia triggers early microglia activation in the optic nerve followed by neurofilament degeneration. Exp Eye Res. 2020 Sep;198:108133.
28. Radouil Tzekov, Alexandra Quezada, Megan Gautier, Davida Biggins, Candice Frances, Benoit Mouzon, Jeff Jamison, Michael Mullan, Fiona Crawford. Repetitive mild traumatic brain injury causes optic nerve and retinal damage in a mouse model. J Neuropathol Exp Neurol. 2014;73(4):345-61.
29. Hong-Hsi Lee, Antonios Papaioannou, Sung-Lyoung Kim, Dmitry S Novikov, Els Fieremans. A time-dependent diffusion MRI signature of axon caliber variations and beading. Commun Biol. 2020;3(1):354.
30. Hong-Hsi Lee, Katarina Yaros, Jelle Veraart, Jasmine L Pathan, Feng-Xia Liang, Sungheon G Kim, Dmitry S Novikov, Els Fieremans. Along-axon diameter variation and axonal orientation dispersion revealed with 3D electron microscopy: implications for quantifying brain white matter microstructure with histology and diffusion MRI. Brain Struct Funct. 2019;224(4):1469-1488.
Figures