2037
Validation of MRI-based axon radius index estimation using large-scale light microscopy and deep learning1Department of Systems Neurosciences, University Medical Center Hamburg-Eppendorf, Hamburg, Germany, 2Department of Neurophysics, Max Planck Institute for Human Cognitive and Brain Sciences, Leipzig, Germany, 3Paul Flechsig Institute of Brain Research, University of Leipzig, Leipzig, Germany, 4Berlin Ultrahigh Field Facility (B.U.F.F.), Max-Delbrueck-Center for Molecular Medicine in the Helmholtz Association, Berlin, Germany, 5Felix Bloch Institute for Solid State Physics, Faculty of Physics and Earth Sciences, Leipzig University, Leipzig, Germany
Synopsis
We used a new method for validation of MRI-based axon radius index (ARI) mapping using large-scale light microscopy (lsLM) that provides a good representation of the fraction of large axons - the main contributors to the MRI-based ARI. The proposed method captures 100-1000 times more axons than current standard small field of view microscopy. We showed that the one-to-one correspondence between MRI-based ARI and lsLM-based effective axon radius is superior to the current standard method.
Introduction
The main drivers of the MRI-based axon radius index (ARI) are large, sparsely occurring axons. In previous studies, validation of MRI-based ARI was limited to the comparison with small field of view microscopy like manually-labeled electron microscopy (mlEM) that covered a small number of axons (~1000 axons) 1, 2, 3, 4, 5, 6. In contrast, large-scale light microscopy (lsLM) can capture 100-1000 times more axons and thus has been hypothesized to be a more representative reference for validating MRI-based ARI mapping 7, 8. In this proof-of-principle study, we test this hypothesis by comparing MRI-based ARIs 2 for fixed human ex vivo corpus callosum (CC) with its histological mlEM and lsLM counterparts.Materials and Methods
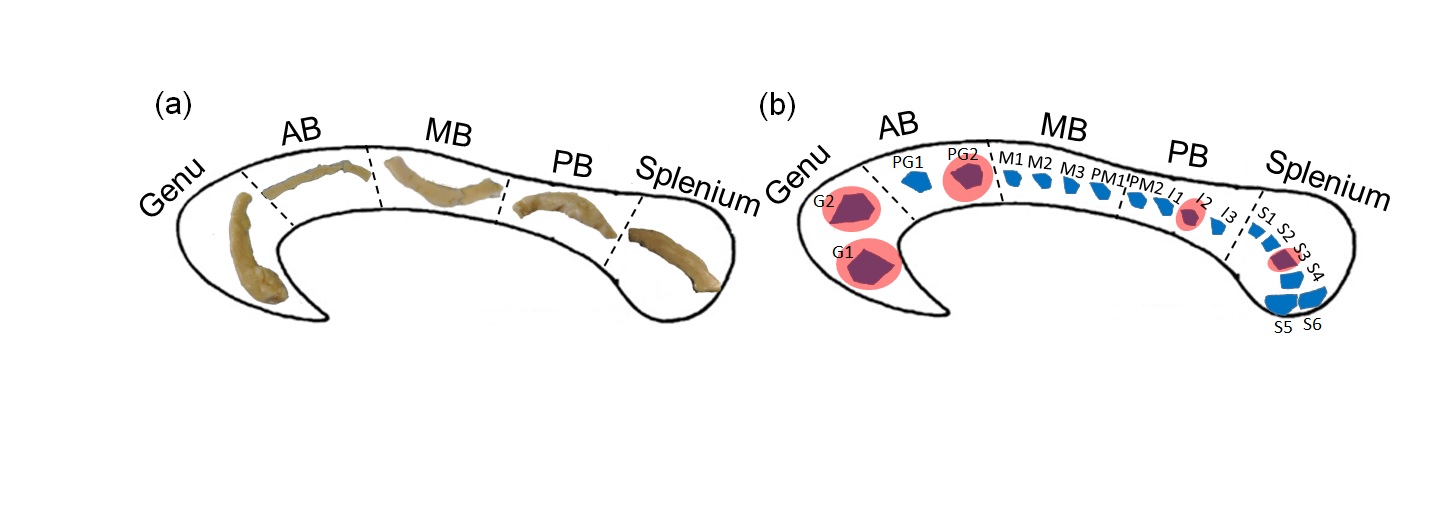
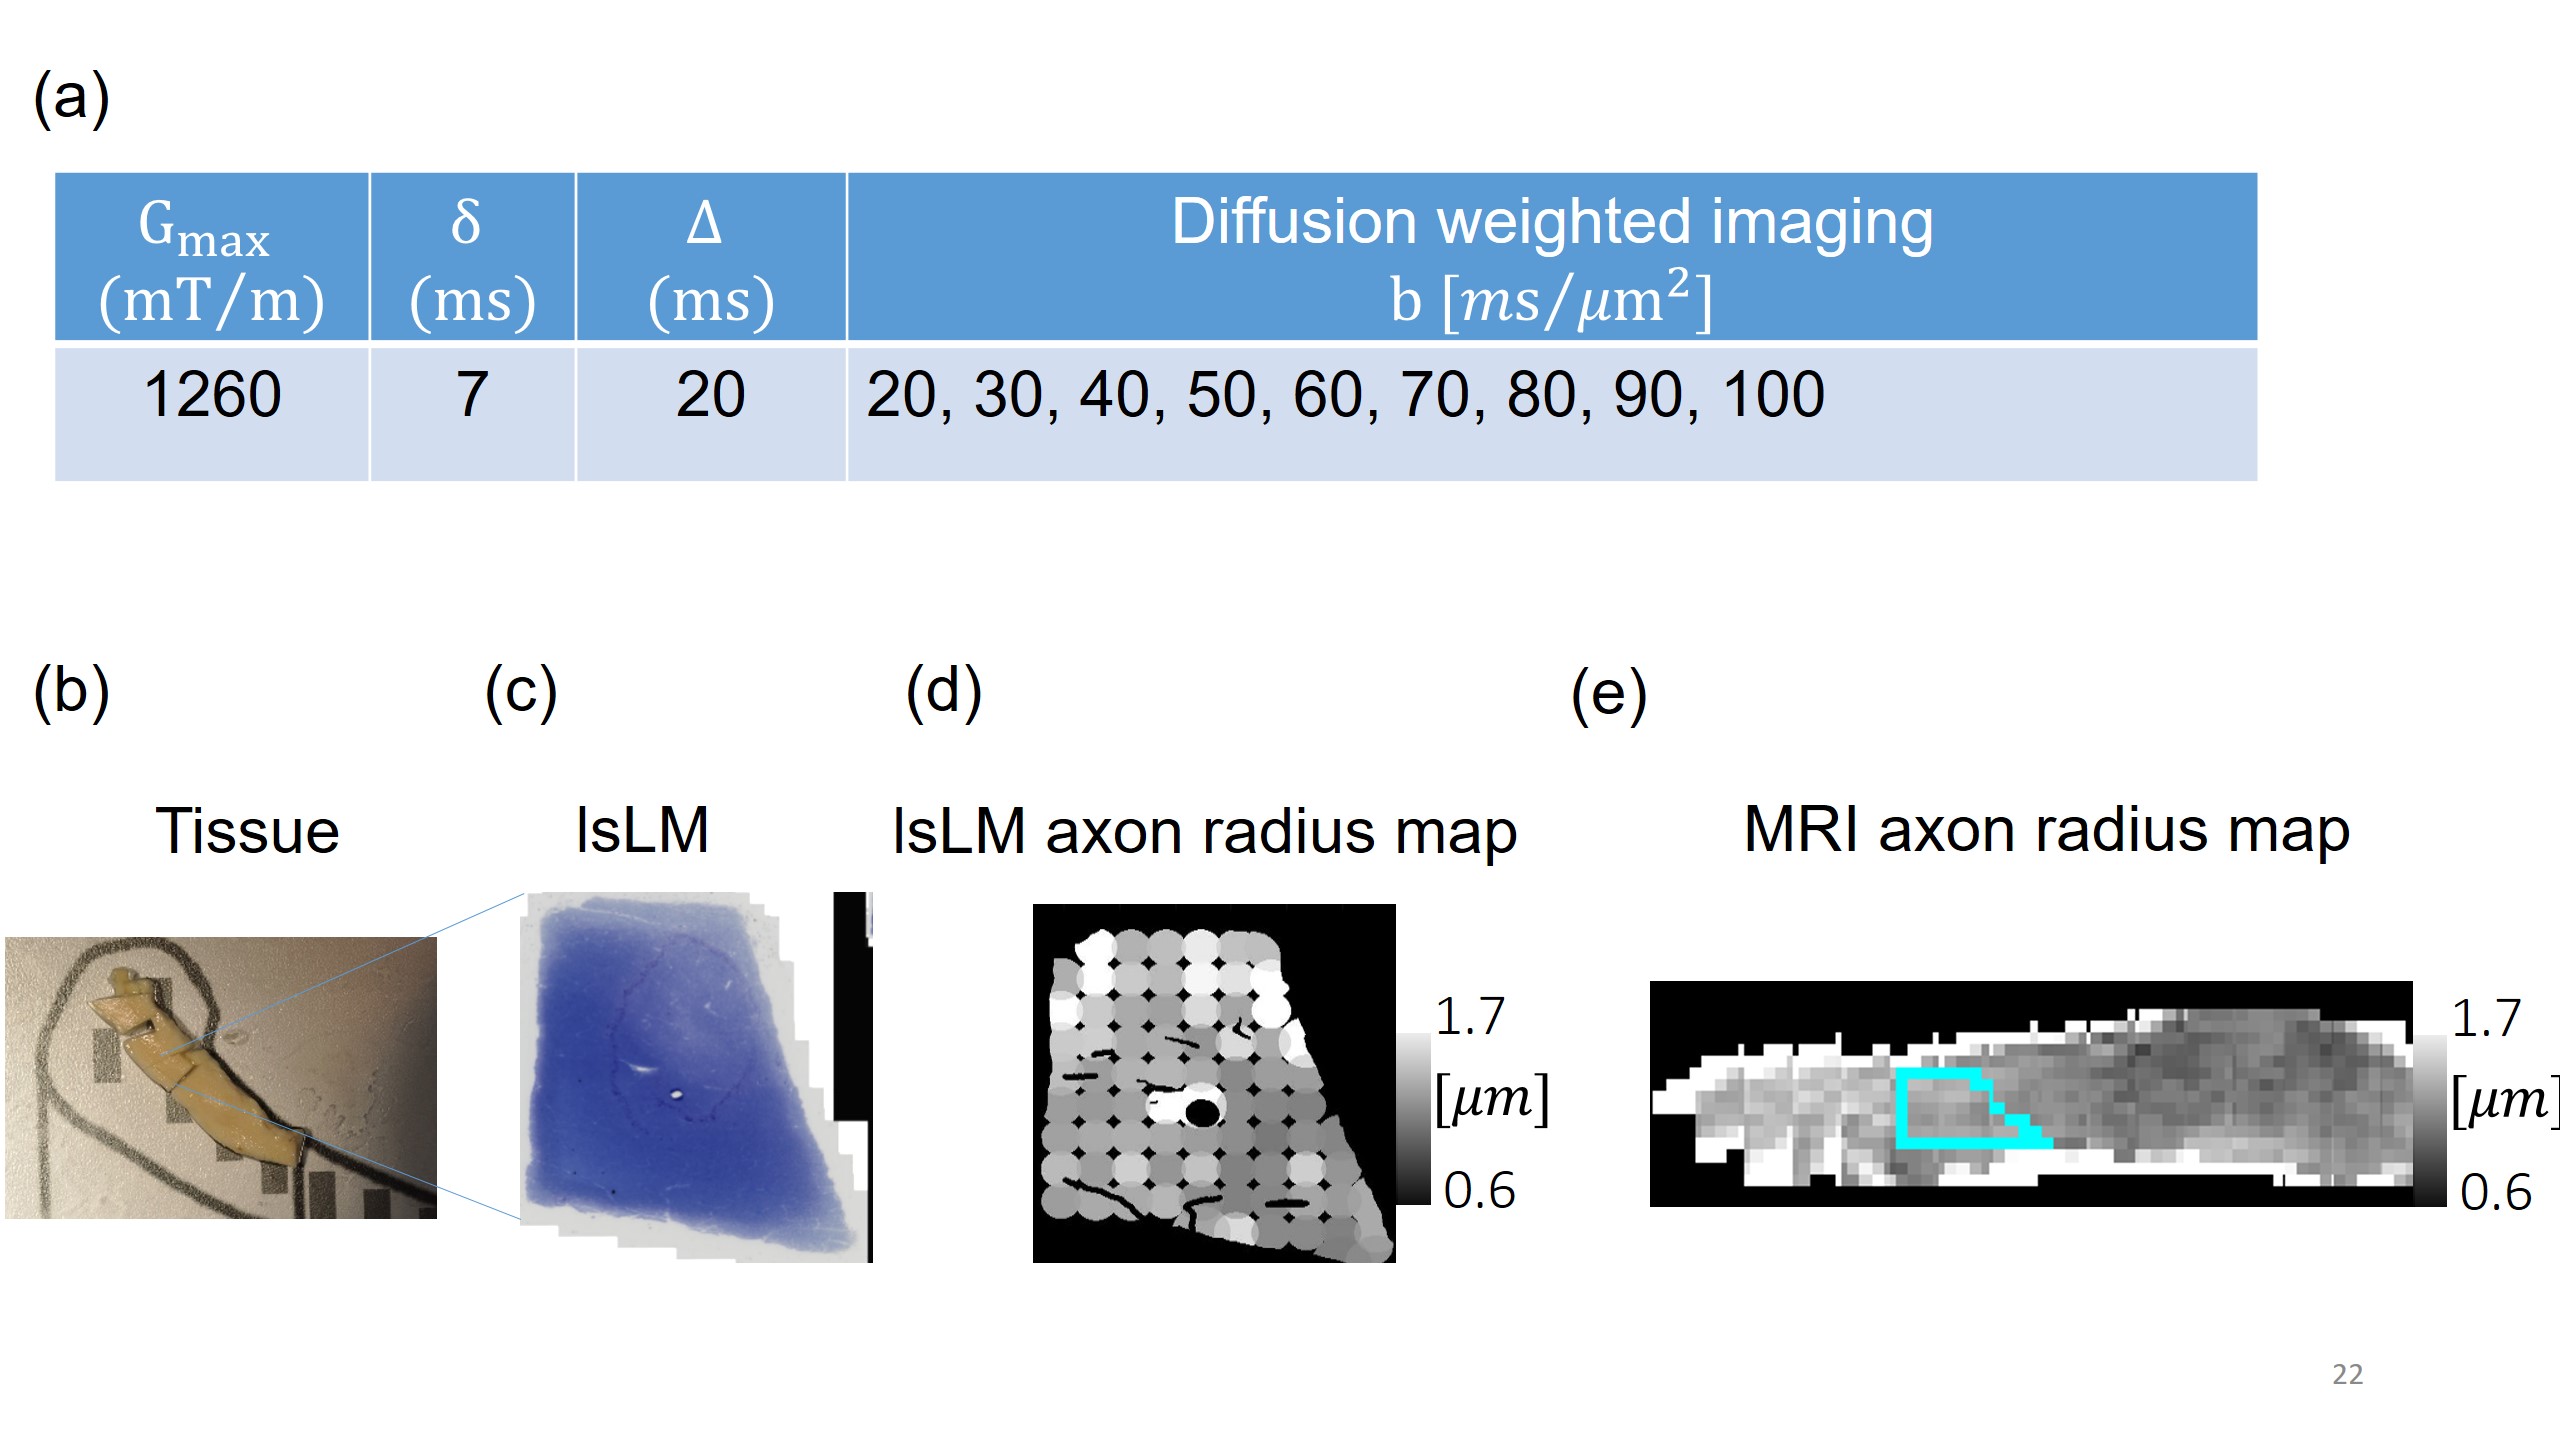
Sample: A human CC sample was obtained at autopsy with prior informed consent (Approval #205/17-ek, 24 hrs postmortem delay, cause of death: multiorgan failure) and approved by responsible authorities. Following the Brain Bank procedures, blocks were immersion-fixed with 3% paraformaldehyde and 1% glutaraldehyde in phosphate-buffered saline (PBS, pH 7.4) at 4°C (Fig. 1a).Histology: We acquired eighteen lsLM images of semi-thin (500 nm) sections using a Zeiss AxioScan Z1 (resolution: 0.112 µm/px; resolution limit: 0.3 µm) and five mlEM images of consecutively cut, ultra-thin (50 nm) sections using a Zeiss EM 912 Omega (resolution: 0.0043 µm/px) (Fig. 1b).
Axon radii from histology: lsLM data was segmented into three classes (myelin, axon, background) using an in-house developed convolutional network 7, 8. In addition, mlEM data was labeled manually. Finally, individual axon radius in both processed lsLM and mlEM were estimated as circles with equivalent areas.
Effective axon radii from histology: We calculated the effective axon radius $$$r_{\text{eff}}$$$ from histological axon radius distribution as proposed 9 $$$r_{\text{eff}}≡\sqrt[4]{\frac{<r^4>}{<r^2>}}$$$
MRI: Ex vivo diffusion MRI from the aforementioned sample was performed on a small bore 9.4T MR system (Bruker Biospin, Ettlingen, Germany) using a gradient insert coil and a 4 TX/ 4 RX RF-coil (details of protocol in Fig. 2a).
Axon radii from MRI: Using diffusion dataset with shells from 20 to 100 ms/µm2, the MRI-based ARI was estimated according to the approach introduced by Veraart et al. 2.
Accuracy of MRI axon radius: To evaluate the error of MRI-based ARI, we calculated the root-mean-square error (RMSE) between MRI-based ARI and histological $$$r_{\text{eff}}$$$ as following: $$RMSE=\sqrt[2]{\frac{\sum_{n=1}^N (X_n-\overline{X_n})^2}{N}}~~ [1]$$
where $$$X$$$ and $$$\overline{X}$$$ are MRI-based ARI and histological $$$r_{\text{eff}}$$$ and $$$N$$$ is the number of region of interests.
Results and Discussion
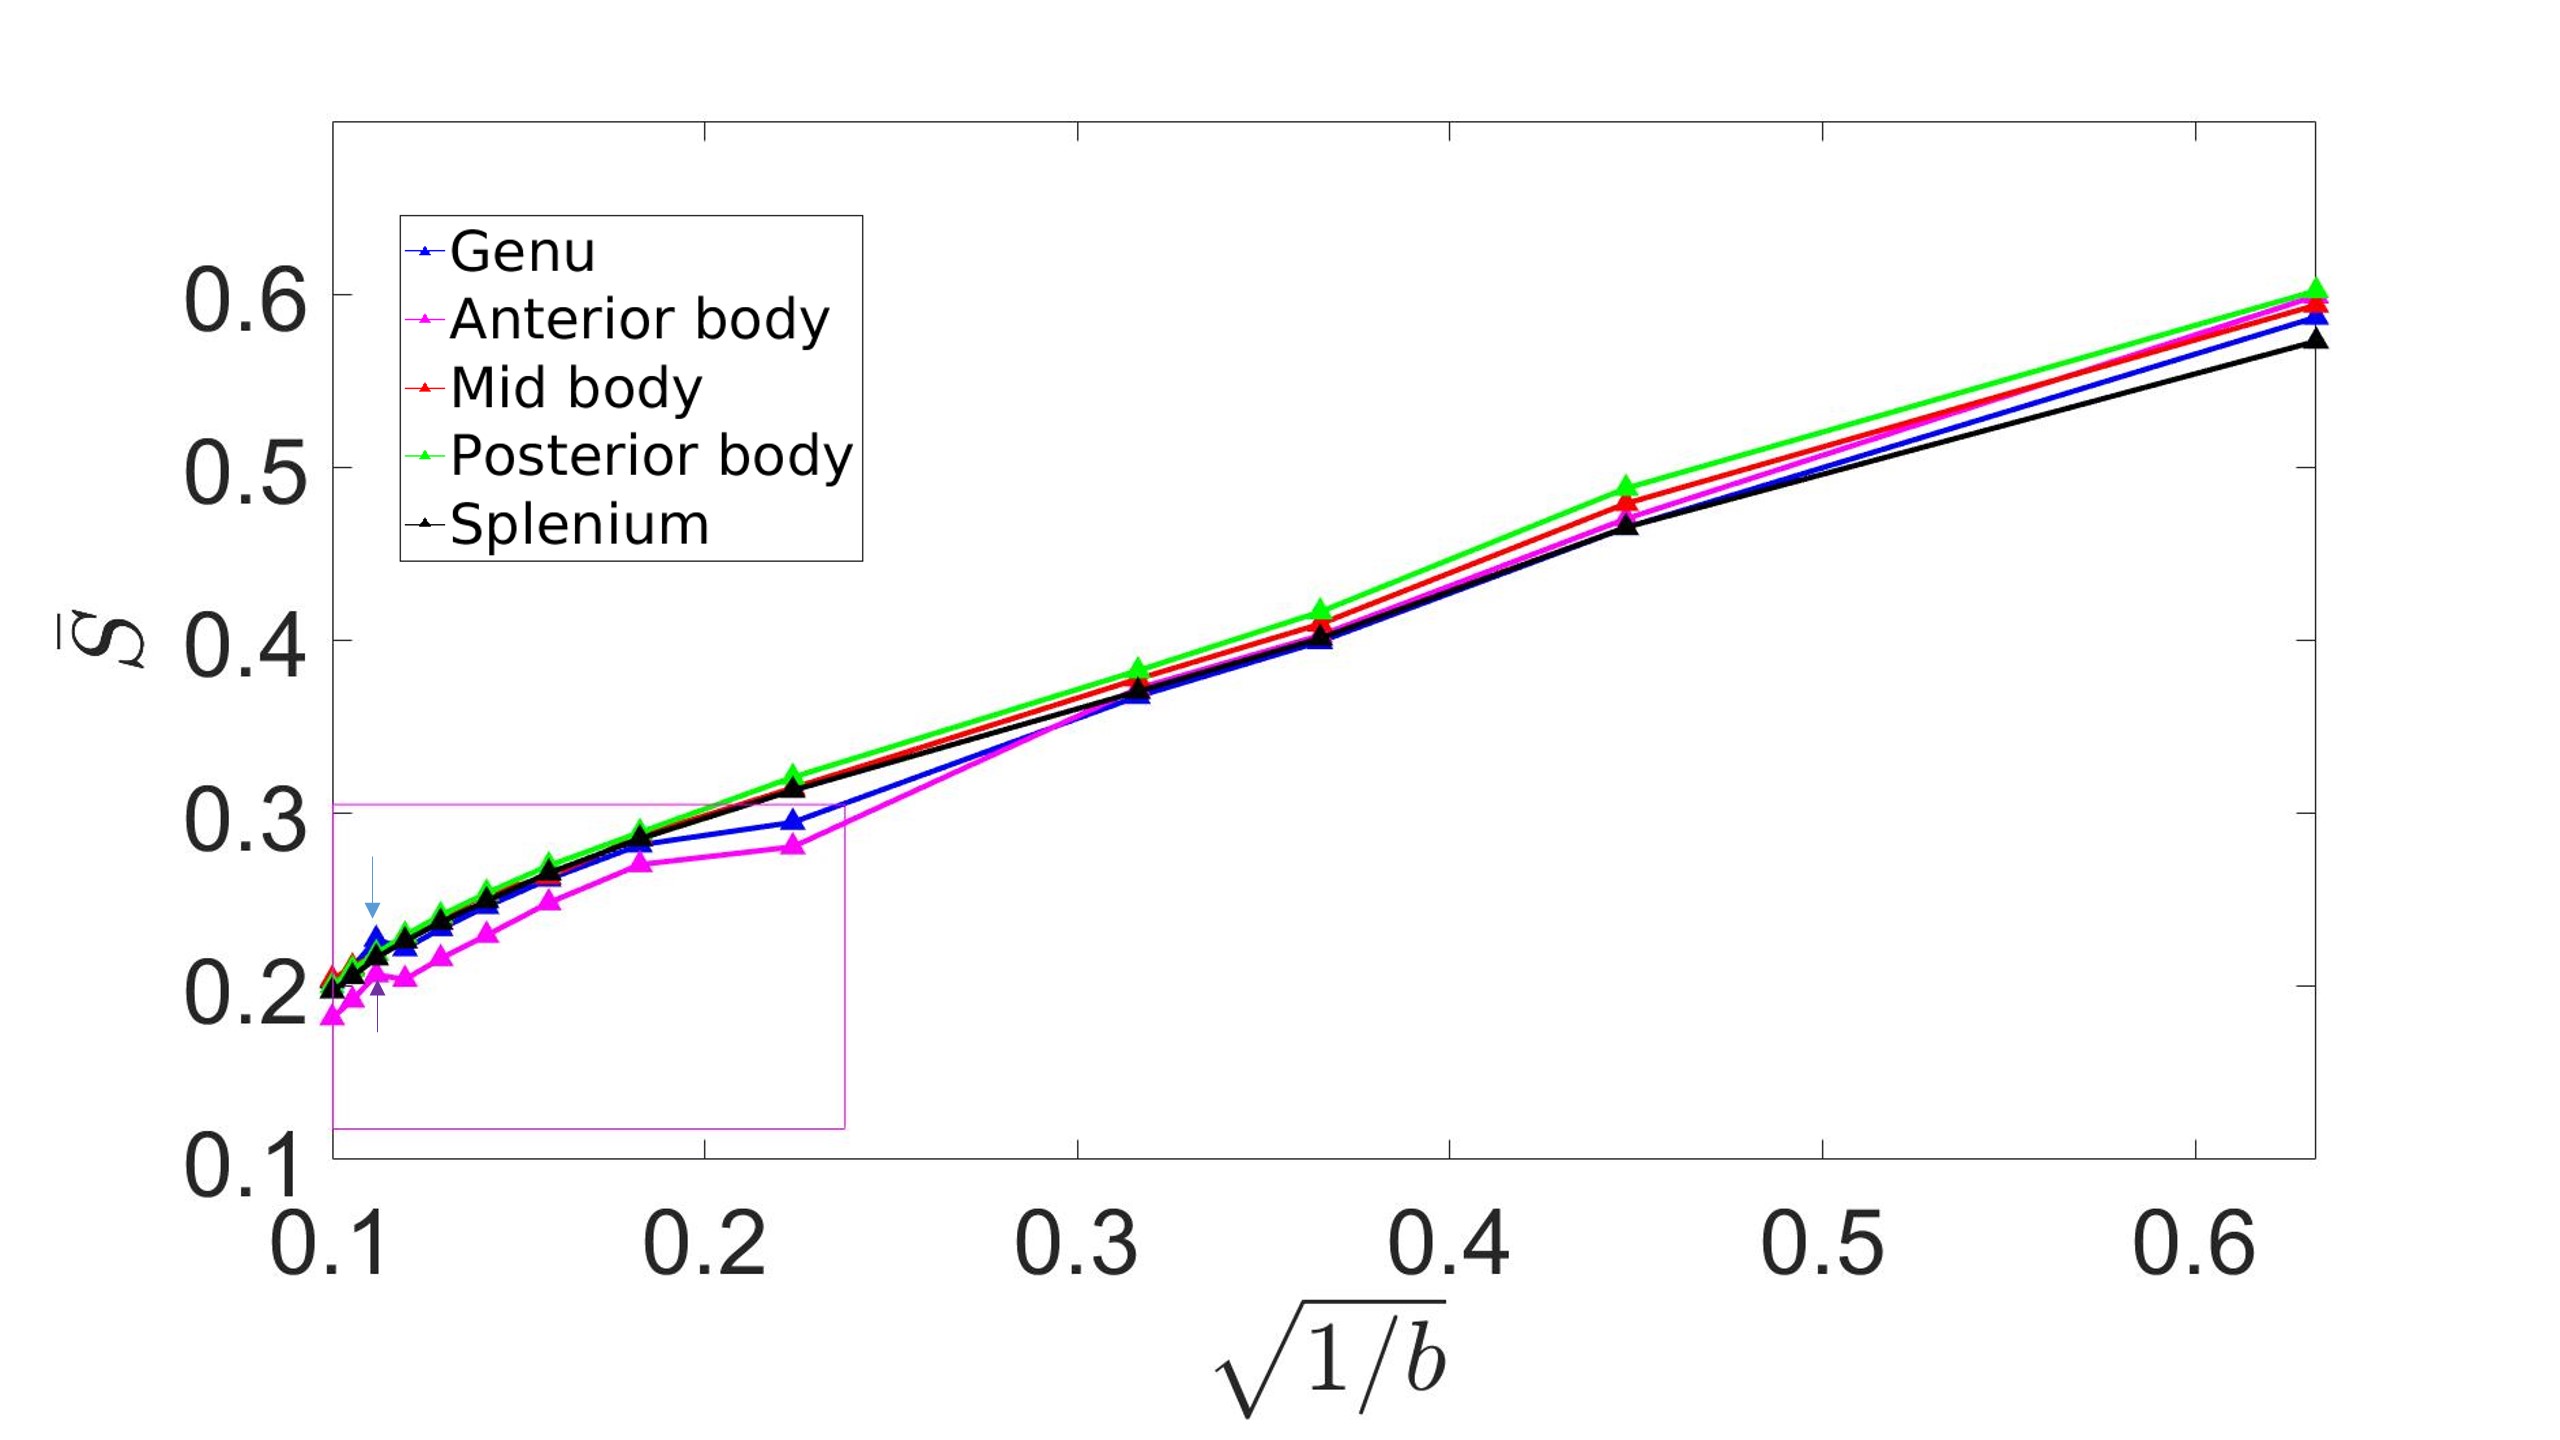
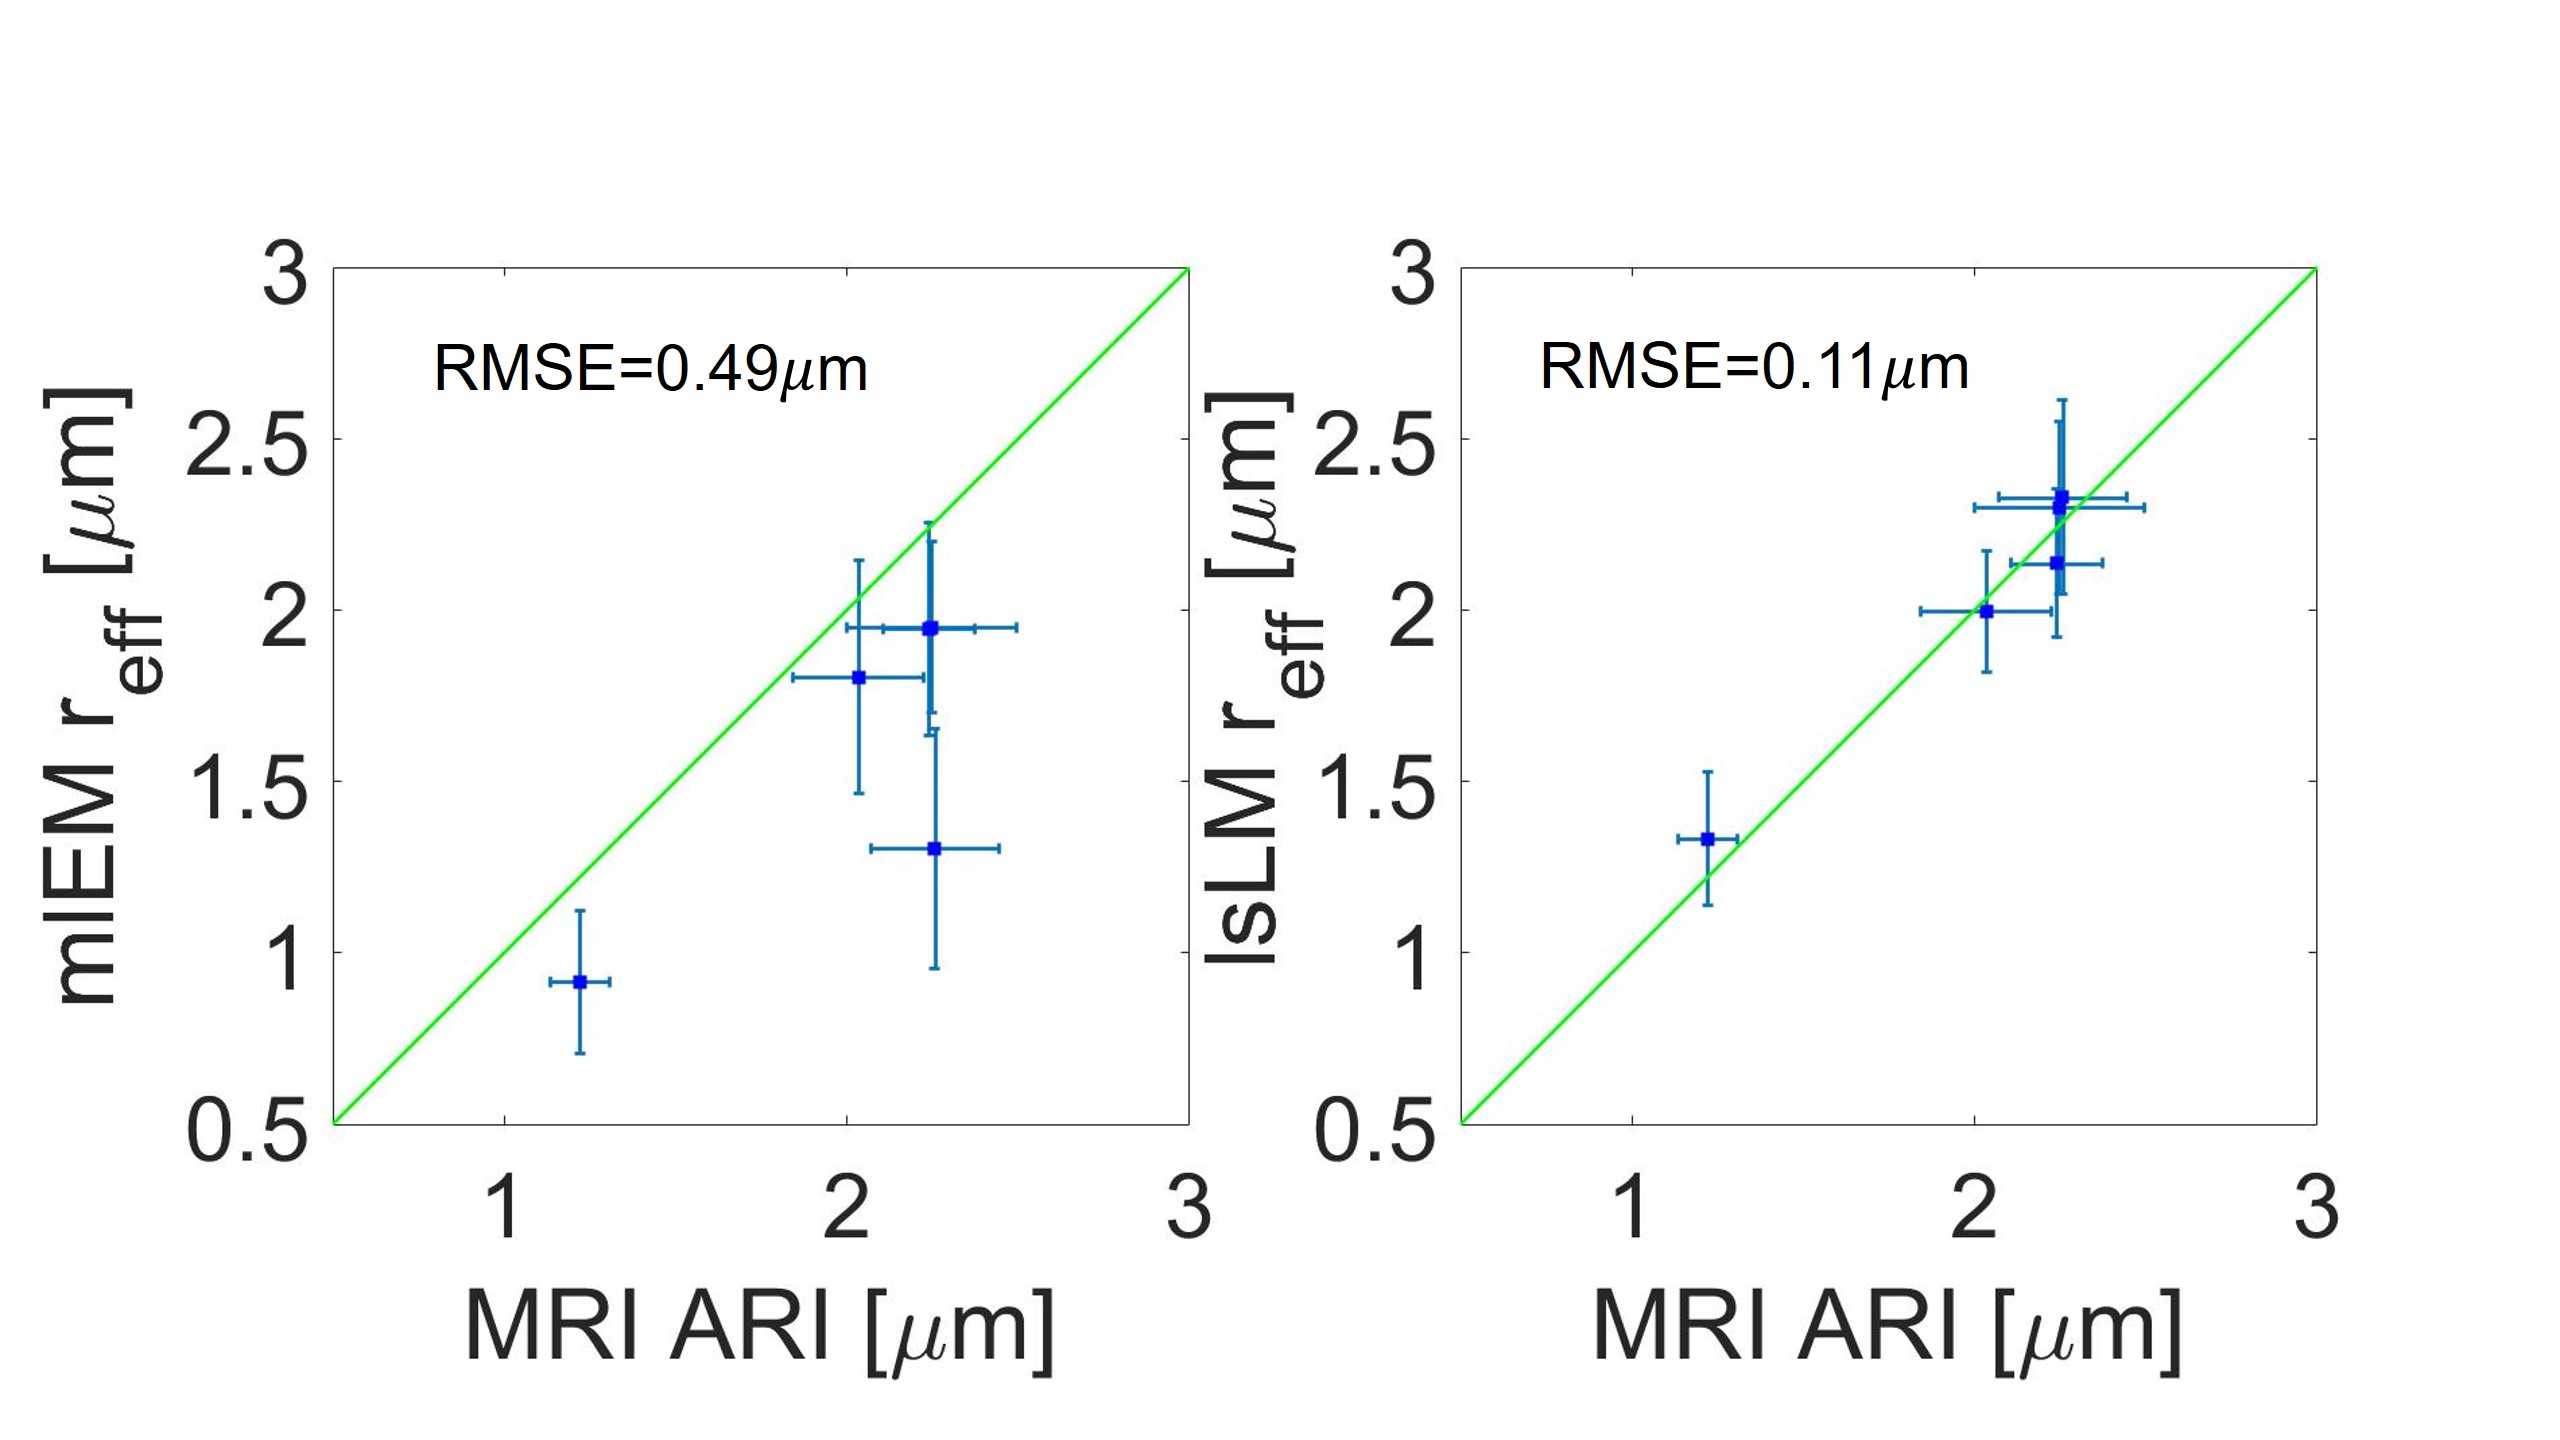
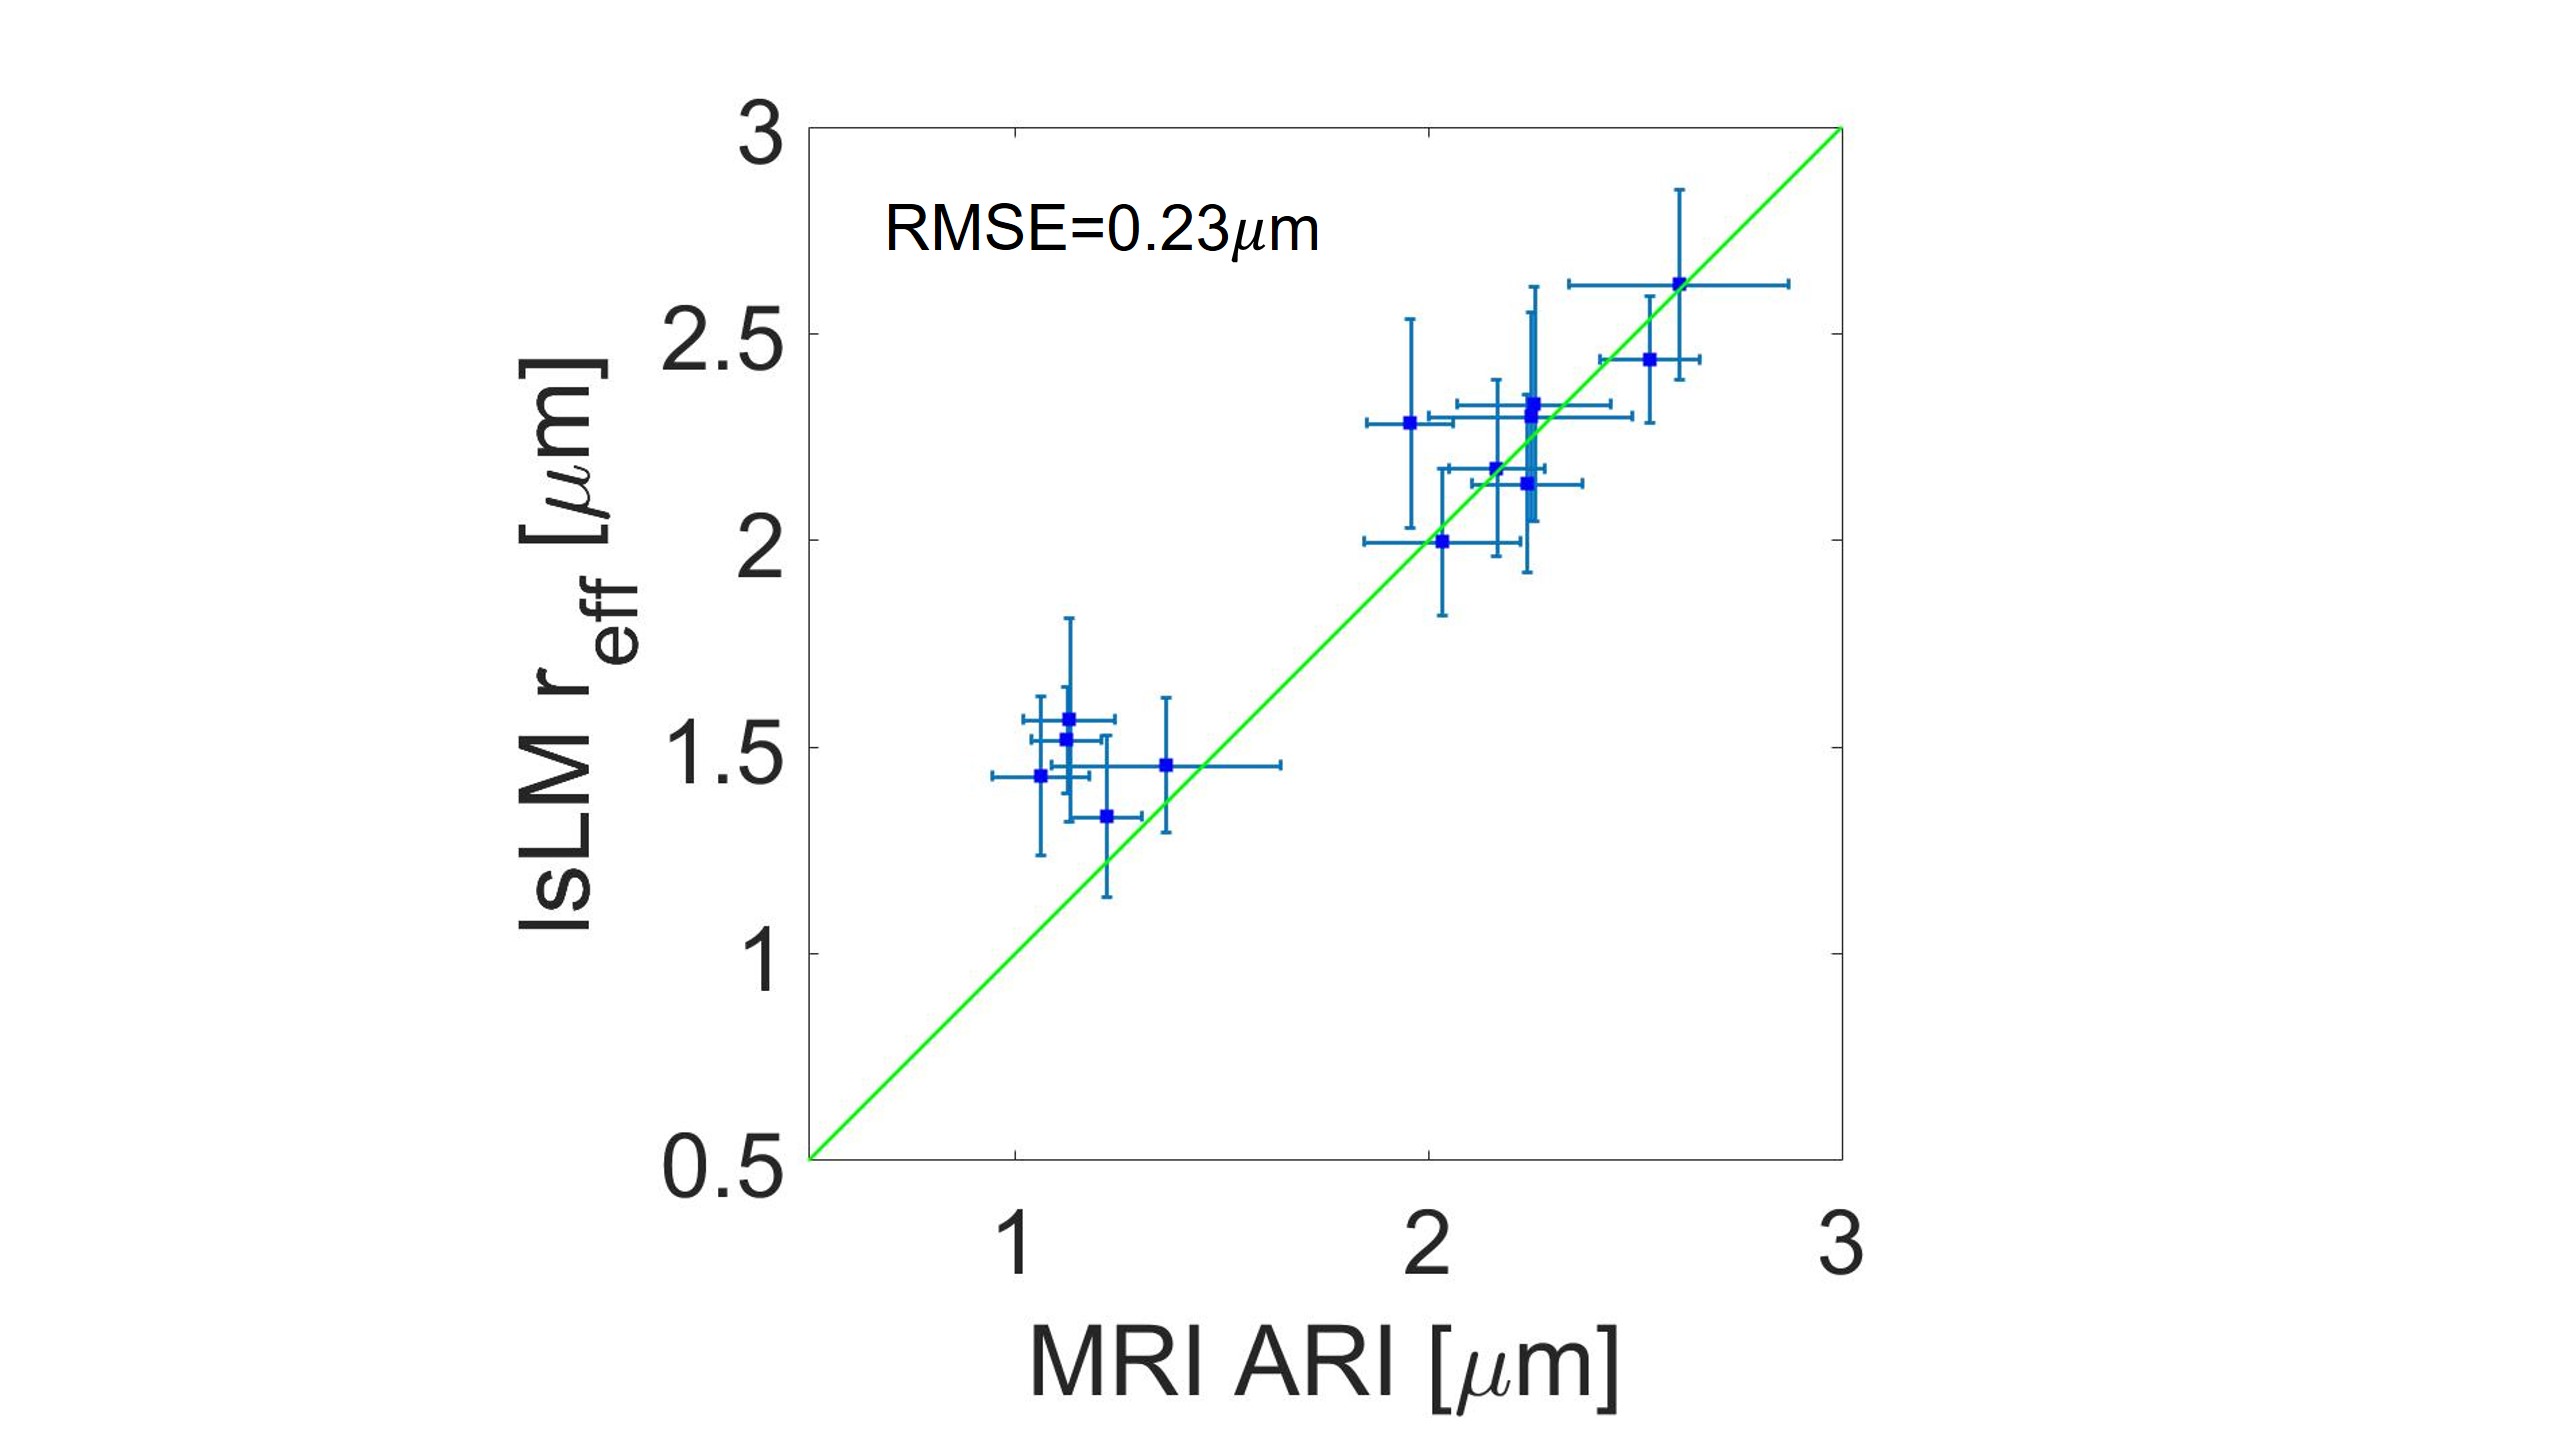
Figure 3 shows the averaged signal for the different fixed samples of CC as a function of b-values up to 100 ms/µm2. There was an unexpected increase in normalized diffusion signal in the genu and anterior body for b value of 80 ms/µm2 and we removed the shell from our analysis. Figure 4 shows the one by one comparison between MRI-based ARIs on the side, and mlEM-based and lsLM-based $$$r_{\text{eff}}$$$, on the other side, for five region of interests (ROIs) in the human CC where both microscopy modalities were acquired. We found that MRI-based ARI showed a smaller RMSE (0.1 µm) when compared to lsLM-based $$$r_{\text{eff}}$$$ than when compared to mlEM-based $$$r_{\text{eff}}$$$ (0.49 µm). Figure 5 shows the one by one comparison between MRI-based ARIs and lsLM-based $$$r_{\text{eff}}$$$ for thirteen ROIs across the entire human CC. Here, the RMSE was 0.23 µm.Conclusion
Our results confirm that lsLM is an improved reference standard compared to the mlEM for validating MRI-based ARI. We plan to use this approach for better understanding the limitations of the MRI-based ARI approach.Acknowledgements
The Max Planck Institute for Human Cognitive and Brain Sciences has an institutional research agreement with Siemens Healthcare. NW was a speaker at an event organized by Siemens Healthcare and was reimbursed for the travel expenses.The research leading to these results has received funding from the European Research Council under the European Union's Seventh Framework Programme (FP7/2007-2013) / ERC grant agreement n° 616905.
This work was supported by the German Research Foundation (DFG Priority Program 2041 "Computational Connectomics”, by the Emmy Noether Stipend: MO 2397/4-1) and by the BMBF (01EW1711A and B) in the framework of ERA-NET NEURON.
References
1. Alexander, D.C. et al. Orientationally invariant indices of axon diameter and density from diffusion MRI. NeuroImage. 2010; 52(4):1374–1389.
2. Veraart, J. et al. Noninvasive quantification of axon radii using diffusion MRI eLife. 2019; 9.
3. Aboitiz, F. et al. Fiber composition of the human, corpus callosum, Biol Res. 1992; 25:51-61.
4. Caminiti, R. et al. Evolution amplified processing with temporally dispersed slow neuronal connectivity in primates. PNAS. 2009; 106.
5. Keyserlingk, D. et al. Diameter of axons and thickness of myelin sheaths of the pyramidal tract fibres in the adult human medullary pyramid. Anat Anz.1984; 157.
6. Liewald, D. et al. Distribution of axon diameters in cortical white matter: an electron-microscopic study on three human brains and a macaque. Biol Cybern. 2014; 108, 541–557.
7. Mordhorst, L. et al. Human Axon Radii Estimation at MRI Scale Deep Learning Combined with Large-scale Light Microscopy. BVM conference 2020.
8. Mordhorst, L. et al. Towards Accurate Estimation of Microstructural Properties from Large-scale Light Microscopy Images Using Deep Learning: Validation by Electron Microscopy. ESMRMB conference 2020.
9. Benjamini, Dan. et al. White matter microstructure from non-parametric axon diameter distribution mapping. NeuroImage. 2014; 135: 333-344.
Figures