2036
Selective microstructure-size filters for non-invasive quantitative MRI1Laboratorio de Espectroscopía e Imágenes por RMN, Departamento de Física Médica, Centro Atómico Bariloche - CNEA - CONICET, Bariloche, Argentina, 2Instituto Balseiro, CNEA, Universidad Nacional de Cuyo, Bariloche, Argentina, 3Support Center for Advanced Neuroimaging (SCAN), Institute for Diagnostic and Interventional Neuroradiology, University Hospital of Bern, University of Bern, Bern, Switzerland
Synopsis
Extracting quantitative microstructure information of living-tissue by non-invasive imaging is an outstanding challenge for understanding disease mechanisms. We introduce a method to make selectively images of microstructure-sizes by probing molecule diffusion with MRI. It relies on designing dynamical control of nuclear spins to sense magnetization “decay-shifts” rather than the commonly used spin-echo decay-rates. The feasibility and performance of the method are illustrated with proof-of-principle experiments and simulations on typical size-distributions of white-matter in the mouse brain. These results position spin-echo decay-shifts as a promising MRI tool to perform non-invasive histology without assuming a microstructure distribution model.
Introduction
Extracting quantitative microstructure information of living-tissue by non-invasive imaging is an outstanding challenge for understanding disease mechanisms and allowing early-stage diagnosis of pathologies. Non-Oscillating Gradient Spin Echo (NOGSE) is a diffusion-based imaging method that has been presented as a powerful tool for observing microstructural sizes $$$^{1,2,3}$$$. We here propose a new contrast based on this sequence as a filter for microstructural sizes (NOGSEc)$$$^4$$$. With this contrast, quantitative information is encoded directly on the MRI signal as a “decay-shift” rather than the usual decay-rate approach. We analytically and experimentally demonstrate the implementation of these microstructure-size filters.Methods
Model presentation: A schematic diagram of the NOGSE sequence is shown in Figure 1. NOGSEc is defined as the amplitude $$$\Delta M$$$ given by the difference between the refocusing period limits when $$$t_C = t_H$$$ (CPMG modulation) and when $$$t_C → 0$$$, $$$t_H → T_E$$$ (a Hahn modulation). The signal is defined by $$\Delta M_{NOGSEc}≈e^{−\gamma^2G^2D_0\tau_c^3(T_E/\tau_c - 3)}(e^{\gamma^2G^2D_0\tau_c^32(N-1)}-1)$$ where $$$\gamma$$$ is the gyromagnetic ratio, $$$G$$$ the gradient strength, $$$D_0$$$ the free diffusion coefficient and $$$\tau_c$$$ the restriction correlation time, $$$T_E$$$ is the total time of the experiment and $$$N$$$ accounts for the total number of refocusing pulses. The NOGSEc $$$\Delta M$$$ has a maximum as a function of the normalized echo-time $$$T_E/\tau_c$$$ as shown in Fig. 2. We exploit this maximum contrast to enhance the relative contribution to the signal from specific restriction lengths $$$l_c$$$ from a given sample containing a size-distribution $$$P(l_c)$$$. NOGSEc for a size-distribution is determined by $$$\Delta M =\int_{l_c} P(l_c) \Delta M(lc) dl_c$$$ where $$$\Delta M(l_c)$$$ is the contrast contribution for a given restriction length $$$l_c$$$. We performed numerical simulations to calculate the range of the parameters that allow us to extract information about the restriction length. Within these limits, we estimated the range of sizes that can be reconstructed within the clinical hardware limitations.Experiments: We performed proof-of-principle experiments on an ex-vivo mouse brain using a 9.4T Bruker Avance III HD WB NMR spectrometer with a $$$1$$$H resonance frequency of $$$\omega_Z = 400.15$$$ MHz. We imaged the Corpus Callosum (CC) since it contains aligned axons and is a paradigmatic model for log-normal size-distributions. We acquired images for multiple values of the gradient strengths ranging from $$$125$$$ to $$$1250$$$ mT/m.
Results and Discussions
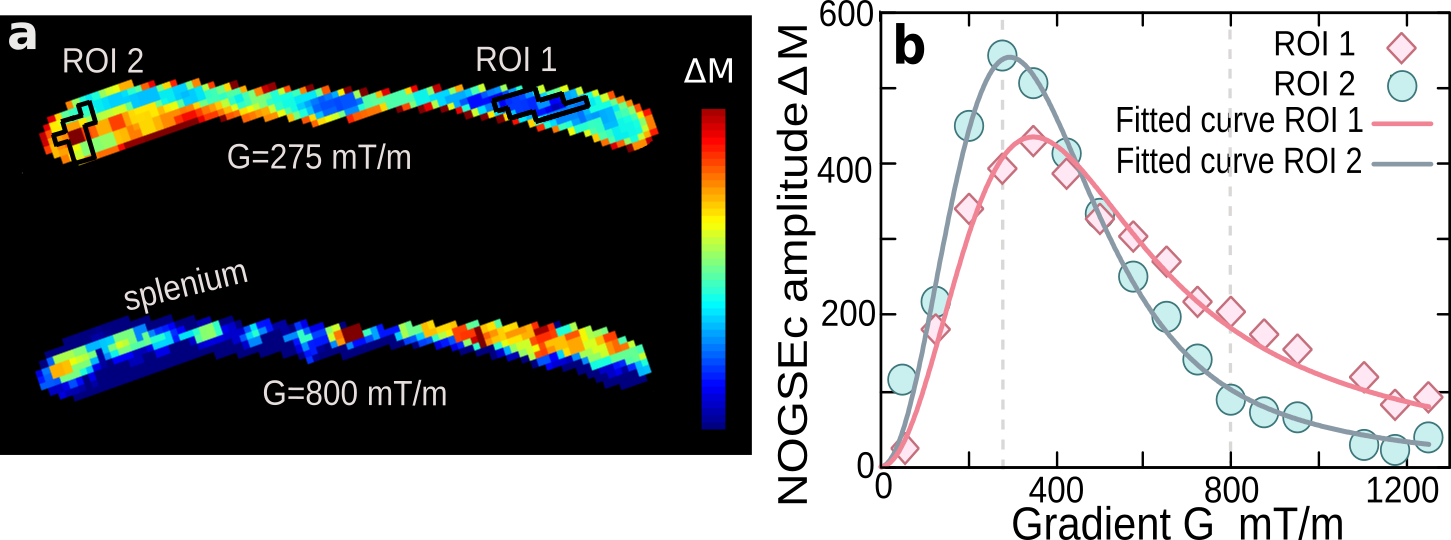
The maximum of $$$\Delta M$$$ can be tuned to highlight a given restriction length $$$l_c$$$ by choosing properly the sequence control parameters $$$G$$$, $$$T_E$$$, $$$N$$$. The filtered size decreases with increasing the $$$G$$$ or $$$T_E$$$, however, this decreases the contrast amplitude. Therefore, the minimum size that can be filtered in practice is limited by the Signal-to-Noise Ratio (SNR) and the maximum achievable gradient strength. This decrease of $$$\Delta M$$$ can be compensated linearly with increasing the number of refocusing periods N as long as the restricted diffusion regime is maintained. We show in Fig. 3 the dynamic-range of restriction lengths that can be scanned assuming a diffusion coefficient typical of white-matter in the mouse-brain, and considering the range of gradient strengths achievable with current technologies.Proof-of-principle experiments were performed in the Carpus Callosum of a ex-vivo mouse brain (Fig. 4). The average $$$\Delta M$$$ as a function of the gradient for selected ROIs is shown with symbols in Fig. 4. As the purpose of this experiment is to demonstrate the selective microstructure-size performance of our method, we assume an established log-normal distribution model according to previous works. We then fit the experimental curves with our theoretical prediction. The color-scaled contrast $$$\Delta M(l_c)$$$ shown in Fig. 4(a) is consistent with the size distributions $$$P(l_c)$$$ reconstructed by fitting the model: ROI 1 has smaller sizes than ROI 2, and therefore ROI 1 has higher $$$\Delta M$$$ for $$$G = 800$$$ mT/m; conversely ROI 2 has higher contrast amplitude for $$$G = 125$$$ mT/m.
Conclusions
We introduced a method for non-invasive quantitative imaging of selective microstructure-sizes based on probing nuclear-spin dephasing induced by molecular diffusion. An important application of this tool is that it can allow scanning a size-distribution without the need of assuming a size-distribution model.Acknowledgements
We acknowledge S. Esposito, V. Piatti, and M. Kortsarz for preparing the ex-vivo mouse brain, and F. Turco for scripting assistance to process the experimental data. We thank L. Frydman and J. Jovicich for fruitful discussions. This work was supported by CNEA, ANPCyT-FONCyT PICT-2017-3447, PICT-2017-3699, PICT-2018-04333, PIP-CONICET (11220170100486CO), UNCUYO SIIP Tipo I 2019-C028, Instituto Balseiro. A.Z. and G.A.A. are members of the Research Career of CONICET. M.C. and P.J. acknowledge support from the Instituto Balseiro's fellowships.References
1. N. Shemesh, G. A. Álvarez and L. Frydman, J. Magn. Reson. 237, 49 (2013).
2. N. Shemesh, G. A. Álvarez and L. Frydman, PLoS One 10 ,e0133201 (2015).
3. G. A. Álvarez, N. Shemesh and L. Frydman, Phys. Rev. Lett. 111, 080404 (2013).
4. M. Capiglioni, A. Zwick, P. Jimenez, G. A. Alvarez, ArXiv:2006.02035 [physics.med-ph] (2020)Figures