2032
b-Value Dependency of Diffusion Parameters Derived from the DTI and DKI Models in Postmortem Human Brain Hemispheres1Center for Brain Imaging Science and Technology, College of Biomedical Engineering and Instrumental, Zhejiang University, Hangzhou, China, 2Wellcome Centre for Integrative Neuroimaging, FMRIB, Nuffield Department of Clinical Neurosciences, University of Oxford, London, United Kingdom, 3National Human Brain Bank for Health and Disease, School of Brain Science and Brain Medicine, Zhejiang University, Hangzhou, China, 4Department of Imaging Sciences, University of Rochester, Rochester, NY, United States
Synopsis
Diffusion weighted images of formalin-fixed human brain hemispheres were used to study b-value dependence of diffusion parameters with the diffusion tensor and diffusion kurtosis model. Consistent decreases of FA with increasing b-values were observed in all hemispheres. Meanwhile, the mean kurtosis was found to increase with the discrepancy of FA between high and low b-value datasets. These results indicate that the b-value dependence of FA could be explained by non-gaussian diffusion effects consistent with tissue microstructure.
Introduction
In diffusion magnetic resonance imaging (dMRI), it has been previously reported that higher b-values are associated with a decreased fractional anisotropy (FA).1-6 This association has been previously attributed to either (1) contributions from noise to the measured signal1-4 or (2) non-gaussian diffusion effects driven by tissue microstructure.5Diffusion weighted imaging (DWI) of post-mortem brains provides the opportunity to acquire diffusion images of sufficient SNR through long scan times, whilst inherently eliminating motion artefacts and potential incoherent perfusion confounds.7 In this study, DWI images acquired in fixed human brain hemispheres were investigated, to explore the intrinsic cause of the FA dependency on b-value.
Methods
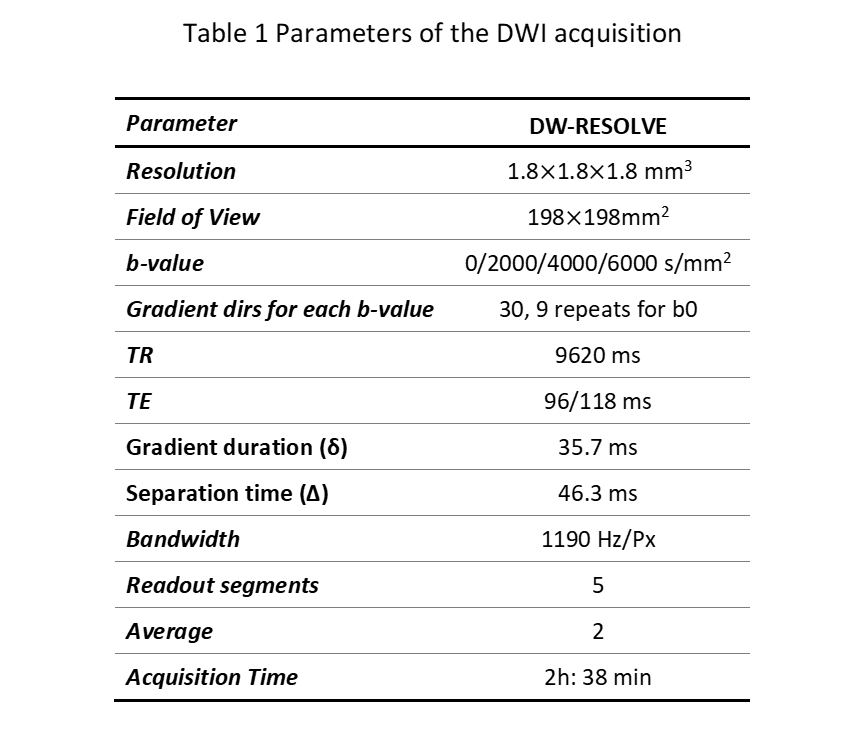
This study was conducted with the prior approval of the ethics committee of Zhejiang University School of Medicine. Four left hemispheres of formalin-fixed human brain were obtained from the National Human Brain Bank for Health and Disease. Each brain hemisphere was immersed in 10% formalin for four weeks. After fixation, the samples were rinsed in running tap water for 24 hours and placed in a Fomblin (Fomblin, YL VAC25/6, Solvay) container. Air bubbles were removed from the containers by vacuuming for 24 hours.MRI acquisition was performed on a MAGNETOM Prisma 3T scanner using a 64-channel head-neck coil (Siemens Healthcare, Erlangen, Germany). For each hemisphere, diffusion images were obtained with a Readout-Segmented Echo-Planar Imaging (RS-EPI) sequence.8 At each b value (2000, 4000, 6000 s/mm2) 30 diffusion directions and 3 non-diffusion weighted datasets were acquired. All images had an isotropic resolution of 1.8 mm. Other parameters are listed in Table 1.
The DWI datasets were first denoised by dwidenoise implemented in MRtrix3 (https://github.com/MRtrix3/MRtrix3). Voxel-wise DTI estimates were obtained using tools provided with the FMRIB Software Library (www.fmrib.ox.ac.uk/fsl). After image alignment and eddy current correction with eddy_correct, calculation of diffusion tensor and scalar measures was performed using dtifit. A numerical simulation based on a multi-tensor model,9 with varied levels of signal-to-noise ratio (SNR) was designed to investigate the noise effect. We only included a single fiber in a voxel, with SNR levels set to [5, 10, 20, 30, 40, 50]. The diffusion coefficients were set to [0.0002, 0.0001, 0.0001] (mm2/s), in close approximation to the diffusivities in the acquired data. All the simulated diffusion signals at different b values and SNR levels were fitted with a tensor model to estimate the diffusion parameters.
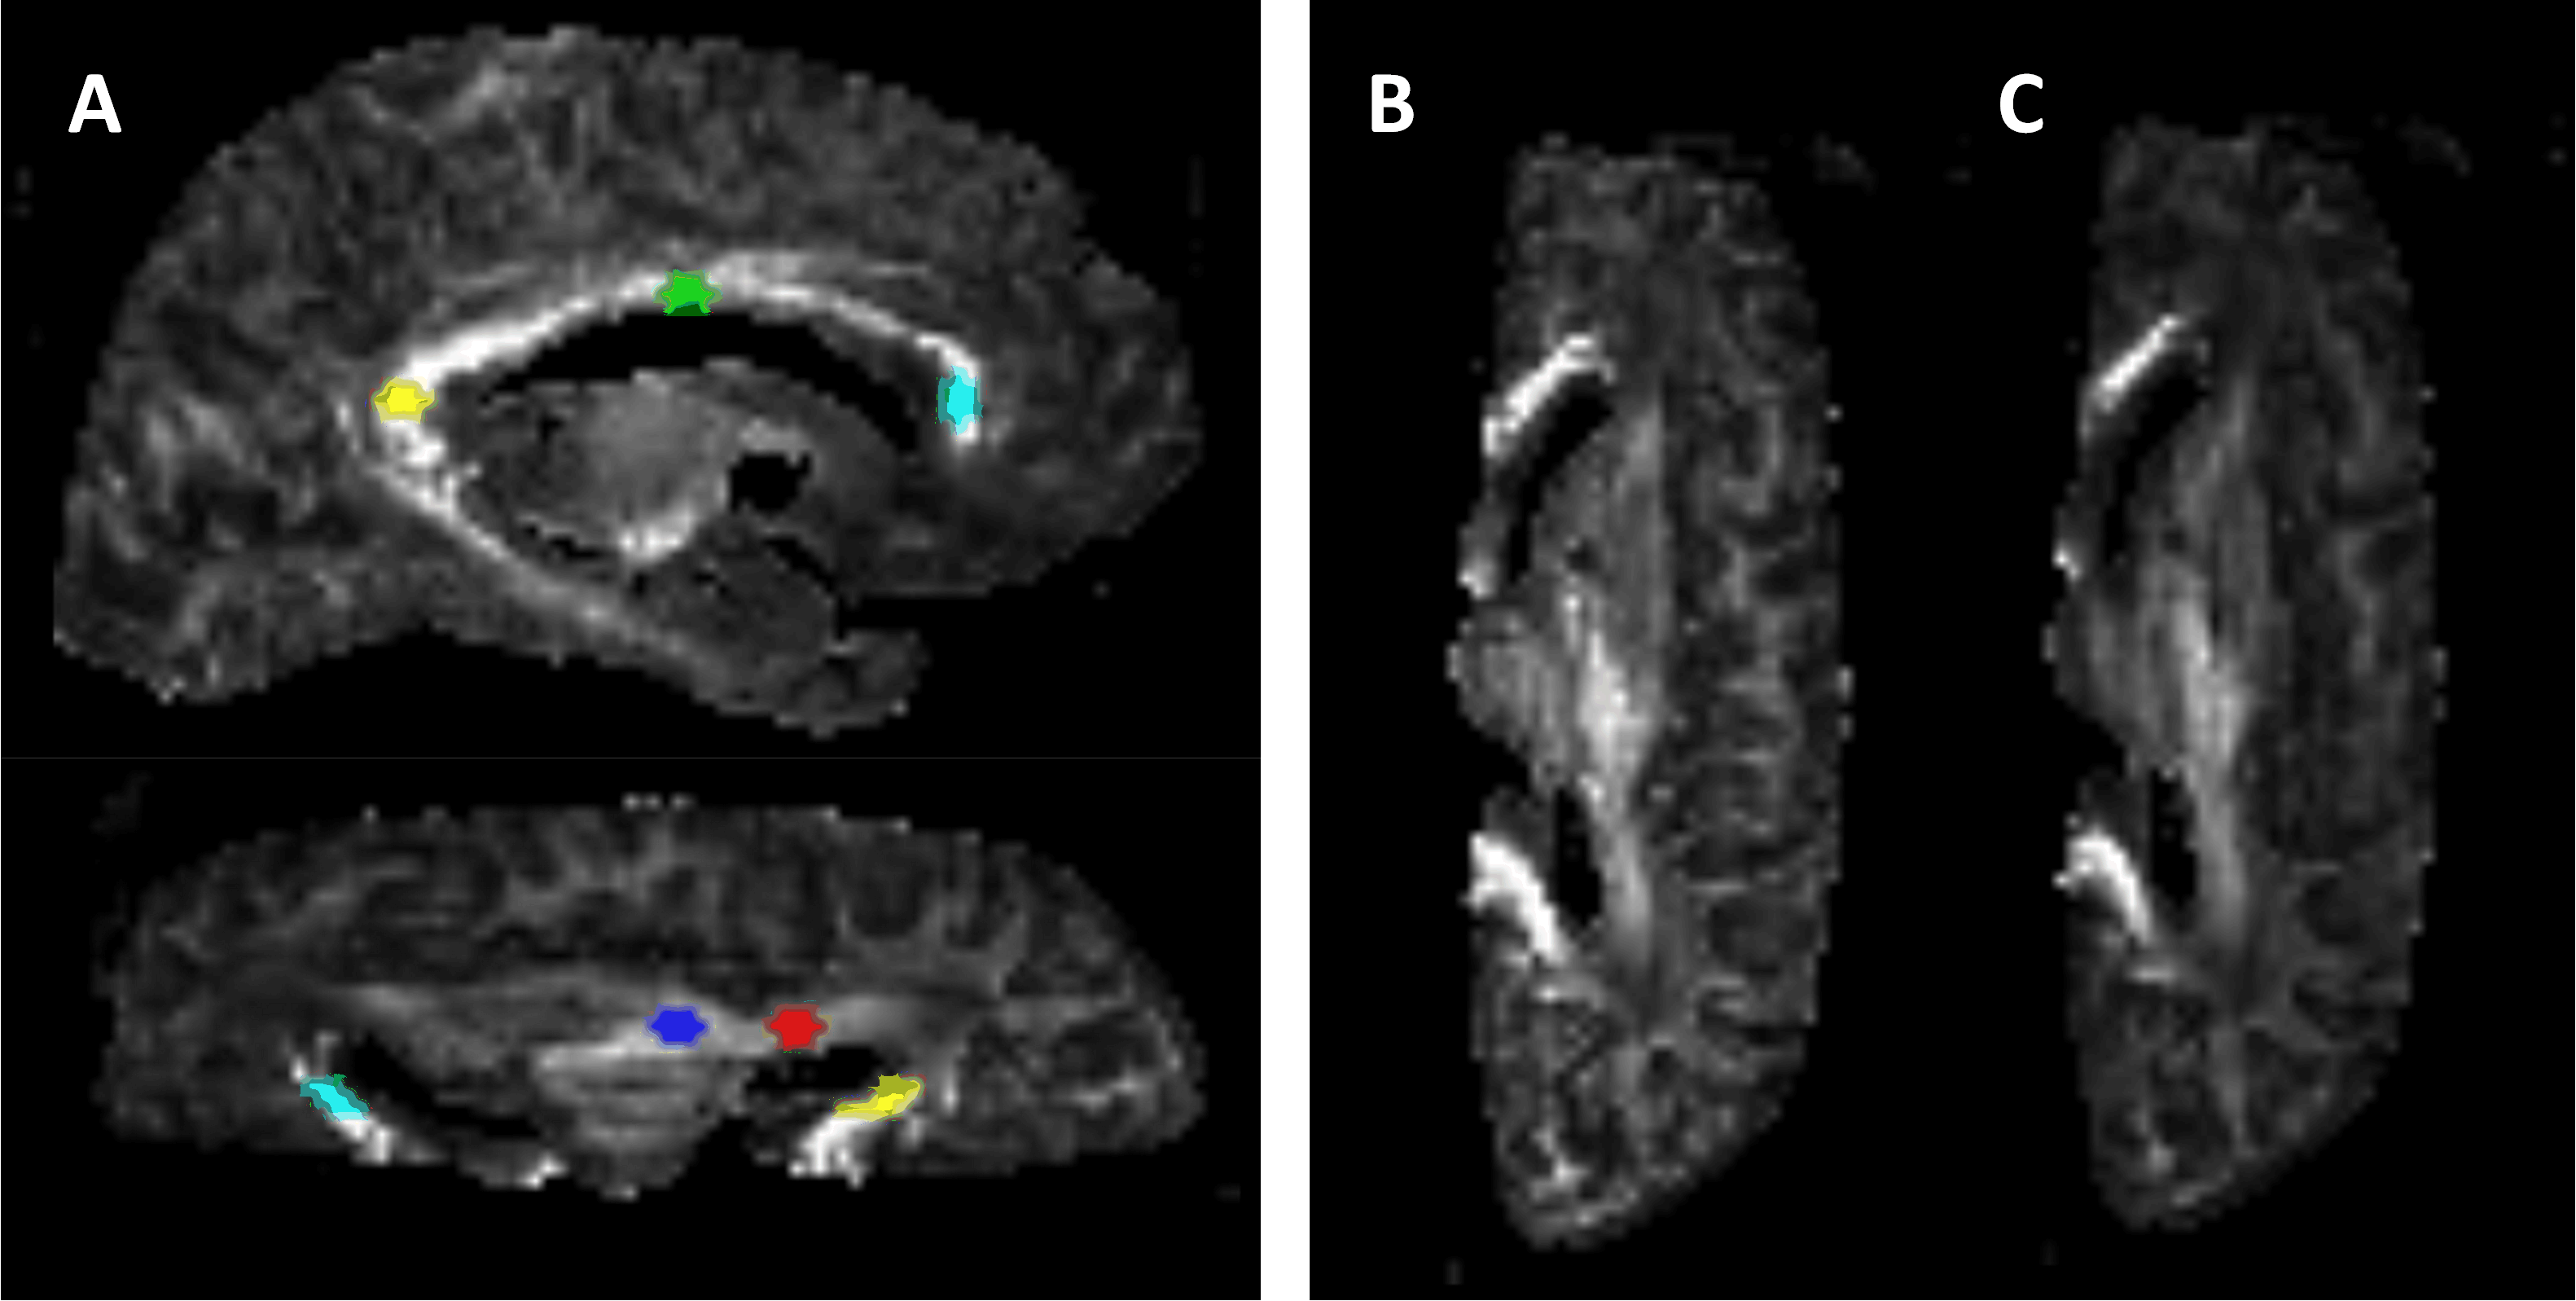
In order to further verify the influence of non-Gaussian diffusion, mean kurtosis (MK) was computed from the 0-, 4000-, and 6000-s/mm2 shells of experimental data by the proposed algorithm implemented with the use of the open-source software DESIGNER (https://github.com/NYU-DiffusionMRI/DESIGNER/), with constraints of Dapp > 0 and Kapp > 0 employed. The b-shell of 2000 s/mm2 was excluded due to its lack of diffusion weighted contrast. Five representative regions of interest (ROI) were manually drawn in regions (each contains 50-70 voxels) containing no crossing white matter fibers (anterior limb of internal capsule, ALIC; posterior limb of internal capsule, PLIC; genu-, body-, splenium-corpus callosum, GCC; BCC; SCC) (Figure 1).
Results & Discussion
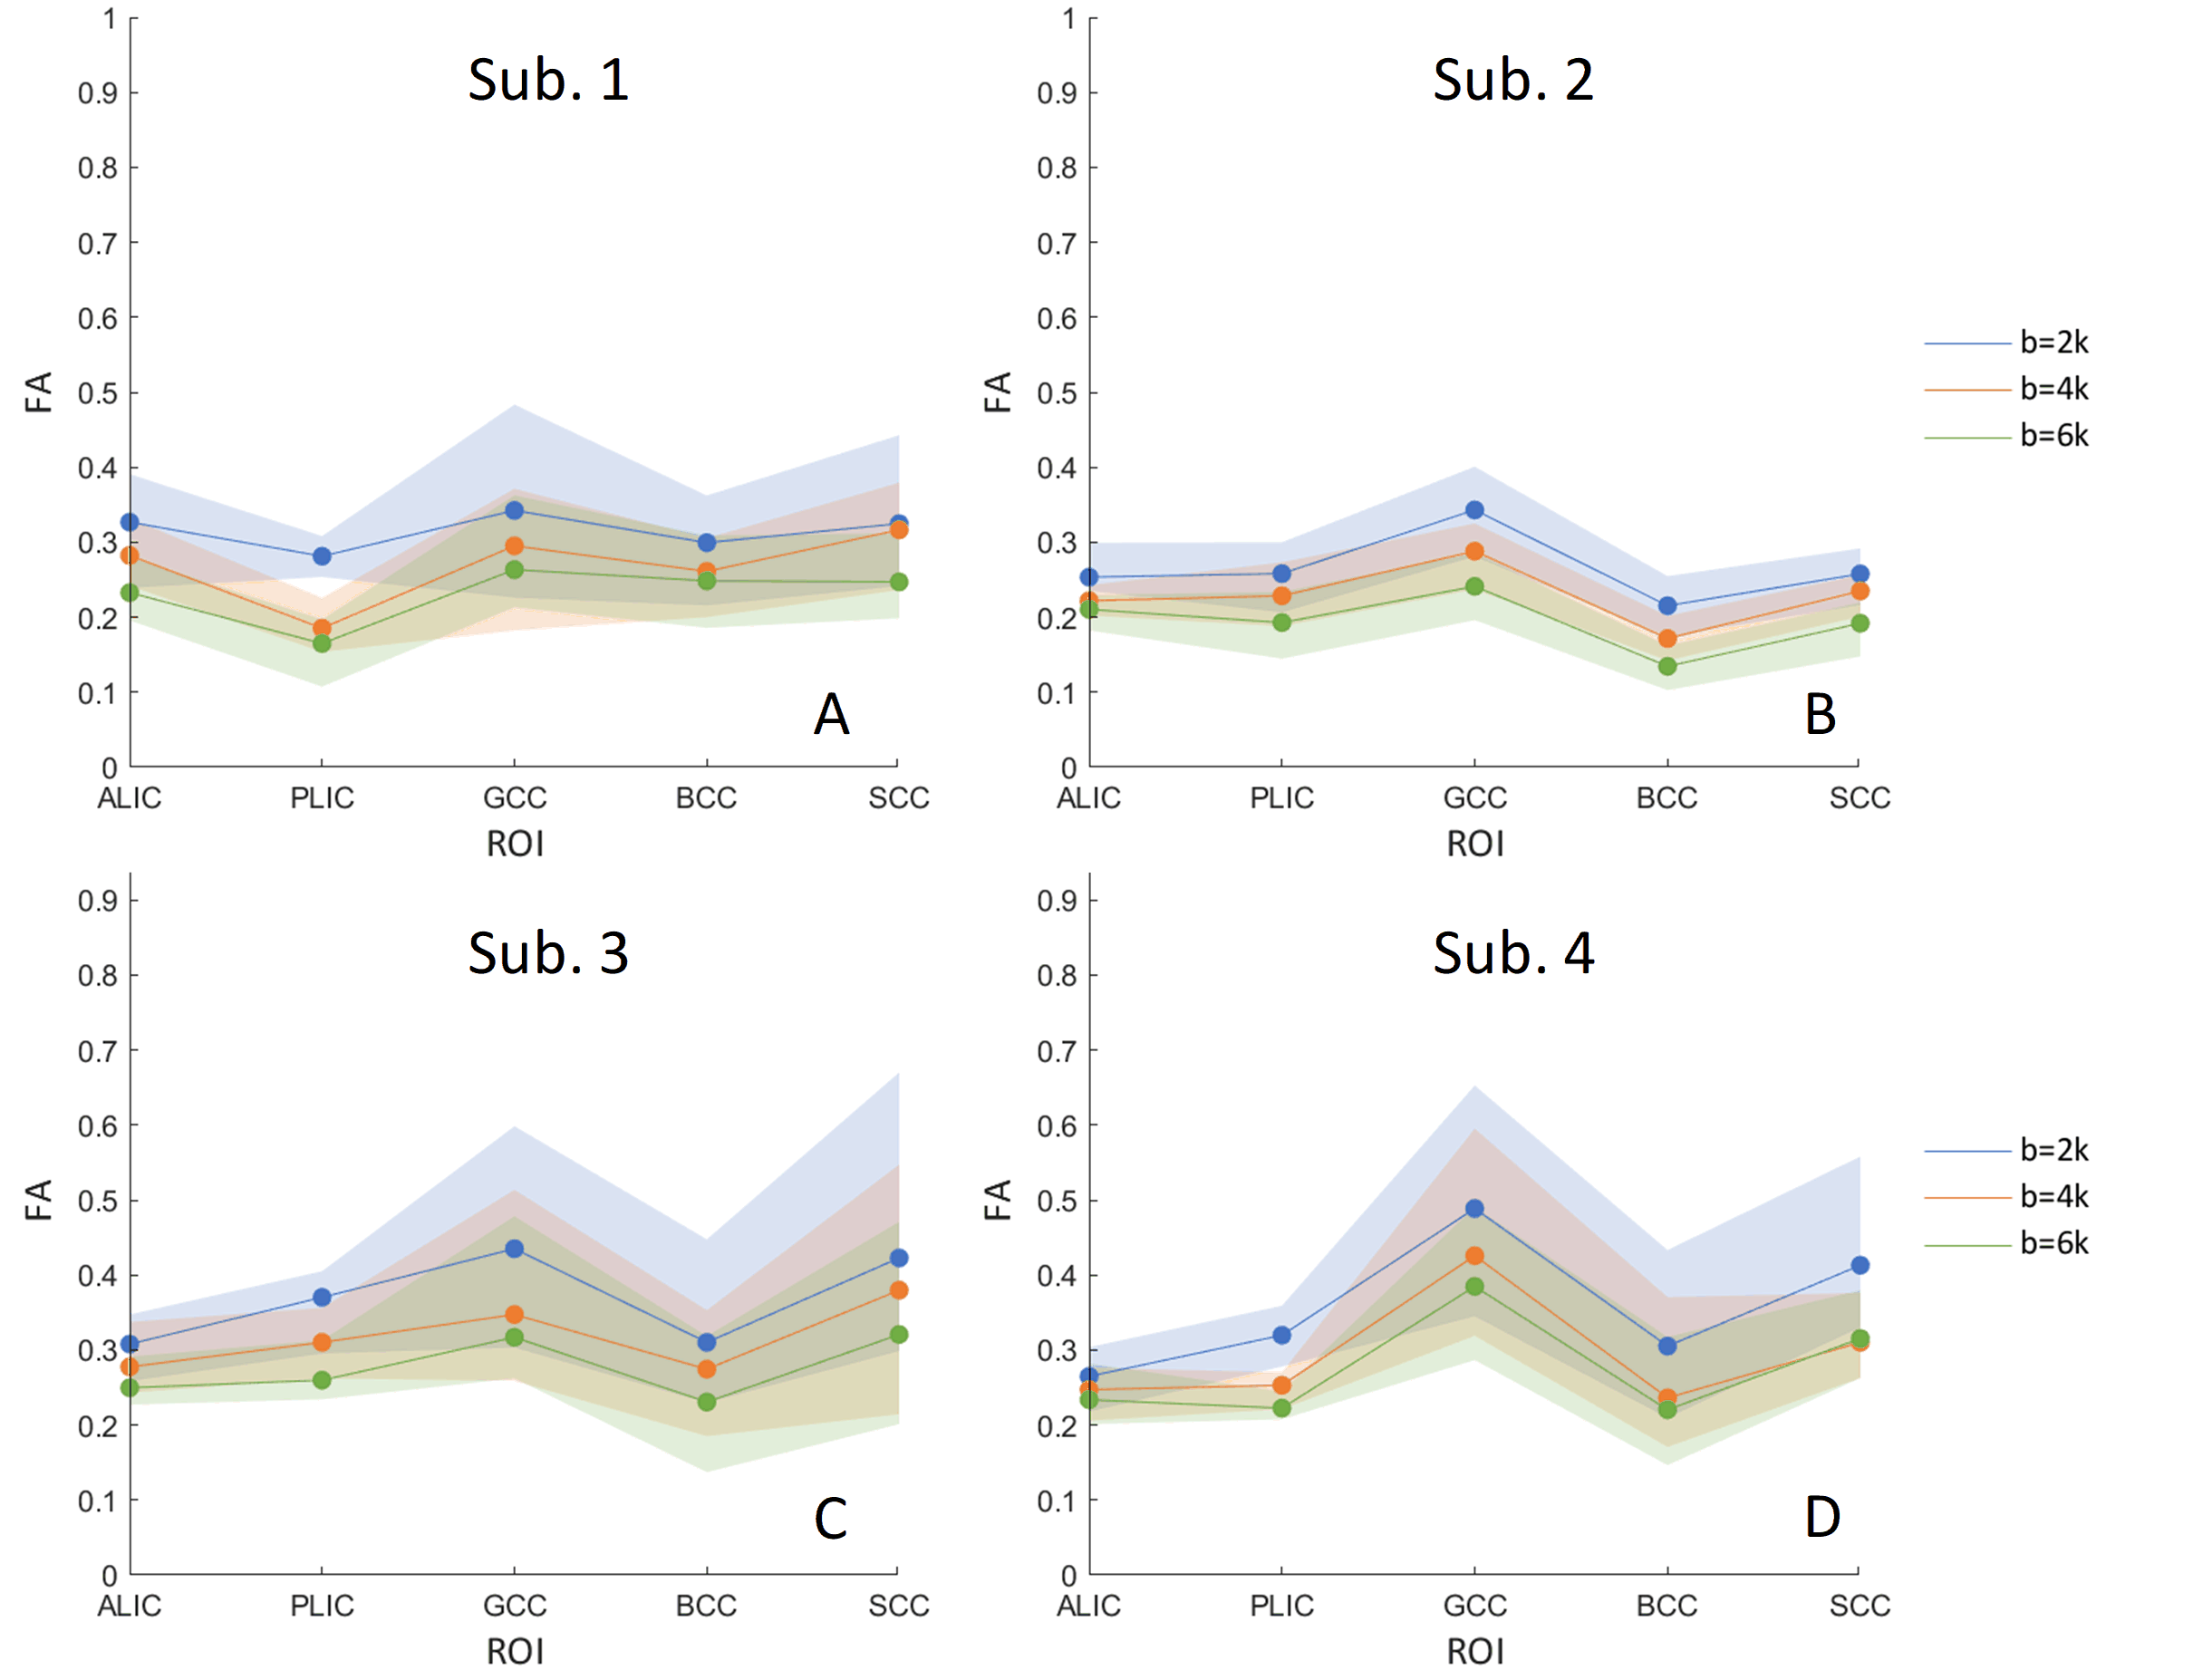
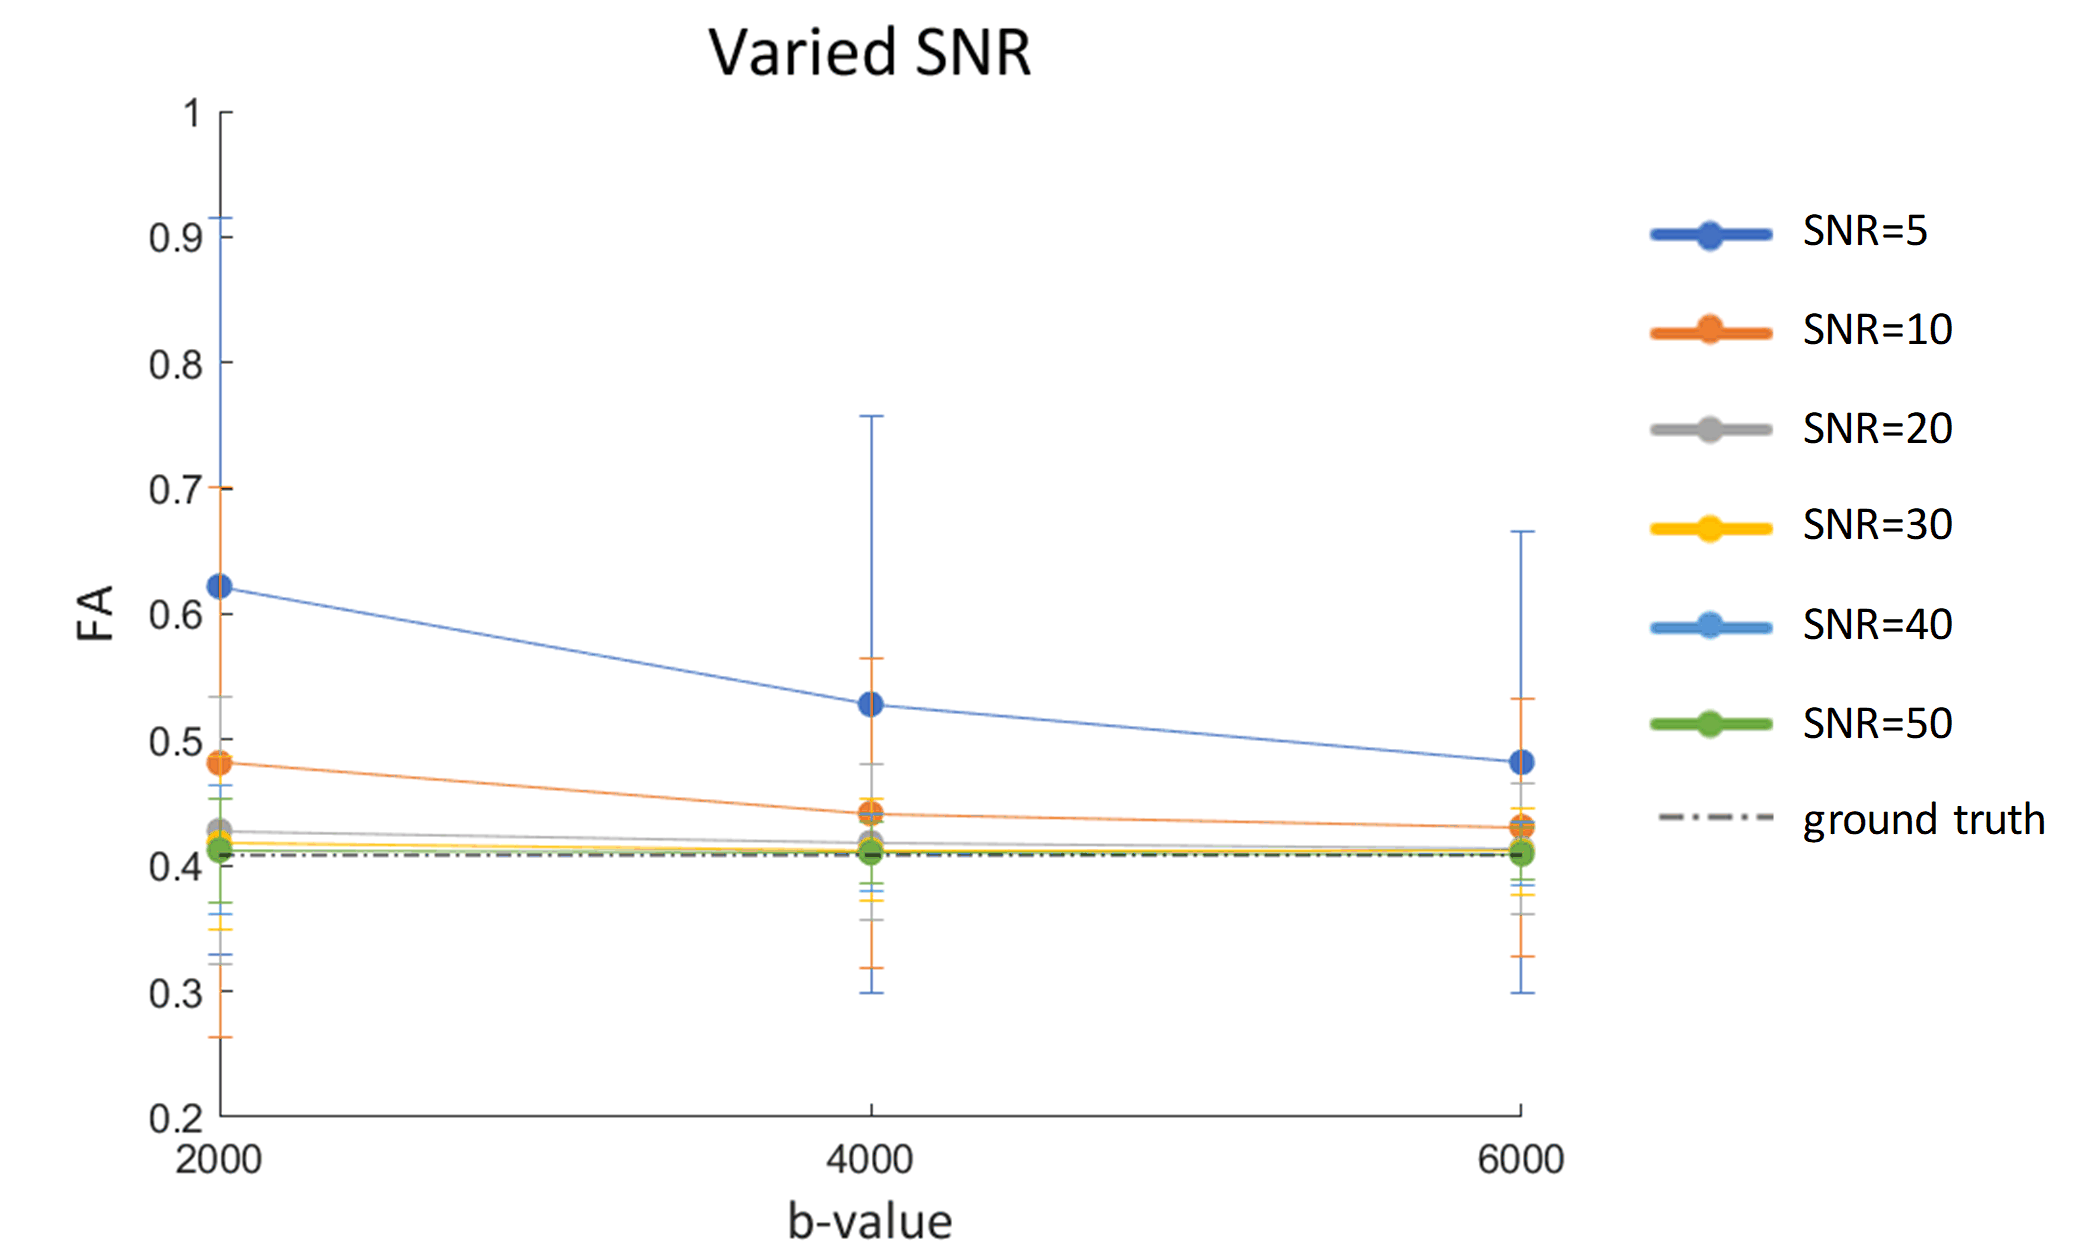
Figure 2 displays the FA profiles at three b-values for the chosen ROIs in 4 subjects. The variation across regions are similar at each b-value, consistent with prior reports in which the FA values decrease as b-value increases.6 Across b-values the profiles have a similar shape but different absolute values. The observed variation in FA across sub-regions of the corpus callosum (lower FA in BCC) is also consistent with a previous study.10 The estimated SNR, defined as the ratio of the median voxel value of the DWI image to the noise level, was 18.2, 23.1, 23.0, 17.7 (the minimal SNR in the selected five ROIs for the four subjects).The simulation results in Figure 3 indicate that the FA overestimation caused by noise becomes negligible when the SNR is greater than 20 even at the much lower diffusivity of fixed post mortem tissue. This suggests that the impact of noise in data is unlikely to induce alterations in FA when the SNR is sufficiently high. As our data has an SNR greater than 20 (Individual ROIs with a SNR below 20 will be excluded from the analysis, Figure 4), this suggests that our data quality is sufficient to explore factors other than the contribution from noise.
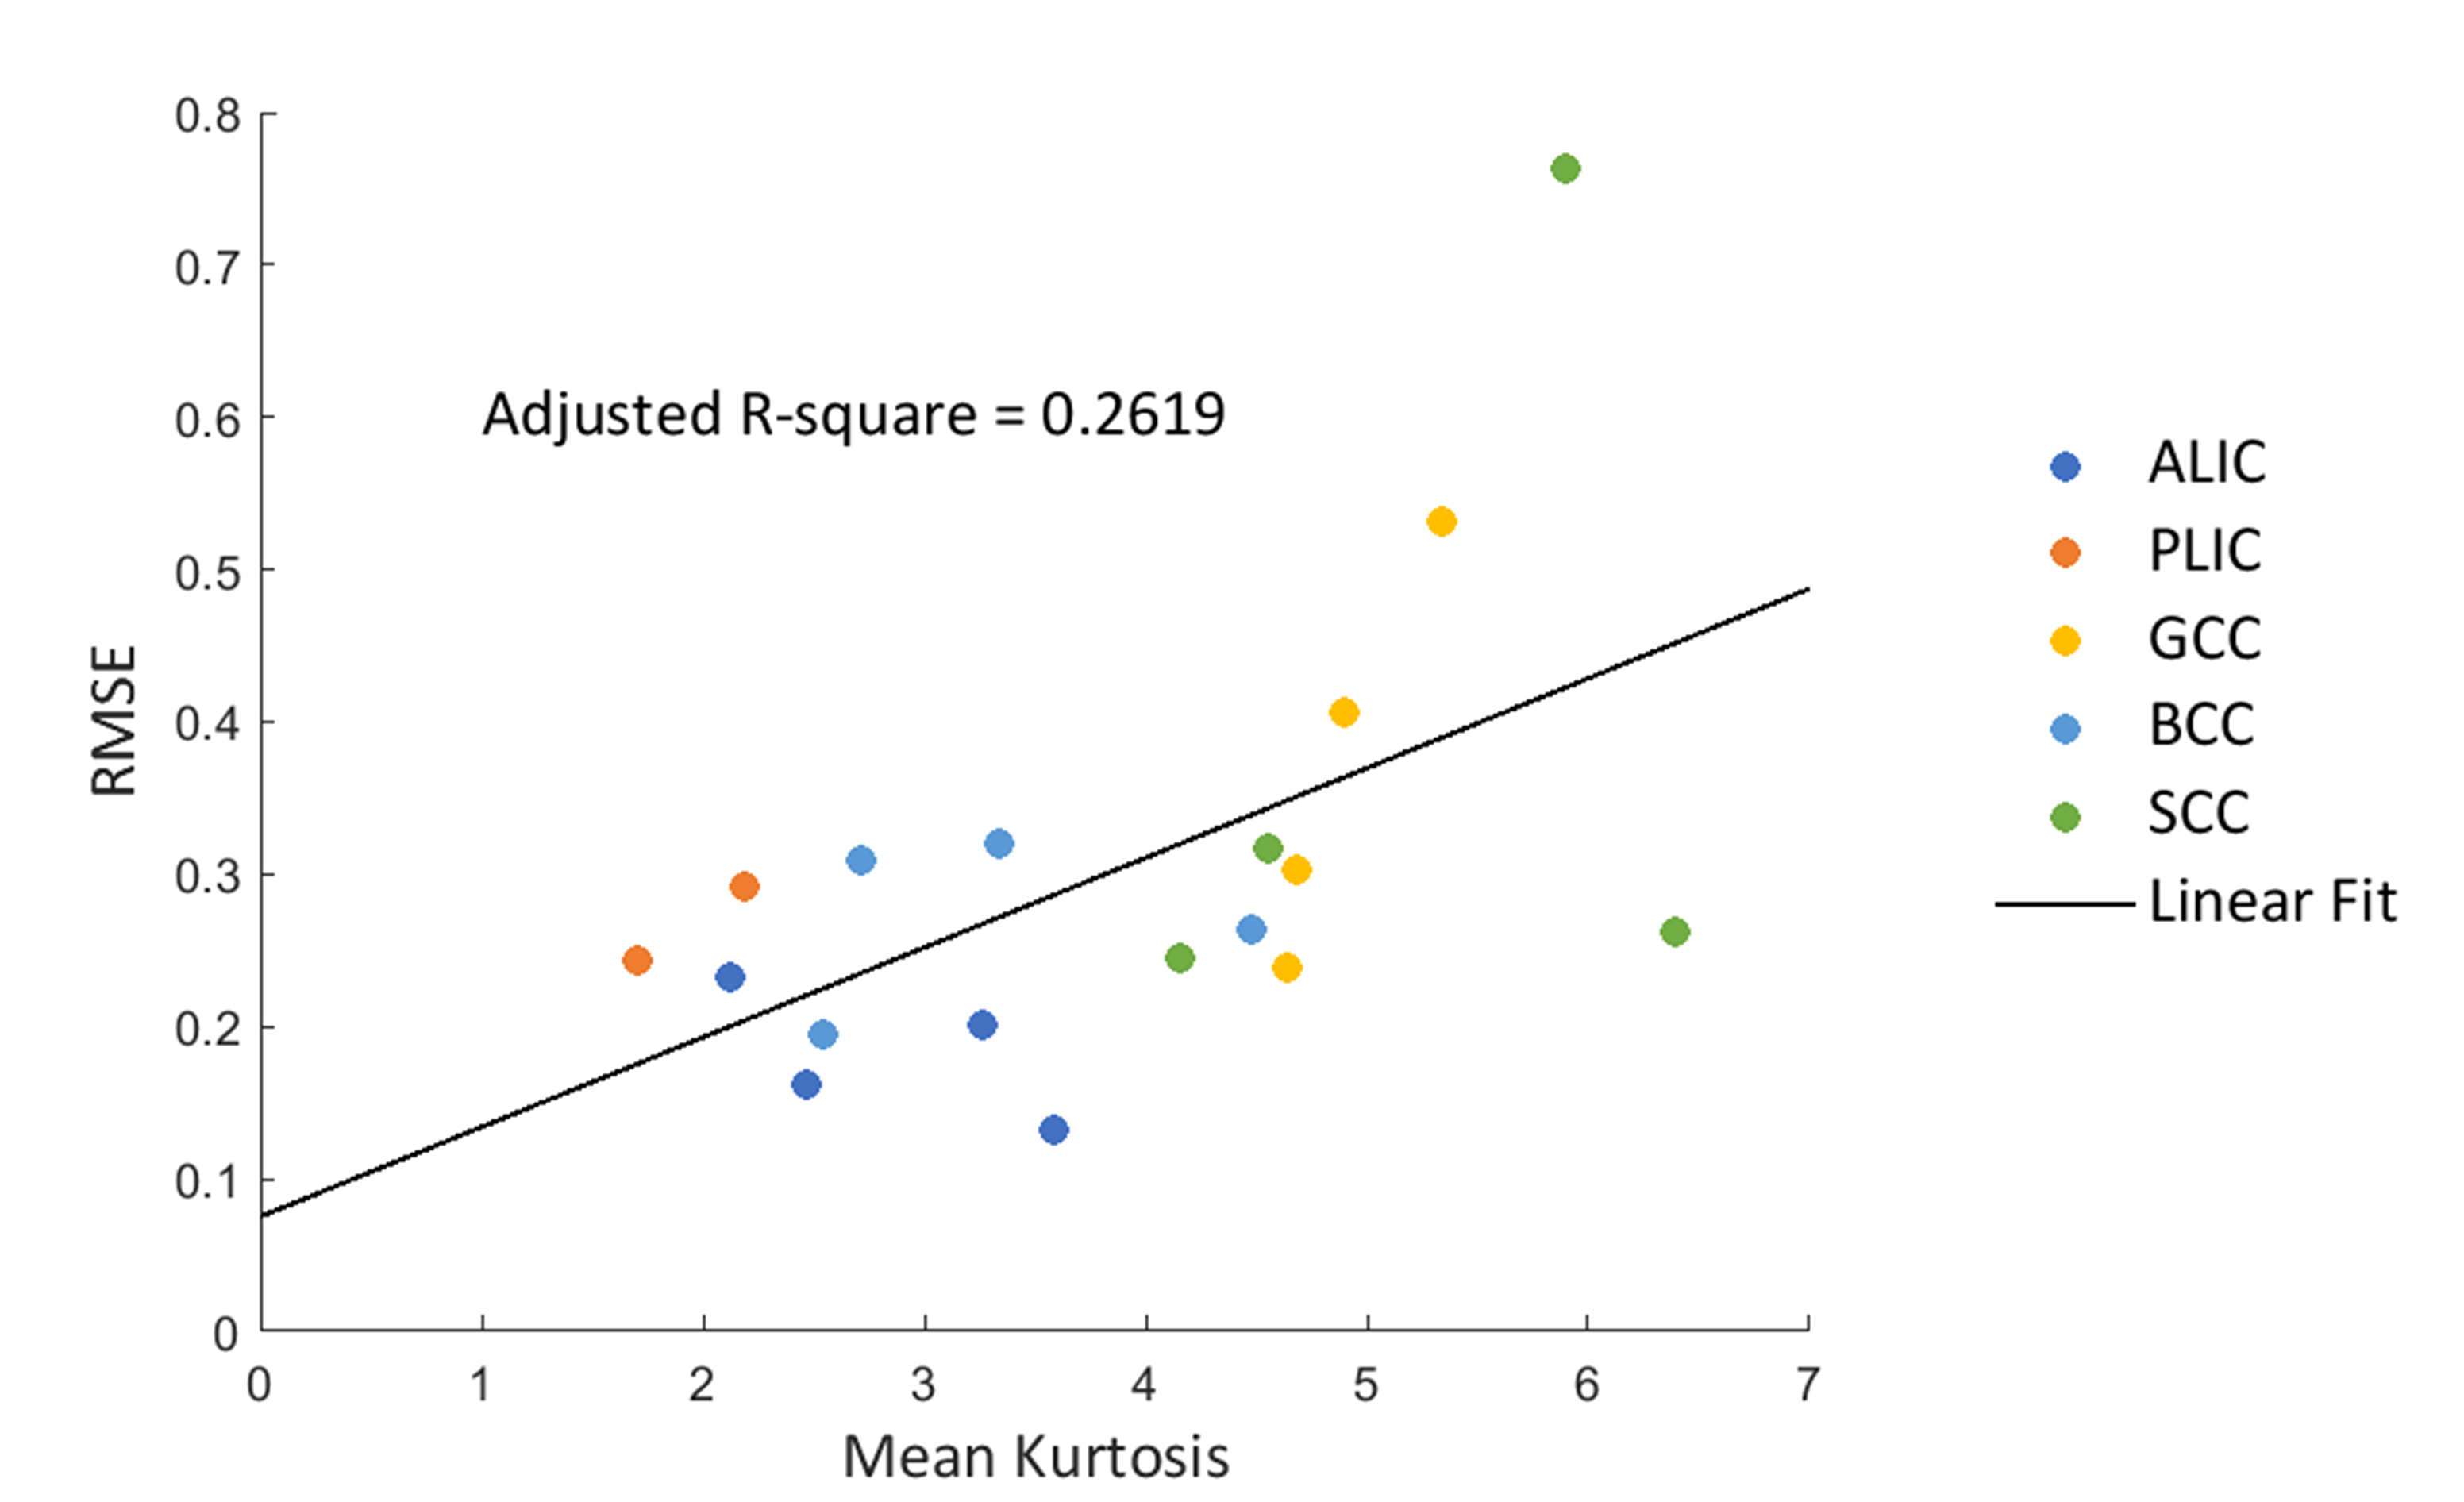
For quantitative evaluation, the root-mean-squared errors (RMSEs) estimated from the difference between FA values derived from high (b=6000 s/mm2) and low (b=4000 s/mm2) b-value datasets were computed. The number of voxels included in the quantitative calculation in each ROI was fixed at 50. Figure 3 plots linear correlations between RMSE and MK in the five ROIs of all subjects. RMSE and MK shows positive correlation (adjusted R2=0.2619), indicating that the b-value dependency of FA could be due to a non-Gaussian diffusion effect.
Conclusion
In this work, the dependence of FA on b-values was investigated in fixed human brain hemispheres. Based DTI and DKI model fitting on the simulation signals and the acquired data, we concluded that there a contribution from non-gaussian diffusion to the b-value dependence. This may reflect the contribution of microstructure in white matter. Future work will examine this relationship further using comparisons to histology acquired within these hemispheres.Acknowledgements
No acknowledgement found.References
[1] Farrell JA, Landman BA, Jones CK, et al. Effects of signal-to-noise ratio on the accuracy and reproducibility of diffusion tensor imaging-derived fractional anisotropy, mean diffusivity, and principal eigenvector measurements at 1.5T. J. Magn. Reson. Imaging. 2007;26: 756–767.
[2] Jones DK, Basser PJ. “Squashing peanuts and smashing pumpkins”: how noise distorts diffusion-weighted MR data. Magn Reson Med. 2004;52: 979–993.
[3] Landman BA, Farrell JA, Jones, CK, et al. Effects of diffusion weighting schemes on the reproducibility of DTI-derived fractional anisotropy, mean diffusivity, and principal eigenvector measurements at 1.5T. Neuroimage. 2007;36: 1123–1138.
[4] Mukherjee P, Chung SW, Berman JI, et al. Diffusion tensor MR imaging and fiber tractography: technical considerations. AJNR Am. J. Neuroradiol. 2008;29: 843–852.
[5] Veraart J, Poot DH, Hecke W Van, et al. More Accurate Estimation of Diffusion Tensor Parameters Using Diffusion Kurtosis Imaging. 2011;145: 138–145.
[6] G Lerma-Usabiaga, Mukherjee P, Ren Z, et al. Replication and generalization in applied neuroimaging. NeuroImage. 2019;202: 116048.
[7] Paschoal AM, Leoni RF, Dos Santos AC, et al. Intravoxel incoherent motion MRI in neurological and cerebrovascular diseases. Neuroimage Clin. 2018;20: 705-714.
[8] Porter DA, Heidemann RM. High resolution diffusion-weighted imaging using readout-segmented echo-planar imaging, parallel imaging and a two-dimensional navigator-based reacquisition. Magn. Reson. Med. 2009;62: 468-475.
[9] Tuch. Q-ball imaging. Magn Reson Med. 2004;52: 1358–1372.
[10] Kim EY, Park HJ, Kim DH, et al. Measuring Fractional Anisotropy of the Corpus Callosum Using Diffusion Tensor Imaging: Mid-Sagittal versus Axial Imaging Planes. Korean J Radiol. 2008;9(5): 391-395.
Figures