2031
Is calibration necessary to relate NODDI, NODDIDTI, WMTI to axonal volume fraction? - A joint ex vivo MRI and histology study.1Department of Systems Neurosciences, University Medical Center Hamburg-Eppendorf, Hamburg, Germany, 2Wellcome Centre for Human Neuroimaging, UCL Queen Square Institute of Neurology, University College London, London, United Kingdom, 3Department of Biomedical Engineering, Vanderbilt University, Nashville, TN, United States, 4Institute of Imaging Science, Vanderbilt University Medical Center, Nashville, TN, United States, 5Department of Radiology and Radiological Sciences, Vanderbilt University Medical Center, Nashville, TN, United States, 6Department of Electrical Engineering, Vanderbilt University, Nashville, TN, United States, 7Department of Neurophysics, Max Planck Institute for Human Cognitive and Brain Sciences, Leipzig, Germany
Synopsis
It is unknown whether the accuracy of DWI-model based estimates of the axonal water fraction could be enhanced by additional calibrations. In this study we compared three DWI-models (WMTI, NODDI, NODDIDTI) using histology data as gold standard in ex vivo mouse models with a broad dynamic range of axonal metrics. We found that all DWI-models improved with additional calibration. Models with fixed diffusivities benefited efficiently from an additional scaling, while the WMTI model was stronger affected by an additional offset. Furthermore, without any additional calibration, the axonal compartment biomarker from NODDIDTI could explain the data better than WMTI or NODDI.
Introduction
Accurate estimation of the axonal volume fraction ($$$AVF$$$) of white matter (WM) is of great interest since it is required, e.g. for the assessment of the g-ratio, which in turn is highly indicative of neuronal conduction velocity 1,2,3. Typically, this is achieved by combining biomarkers for myelin and the axonal water fraction. Although, it is known that all markers used to date for g-ratio mapping have limitations 3. Yet, the question about whether calibration can improve their accuracy has remained unanswered. In this study we tested whether calibration improves the accuracy of diffusion-weighted-imaging (DWI) -based biomarkers for $$$AVF$$$. Based on a particularly rich dataset of ex vivo mice spanning hypo- and hyper- axonal myelination 4,5, we validated the $$$AVF$$$ estimated from three DWI-models, white matter tract integrity (WMTI) 6, neurite orientation dispersion and density imaging (NODDI) 7, and (NODDIDTI) 8, using electron microscopy (EM) histology as the gold standard.Methods
TheoryThe theoretical background is summarised in fig. 1 and fig. 2. We validated the performance of the DWI-models employing a linear calibration $$$AWF$$$-model:
$$ AWF = sA_{\textrm{DWI}} + o\qquad (2)$$
with DWI: WMTI, NODDI, or NODDIDTI. In each DWI-model we validated four cases: (equal) $$$AWF=A$$$DWI, (offset) $$$ AWF=A$$$DWI$$$ + o $$$, (scaling) $$$AWF=sA$$$DWI, and the full linear model (linear).
Dataset
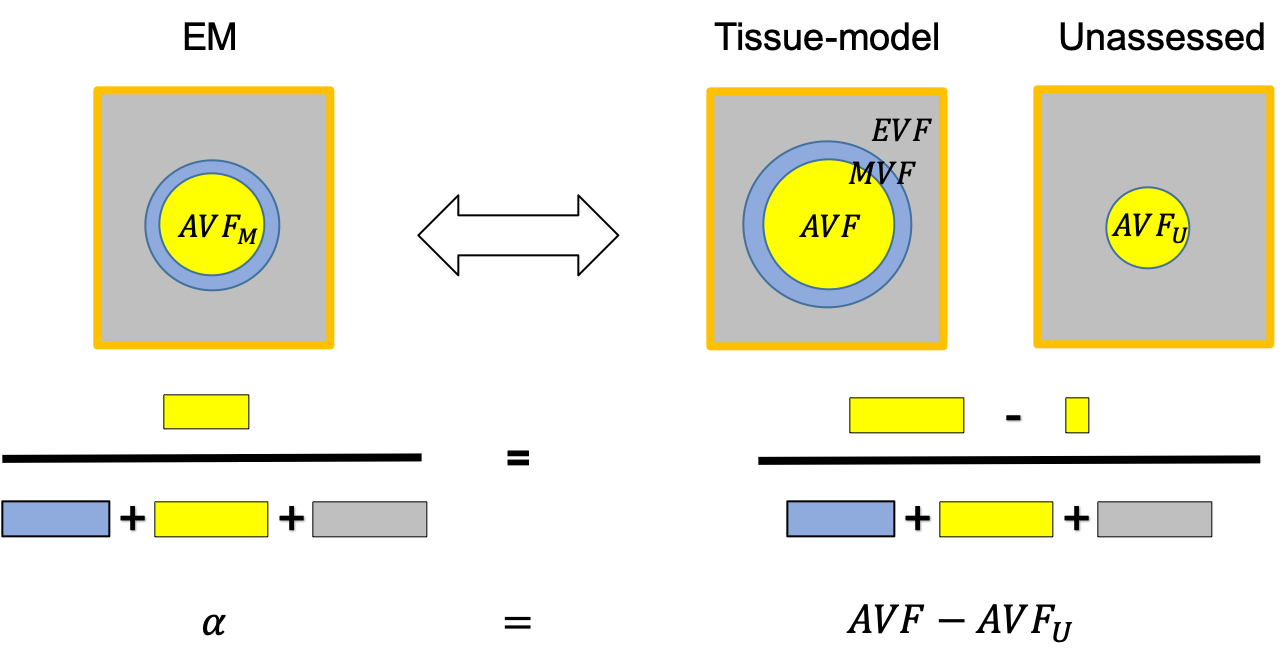
The used dataset is described in 4,5. The data comprised DWI and EM-histology data in an ex vivo cohort of 15 mice. Six of which were healthy controls and nine were genetically modified mouse models: three Pten CKO (hypermyelinated), three Rictor CKO (hypomyelinated) and three Tsc2 CKO (severely hypomyelinated). DWI metrics $$$A$$$WMTI, $$$A$$$NODDI, $$$A$$$NODDIDTI and EM histology metrics $$$\alpha$$$ and $$$\mu$$$ were available in four regions-of-interest (ROIs), three in the corpus callosum (genu, mid-body, splenium) and one ROI in the fornix. In total, this resulted in 60 data points (15 mice x 4 ROIs) 4,5. $$$A$$$NODDIDTI was generated based on 8 using the FA and MD parameters published in 4 and the diffusivities used for NODDI 5. Note that NODDIDTI rejects data points that do not fulfil its model-conditions.
Optimisation
The calibration constants from eq. (2), $$$s$$$ and $$$o$$$, were estimated by minimising the residual-sum-of-squares ($$$RSS$$$) between histological $$$\mathbf{\alpha}$$$ and DWI-based $$$\mathbf{f}_A$$$ (eq. (1) in fig. 1):
$$RSS = (\mathbf{\alpha} - \mathbf{f}_A)^T \cdot (\mathbf{\alpha} - \mathbf{f}_A), \qquad(3)$$
where the bold-faced quantities represent vectors including all available numerical values assembled into a 60x1 (54x1 in case of NODDIDTI) column vector, respectively.
Model comparison
The Akaike information criterion ($$$AIC$$$) was used for model comparison 9:
$$AIC = 2k + n\textrm{ln}(RSS),\qquad (4)$$
where $$$k$$$ is the number of parameters (here 0, 1, or 2 depending on the -model equal, offset and scaling, or linear) and $$$n$$$ is the number of evaluated data points. The $$$AIC$$$ measures a model’s capability to explain given data, while penalising overfitting. A lower $$$AIC$$$ indicates less information loss, meaning that the model with the lowest $$$AIC$$$ best explains the data. For assessing the variation in slope $$$s$$$ and offset $$$o$$$, we performed a leave-one-out analysis by successively leaving the data from one mouse out until each was left out once. All parameter estimations were performed using Matlab 2020a (®Mathworks, CA, USA).
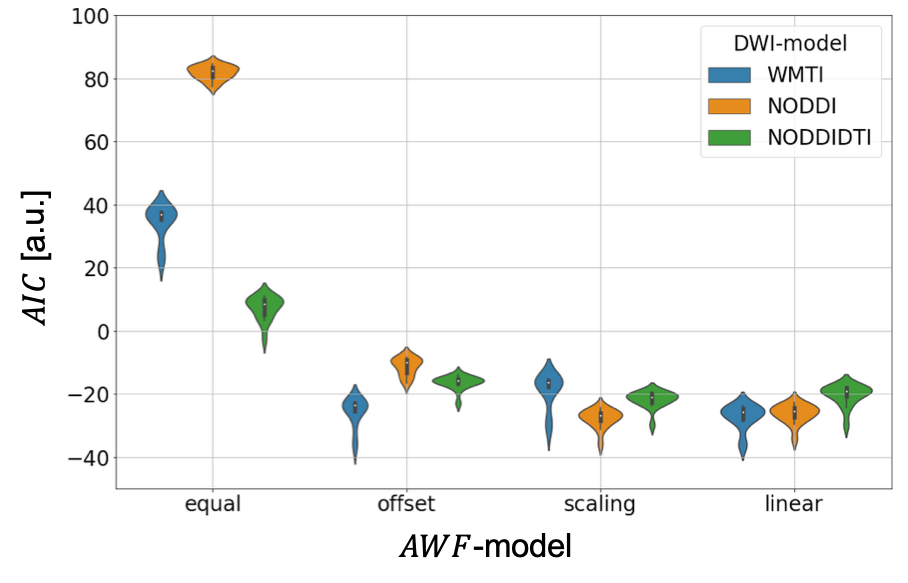
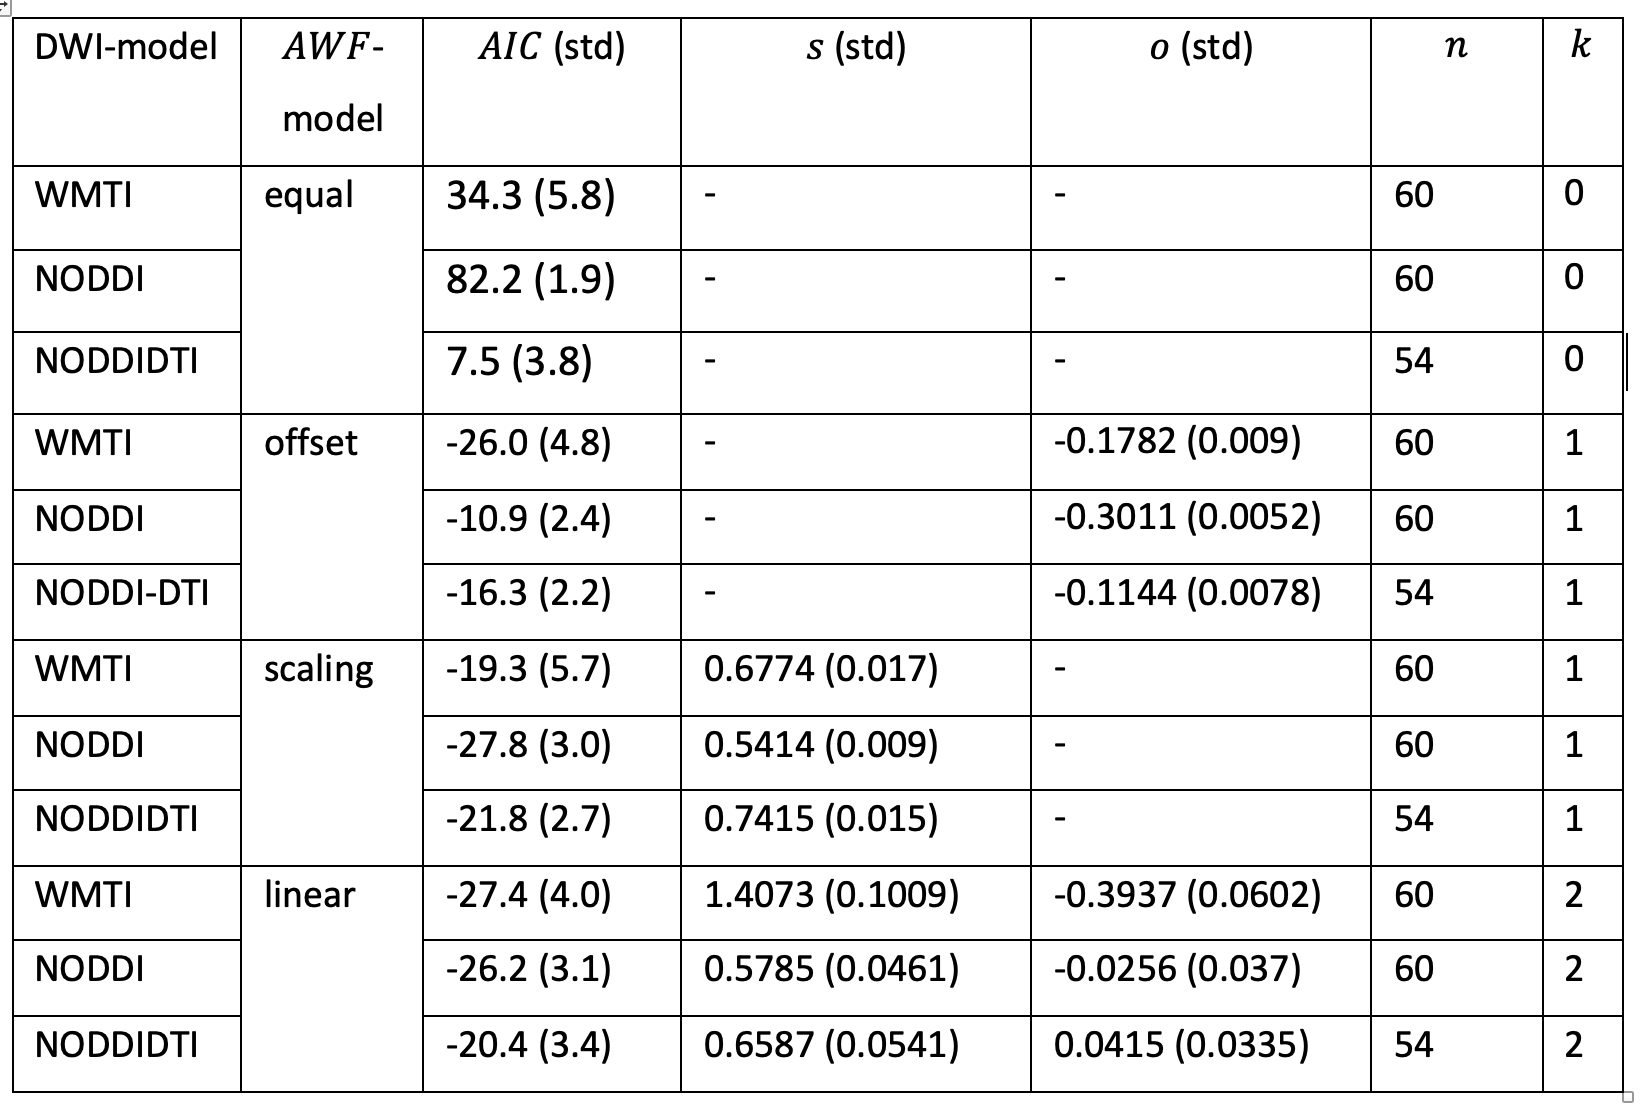
Results
The results are summarised in fig. 3 and table 1.Discussion
We tested how well three well-known DWI-models explained the gold-standard axonal volume fraction from histology when allowing for a linear relationship (calibration) between the DWI-based biomarkers and the histological axonal water fraction $$$AWF=\alpha/(1-\mu)$$$. For the interpretation of the results it is important to note that the histological gold standard contained only the fraction of myelinated axons ($$$\alpha$$$). It is believed that DWI-based biomarkers $$$A$$$DWI are sensitive to both, myelinated and unmyelinated axons 9, thus an offset could compensate for this mismatch. With this limitation in mind, our results emphasise the necessity to introduce a calibration and interestingly the calibration constant that explained most of the variation in the data was different for the DWI-models. One might speculate that since in NODDI and NODDIDTI the diffusivities are assumed to be fixed, they benefited most from a scaling constant that accounted for potential variation of diffusivity across mice models. A potential limitation of WMTI is the neglection of WM fibre dispersion. Whether this could explain the improvement of WMTI due to an additional offset needs further investigations. Overall, the models became more comparable when using both offset and scaling, indicating that such a calibration can explain a relevant part of the data in all cases. Another interesting observation was that when no calibration was used, NODDIDTI was closest to the gold standard data. This could be related to rejected data points that do not fulfill its model conditions 8 – here 10%.Conclusions
Our analysis showed that without calibration (as in all in vivo g-ratio mapping studies to date), NODDIDTI should be used for g-ratio mapping. If calibration can be performed, it is sufficient to estimate the offset for the WMTI-based $$$f_A$$$ and the slope for the NODDI-based $$$f_A$$$. These conclusions, however, assume that the gold-standard accounts only for the fraction of myelinated axons.Acknowledgements
(M.F.C.) The Wellcome Centre for Human Neuroimaging is supported by core funding from the Wellcome [203147/Z/16/Z].
(M.D.D.) NIH grant EB019980
(S.M.)This work was supported by the German Research Foundation (DFG Priority Program 2041 "Computational Connectomics”, [MO 2397/5-1; MO 2249/3–1], by the Emmy Noether Stipend: MO 2397/4-1) and by the BMBF (01EW1711A and B) in the framework of ERA-NET NEURON.
References
- Stikov, N. et al. (2015) ‘In vivo histology of the myelin g-ratio with magnetic resonance imaging’, NeuroImage, 118, pp. 397–40.
- Campbell, J. S. W. et al. (2018) ‘Promise and pitfalls of g-ratio estimation with MRI’, NeuroImage, 182, pp. 80–96.
- Mohammadi, S. and Callaghan, M. F. (2020) ‘Towards in vivo g-ratio mapping using MRI: Unifying myelin and diffusion imaging’, Journal of Neuroscience Methods, p. 108990.
- Kelm, N. D. et al. (2016) ‘Evaluation of diffusion kurtosis imaging in ex vivo hypomyelinated mouse brains’, NeuroImage, 124, pp. 612–626.
- West, K. L. et al. (2018) ‘Experimental studies of g-ratio MRI in ex vivo mouse brain’, NeuroImage, 167, pp. 366–371.
-
Fieremans, E.,
Jensen, J. H. and Helpern, J. A. (2011) ‘White matter characterization with
diffusional kurtosis imaging’, NeuroImage, 58(1), pp. 177–188.
- Zhang, H. et al. (2012) ‘NODDI: Practical in vivo neurite orientation dispersion and density imaging of the human brain’, NeuroImage, 61(4), pp. 1000–1016.
- Edwards, L. J. et al. (2017) ‘NODDI-DTI: Estimating Neurite Orientation and Dispersion Parameters from a Diffusion Tensor in Healthy White Matter’, Frontiers in Neuroscience, 11, p. 720.
- Beaulieu, C. and Allen, P. S. (1994) ‘Determinants of anisotropic water diffusion in nerves’, Magnetic Resonance in Medicine, 31(4), pp. 394–400.
Figures
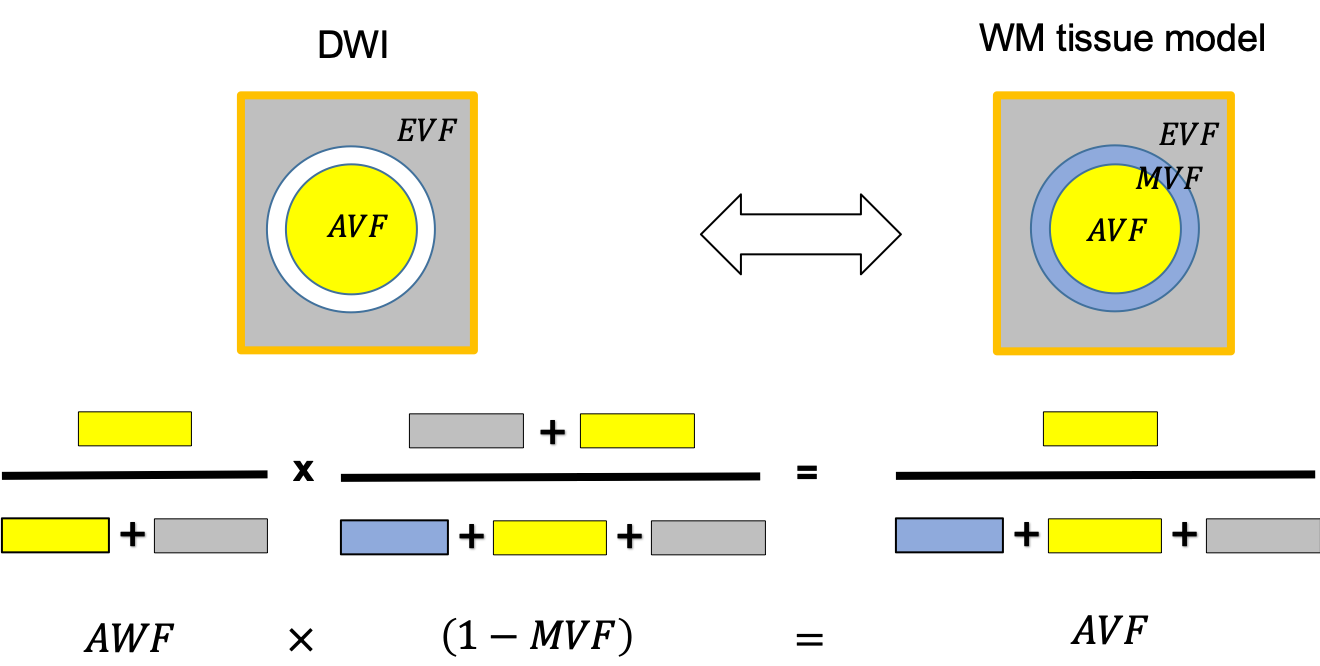
Figure 1: Schematic of the relationship between three-compartment WM tissue model and the DWI. Here, WM is assumed to be composed of three tissue compartments: axonal ($$$AVF$$$), myelin ($$$MVF$$$), and extracellular volume fraction ($$$EVF$$$). Since myelin is DWI-invisible, the axonal compartment accessible via DWI is the axonal water fraction ($$$AWF$$$). Hence DWI-based biomarkers for the axonal compartment have to be rescaled by to yield an estimate
$$f_A=(1-\mu)AWF\qquad (1)$$
of the $$$AVF$$$. This information has to be acquired from another technique.