2030
Comparison of high-resolution DTI in ex vivo newborn and adult marmoset brain1Stanford, Stanford, CA, United States, 2Buck Institute, Novato, CA, United States
Synopsis
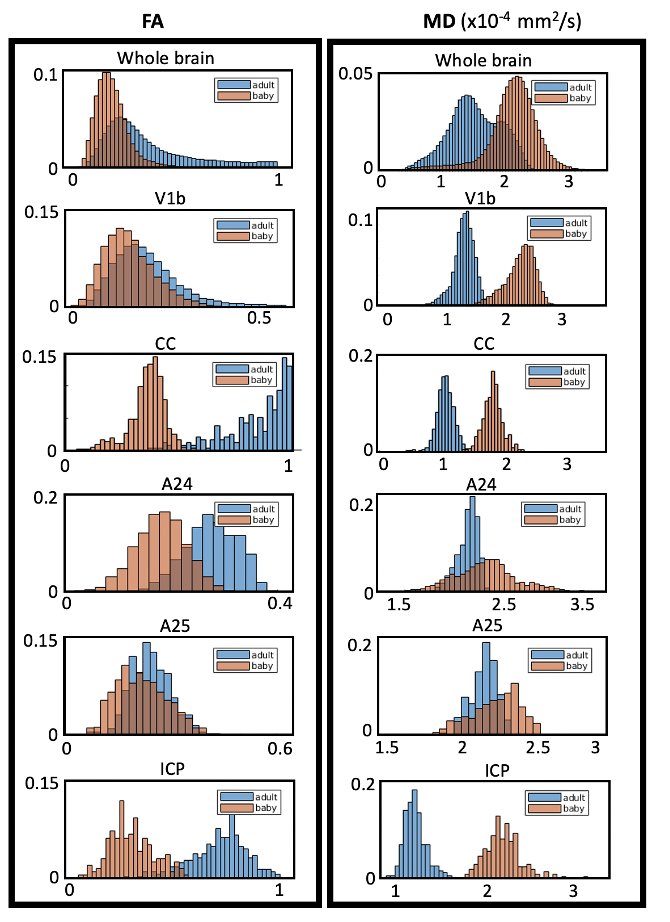
High-resolution (0.15 mm isotropic) diffusion MRI of newborn and an adult marmoset brains were acquired. For the adult marmoset brain the diffusion MRI data of anterior and posterior parts of the brain were separately acquired and subsequently co-registered. Across the whole brain, fractional anisotropy (FA) was lower and mean diffusivity (MD) was higher (Fig. 4) in the newborn compared to the adult. The biggest differences were observed in white matter. Cingulate cortex region A25 showed the smallest difference, which aligns with previous studies showing its early stage development
Introduction
The development of neuronal trajectories in primates fundamentally differs from that of rodents. While rodent cortico-cortical projections adopt trajectories directly through the gray matter, primate projections form fascicles within the white matter[1]. Therefore a primate model of neurodevelopment is essential and marmoset brains offer many advantages[1-2]. A marmoset’s brain is underdeveloped at birth compared to macaques and therefore enables the study of substantial neurodevelopmental changes ex utero. Further, marmosets can be genetically modified to build primate disease models that manipulate brain development, and are sufficiently small to fit in a small bore animal MRI scanner, which offers the benefit of higher field strength and higher performance gradients. Here, we develop a unique two stage acquisition of high-resolution (0.15 mm isotropic) diffusion tensor imaging (DTI) in ex vivo marmoset brains. We compare diffusion MRI metrics from an ex vivo newborn and adult marmoset brain to provide insight into differential developmental timelines across brain regions. We hypothesized that the adult brain would be broadly more myelinated than the newborn brain and therefore demonstrate higher fractional anisotropy (FA) values. We show preliminary results from 5 regions of interest (ROIs) including cortical gray matter and white matter tracts. We further hypothesize that FA differences between the adult and newborn will be smaller for A25, which is known to develop earlier than A24[3-5].Methods
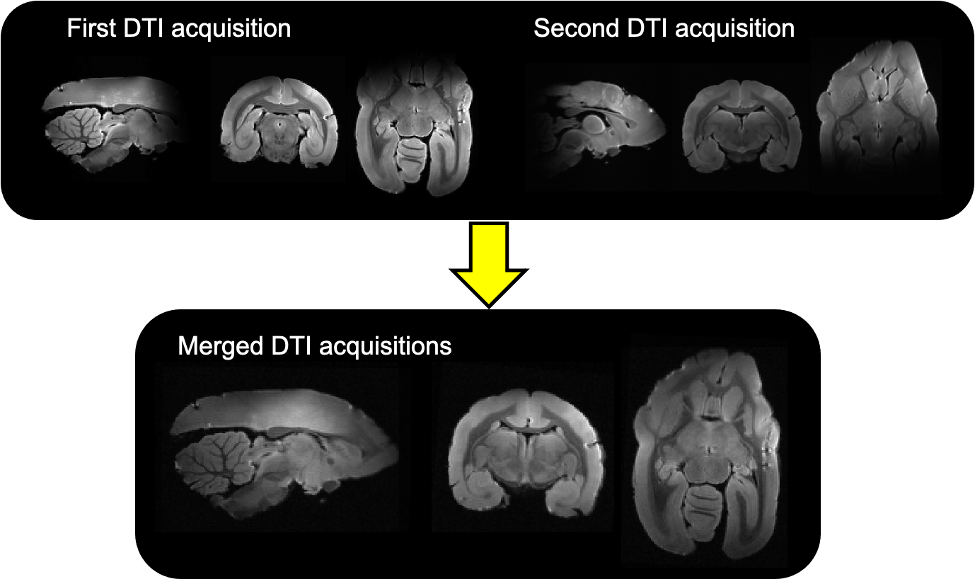
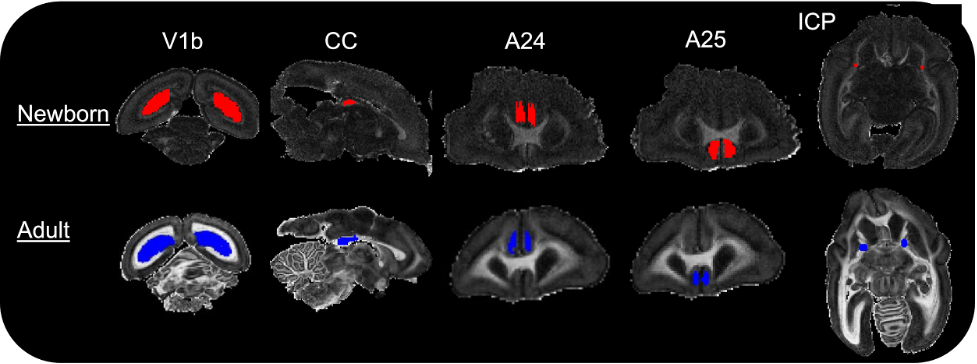
Brain preparation: The brain of a day old newborn and one male adult at reproduction age were extracted and post fixated in 4%PFA for a week before being stored in refreshed fixative liquid at 4 degrees celsius until scanning preparation. Before the scan, they were transferred into a 50mL falcon tube filled up with a non-protonated fluid and degassed for 3 hours to remove air bubbles prior to MRI scanning. Diffusion MRI (dMRI) set up: High-resolution dMRI data were acquired on a 7T Bruker animal scanner using a 40mm Varian millipede coil. Newborn marmoset MRI acquisition: DMRI data were acquired on the newborn marmoset brain using a 3D segmented EPI diffusion-weighted spin echo with TE/TR = 40.41/400 ms, 6 segments per partition, 0.15 mm isotropic voxels, 3-diffusion encoding shells (b=1000s/mm2 x 100 directions, b=2000s/mm2 x 110 directions, b=4000s/mm2 x 190) and 80 b0 images for a total scan time of 52 hours. Adult marmoset MRI acquisition: DMRI data were acquired on the adult marmoset brain in two stages to accommodate the larger brain size, which exceeded the sensitive region of the RF coil. First a 24 hour scan was acquired with the anterior portion of the brain centered at isocenter. The brain specimen was then moved such that the posterior portion of the brain was centered at isocenter and the same 24 hour scan was repeated (Fig. 1). A region of overlap between the two acquisitions aided accurate co-registration. The parameters for each 24 hour scan were: a 3D segmented-EPI diffusion-weighted spin echo with: TE/TR=43/980ms, 8 EPI segments per partition, 3-diffusion-encoding shells (1000s/mm2, 2000s/mm2, 4000s/mm2)x 40 directions per shell and 0.22mm isotropic voxels. Co-registration of the anterior and posterior acquisitions of the adult marmoset: The anterior and posterior acquisitions were co-registered using a landmark-based co-registration in 3DSlicer by placing 6 registration fiducials at distinct anatomical landmarks inside the overlapped region[6]. ROI delineation: The ROIs (Fig. 3) include regions within: area V1b in the visual cortex, areas A24 and A25 in the cingulate cortex, the splenium at the midline of the corpus callosum (CC) and the motor tract at the level of the posterior limb of the internal capsule (ICP). The ROIs were manually drawn using a recently published marmoset brain atlas [7] as a guide.Results and discussion
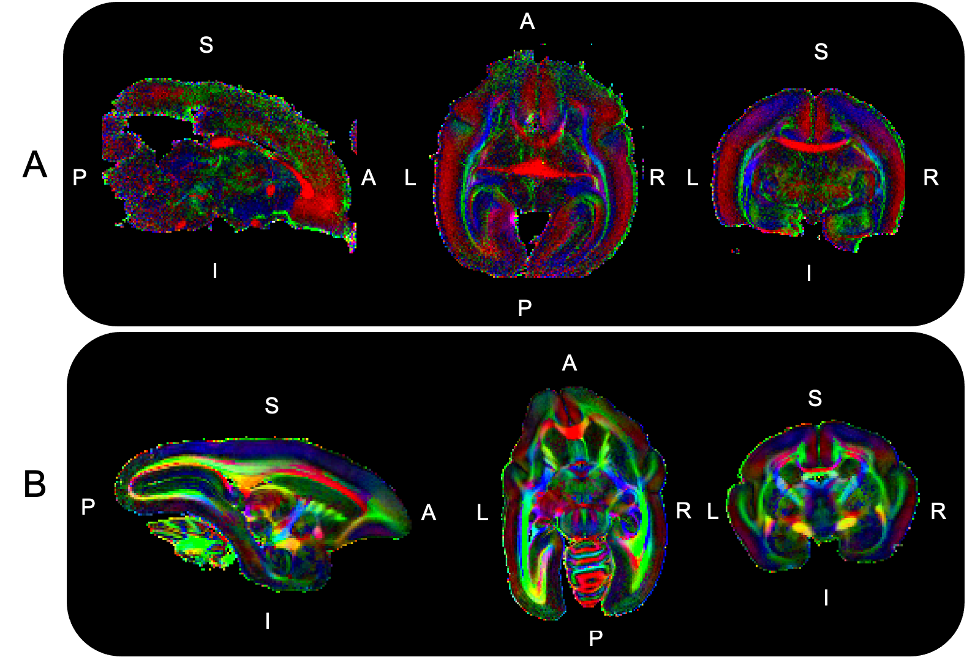
The separate DTI acquisitions of the anterior and posterior halves of the adult marmoset brain (Figs. 1 and 2) were successfully aligned and merged into a single high-resolution, high SNR DTI dataset without any observable discontinuities. Across the whole brain, fractional anisotropy (FA) was lower and mean diffusivity (MD) was higher (Fig. 4) in the newborn compared to the adult. The biggest differences were observed in the white matter with 114% +/- 9% lower mean FA in the CC and 109% +/- 9% lower FA in the ICP for the newborn compared to the adult. A smaller but significant difference was observed in A24 ( 52% +/- 3% lower FA) and V1b (38% +/- 4% lower FA) in the newborn compared to the adult. No significant FA difference was observed for A25 in the newborn compared to the adult (Fig. 4). Inline with our hypothesis, a larger change in FA was observed for cortical area A24, which is known to develop at a later stage, compared to area A25. This inspires confidence that high-resolution dMRI can probe the varying timeline of marmoset neurodevelopment in different brain regions. The significant difference in newborn FA values compared to the fully developed adult brain highlights the substantial continued neurodevelopment that occurs in marmoset after birth and therefore the opportunity to probe the timeline of these changes.Acknowledgements
The authors would like to express their acknowledgement to the Wu Tsai Neuroscience Institute and the National Institute of Health (NIH) for their financial support.
The author would like to notify that the Dr. McNab and the Dr. Haroush are co-senior authors of this study.
References
[1]Liu, C., Ye, F.Q., Newman, J.D. et al. A resource for the detailed 3D mapping of white matter pathways in the marmoset brain. Nat Neurosci 23, 271–280, 2020
[2]Watakabe, Akiya & Hirokawa, Junya, Cortical networks of the mouse brain elaborate within the gray matter, Brain Structure and Function, 223, 2018
[3]Majka P., Reser D. H., Wojcik D. K., Rosa M. G.P. , Wang X.-J., Structural attributes and principles of the neocortical connectome in the marmoset monkey, bioRxiv, 2020
[4]Hikishima K., Sawada K., Murayama A.Y. , Komaki Y. , Kawai K. , Sato N. , Inoue T. , Itoh T., Momoshima S., Iriki A., Okano H.J., Sasaki E., Okano H., Atlas of the developing brain of the marmoset monkey constructed using magnetic resonance histology, Neuroscience, 230, 102-113, 2013
[5]Bourne J.A., Rosa M.G. Hierarchical development of the primate visual cortex, as revealed by neurofilament immunoreactivity: early maturation of the middle temporal area (MT). Cereb Cortex, 16(3):405-14, 2006
[6]Sawiak S J , Shiba Y, Oikonomidis L, Windle C P, Santangelo A M, Grydeland H, Cockcroft G, Bullmore E T, Roberts A C, Trajectories and Milestones of Cortical and Subcortical Development of the Marmoset Brain From Infancy to Adulthood, Cerebral Cortex, 28(12): 4440–4453, 2018
[7]Fedorov A., Beichel R., Kalpathy-Cramer J., Finet J., Fillion-Robin J-C., Pujol S., Bauer C., Jennings D., Fennessy F.M., Sonka M., Buatti J., Aylward S.R., Miller J.V., Pieper S., Kikinis R. 3D Slicer as an Image Computing Platform for the Quantitative Imaging Network. Magn Reson Imaging. 30(9):1323-41, 2012
Figures